













































![Email Your Way to Black Friday Sales: 27 Brilliant Campaign Examples [+ Templates]](https://clevertap.com/wp-content/uploads/2025/07/Black-Friday-Email-Examples-Templates.png)



![20 Examples of Cyber Monday Emails For Inspiration [+ Best Practices]](https://clevertap.com/wp-content/uploads/2025/08/Cyber-Monday-Email-Examples.png)










Free Customer Engagement Guides
Join our newsletter for actionable tips and proven strategies to grow your business and engage your customers.


Heads Data Science.Expert in AI, Data & Analytics and awarded 40 under 40 Data Scientists in India.
Se proyecta que los consumidores de EE. UU. gasten un récord de 13,1 mil millones de dólares en Halloween este
Os consumidores dos EUA devem gastar um recorde de US$ 13,1 bilhões com o Halloween este ano, e boa parte
Cyber Monday is no longer Black Friday’s digital after-party. Today, it’s the single biggest revenue moment of the holiday season.
Email marketing is the unsung hero of Black Friday. During the year’s biggest shopping event, a well-timed email can directly
As marketers, we love seeing a campaign perform. Nothing beats the feeling when we get to say, “The campaign looks
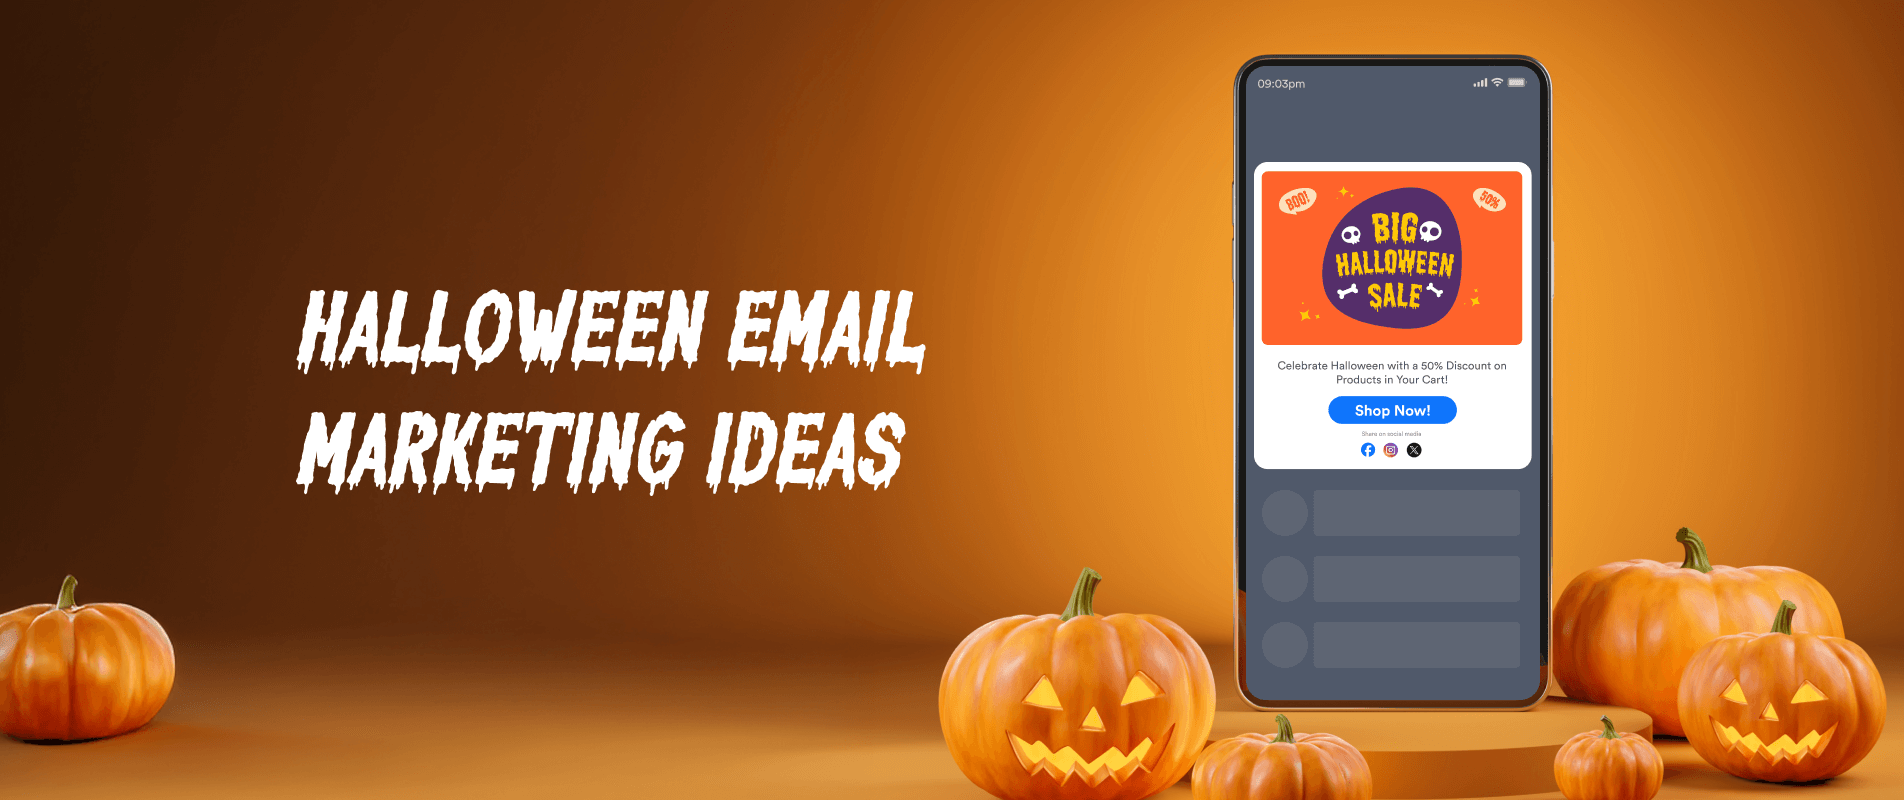
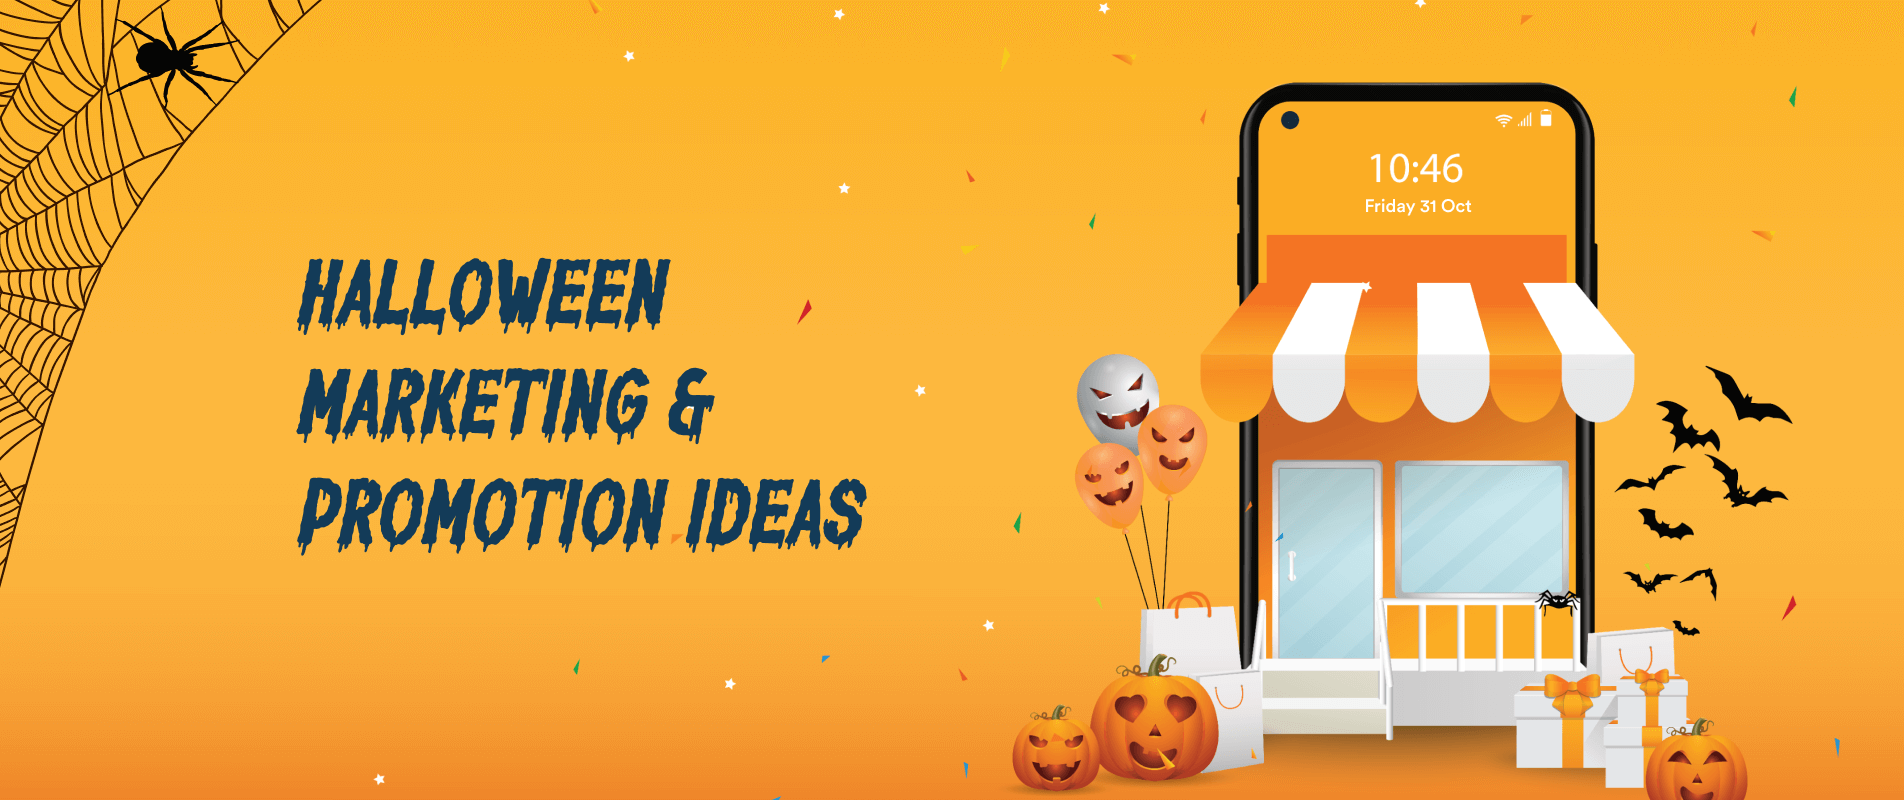
Halloween is a big deal for kids and adults alike. People spend lavishly to celebrate with costumes, candy, and decorations.
I. The Letter In 1834, a merchant in Bombay sat down to write a letter to his agent in London.
A shopper adds a pair of running shoes to her cart. Minutes later, she removes them, compares a more expensive
Growth marketers across industries have been following the same operating model for years: define the segment, plot the journey, decide
Personalization has always been a North Star for marketers. Towards that goal, we have gradually moved over the years from
An email stays in a shopper’s inbox, ready to be opened when the moment is right. Cyber Monday emails, in
Black Friday has evolved from a single-day rush into a high-stakes, multi-week retail event. Online spending keeps smashing records: U.S.
In the previous article, we looked at some of the ways to compare different numerical variables. In this article, we
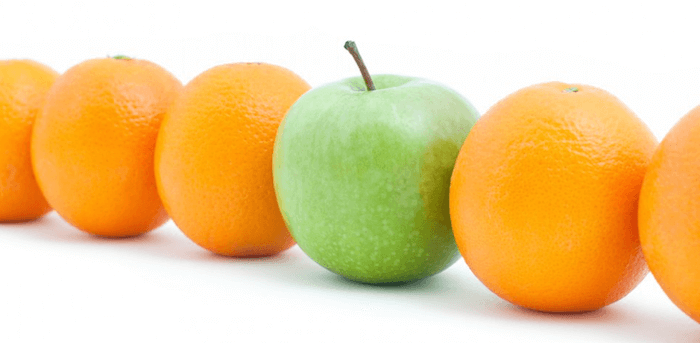
How often have you come across the idiom "Comparing apples and oranges". It is a great analogy to articulate that two things can't
In the previous article, we discussed how sampling could turn your Big Data to Smart Data and briefly laid out
Big Data is the buzzword of our current times. A majority of the firms either use or wish to use
Visualizing time series data for the analysis of numerical information like revenue, app launches, uninstalls, etc. can help analysts quickly
In the previous article, we discussed some techniques to deal with missing data. We will now look at an example
In the previous article, we discussed what an outlier is and ways to detect such outliers with parametric and non-parametric
One of most excruciating pain points during Data Exploration and Preparation stage of an Analytics project are missing values. How
An Outlier is an observation or point that is distant from other observations/points. But, how would you quantify the distance
The most widely used coordinate system to represent data is the Cartesian coordinates followed by Polar coordinates. Source: Wikipedia Basically,
Why would you want to convert a numerical variable into categorical one? Depending on the situation, it can lead to
As an analyst, you can explore the relationship between variables both quantitatively and visually. However, only looking at the quantitative
Free Customer Engagement Guides
Join our newsletter for actionable tips and proven strategies to grow your business and engage your customers.