






















































Free Customer Engagement Guides
Join our newsletter for actionable tips and proven strategies to grow your business and engage your customers.
In the previous article, we discussed what an outlier is and ways to detect such outliers with parametric and non-parametric
In my last article we saw how to derive insights from a conventional cohort analysis and drive marketing efforts where necessary.
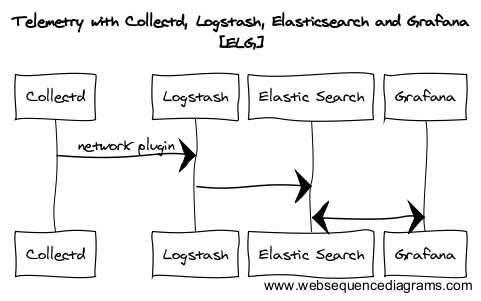
We are obsessed with collecting system and application metrics. This helps us make data driven, logical infrastructure decisions. When we
An Outlier is an observation or point that is distant from other observations/points. But, how would you quantify the distance
The most widely used coordinate system to represent data is the Cartesian coordinates followed by Polar coordinates. Source: Wikipedia Basically,
Why would you want to convert a numerical variable into categorical one? Depending on the situation, it can lead to
As an analyst, you can explore the relationship between variables both quantitatively and visually. However, only looking at the quantitative
In the world of data analysis, one tool is often left unused. While being a very powerful analytics tool, cohorts
Most App developers are obsessed with downloads - how many new users did I get this week and last? They
"If you’re tracking too many things, you're really not tracking anything", I overheard someone at the office say. I thought
Need a dump of all that data when you are doing deep analytics? All of our Histograms within the dashboard
Free Customer Engagement Guides
Join our newsletter for actionable tips and proven strategies to grow your business and engage your customers.