


Table of Contents
Categories
Most Popular


With a large majority of the global workforce under home quarantine and shelter-in-place orders, there’s been a significant impact to every mobile brand’s Daily Active Users (DAUs) as our Q1 Data Report shows.
This just underscores the need to stay on top of what’s happening within your app and your user base. Because things can change quickly in a period of uncertainty.
As marketers who want to build effective campaigns, you need to see how every campaign is performing, what users do within the app, even how close a user is to converting. Having all this data will allow you to pivot when customers aren’t responding to your marketing and deploy ad hoc campaigns when necessary.
Here are the 5 analytics reports that can help you track your mobile marketing performance right now:
1. Real Impact: See If Your Marketing is Hitting Your KPIs
Real Impact is a dashboard that gives you a consolidated view of how your marketing is impacting the larger business KPIs that you’re being measured against.
How are users responding to your marketing tactics? How much revenue are you generating?
With this dashboard, you can look at anything from average revenue per user to churn statistics to number of conversions — any KPI that matters to your company — and over any duration of time. This allows you to see exactly what impact your marketing has on your KPIs. And all in a single glance.
The Real Impact dashboard gives you a complete overview of your ROI, allowing you to tie marketing dollars spent to dollars earned.
Use Real Impact to Answer:
- How many conversions/uninstalls/DAUs do we have right now?
- How close are we to hitting our KPI this quarter?
- What is my mobile marketing ROI?
More information: Real Impact: Connect the Dots Between Marketing Actions and Business Metrics
2. Funnels: Engage Users Where They Drop Off
Funnel analysis allows you to see how many users are completing each step in the conversion process and discover where they’re dropping off. Then do something about that drop in engagement.
With Funnels, you can group users who accomplish a specific event in your app and compare how many of those users go on to accomplish a second event in your app within a specific period of time.
For example: you might want to build a funnel to look at the users who launched your app within the last 30 days and then signed up but did not even view a single product. Once you see the dropoffs you can actually proceed to create a campaign on the spot for that segment since Funnels are actionable. Perhaps send a coupon offer that draws those users back into the app or an educational push notification that helps educate them on the value your app delivers.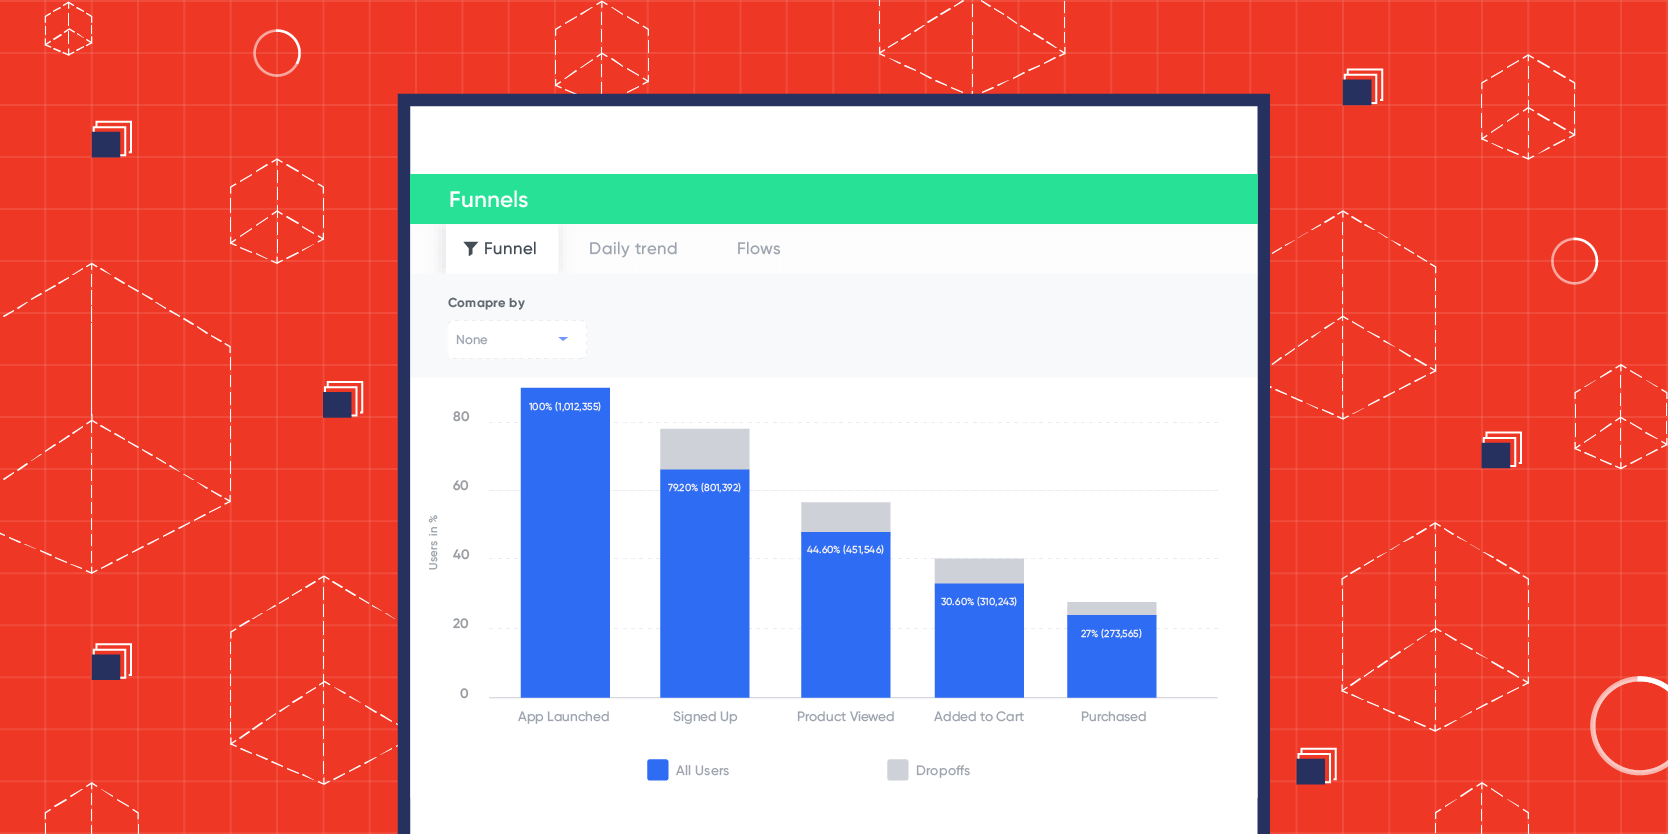
Funnels can tell you who launched the app and signed up but didn’t view any products, allowing you to create a specific campaign targeting those users.
Use Funnels to Answer:
- Which users launched but didn’t register?
- Which users added an item to cart but didn’t purchase?
- Which users purchased an item but uninstalled?
More information: Uncover Your App Drop-offs and Increase Conversions
3. Flows: Find the Paths to Conversion & Lead Users There
Flows is a visualization report that shows you every possible path a user can navigate through your app. This allows you to identify the paths that lead a user to a conversion, so you can consciously guide them down that path. It also shows you the common paths that lead to uninstalls and churn.
Flows retrace the steps that a user took before uninstalling, giving you the chance to address those issues for other users. It also tell you what most users do to reach a conversion step, so you can prompt other users to take those same steps.
Flows is the simplest way to see exactly how users make their way through your app, and where you should be improving the journey.
Use Flows to Answer:
- What did users do before uninstalling?
- What do users immediately do after launching your app?
- What steps do users take to perform a selected set of events? (e.g.: saving items to a wishlist)
For more on flows: Instantly Find All Paths to Conversion With Flows
4. Cohorts: Discover Downward Trends to Reverse Them
Cohort Analysis is a way of grouping users who perform any event within your app (e.g., all users who signed up for a trial account in the last 3 days) and tracking their behavior over time.
With cohorts, you can spot general trends within each grouping, allowing you to adapt or pivot your marketing to fit those trends.
This means you can better understand retention or churn by measuring how long it takes users who have launched your application to come back and launch it a subsequent time over a specific time frame.
You can use it to measure engagement by tracking the amount of time between a user browsing one recipe and then the next recipe over a span of 12 weeks.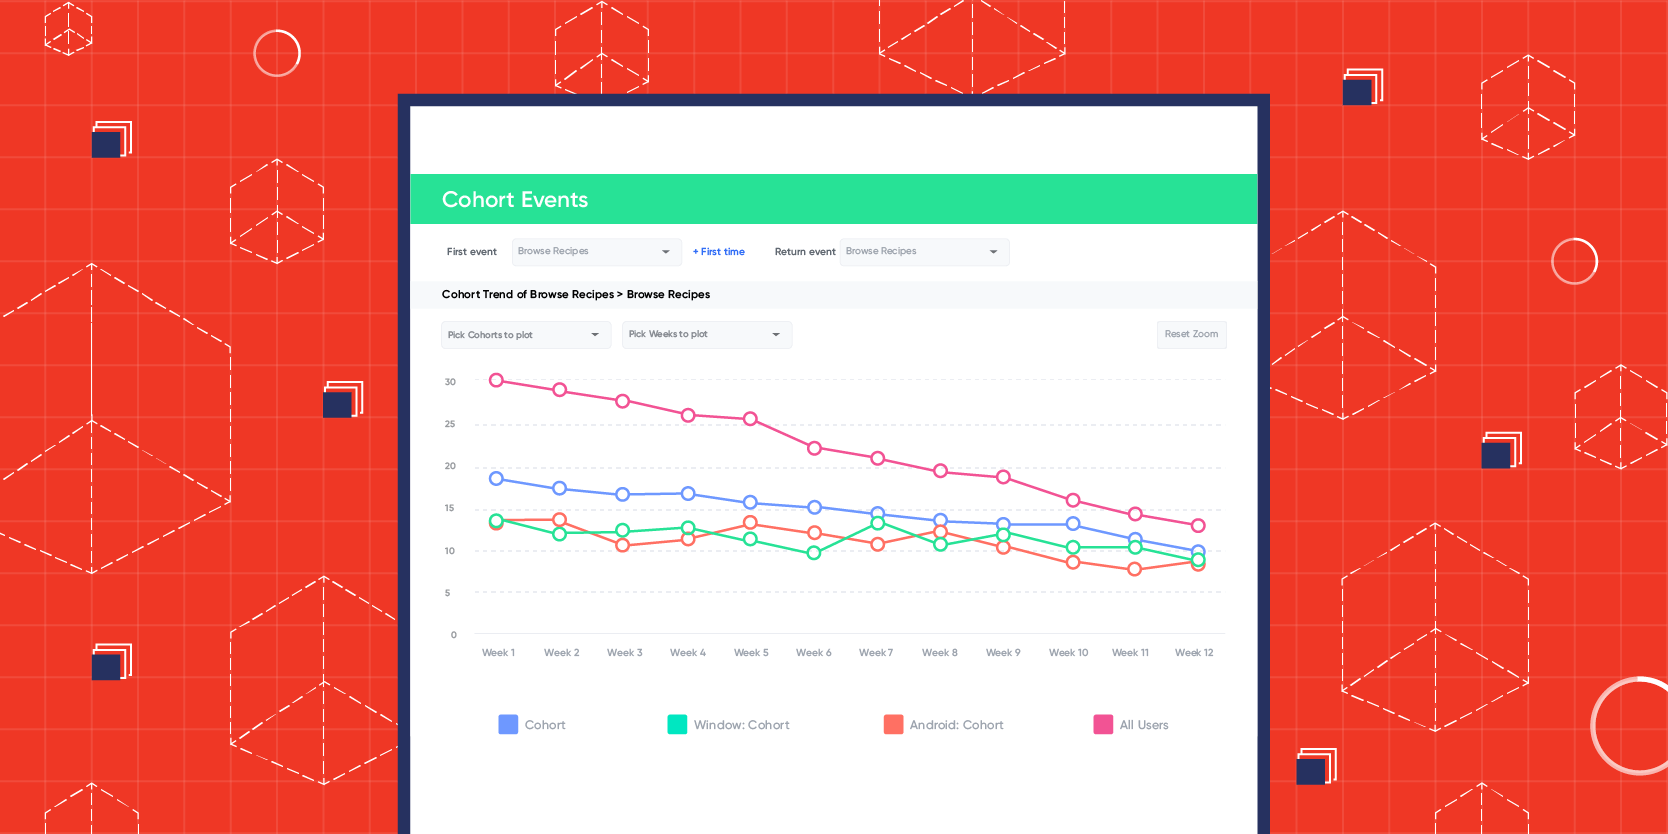
Cohorts can tell you a story over time as you examine user behavior from event to subsequent event.
Like Funnels, Cohorts are actionable, meaning if you see something that needs attention, you can immediately create a segment or a campaign for that cohort.
Use Cohorts to Answer:
- How long does it take from first app launch to next app launch? (measures retention)
- How long does it take from the first app launch to an actual purchase? (measures conversion)
- After watching one video, how long does it take for a user to play the next video? (measures engagement)
5. Pivots: Get the Complete Picture of Your Data
The Pivots analytics report summarizes your data and lets you slice it with the help of tables and other data visualizations. A Pivot analysis is especially useful when dealing with large volumes of data, as it allows you to create incisive summaries and view custom reports to gain insights into the success or failure of an event.
For example: let’s say you want to find out which albums and genres are most popular at what time of day. Pivots tell you the complete story by allowing you to look at the data in a spreadsheet view and pivot on specific properties.
With Pivots, you can slice and dice your data like in any spreadsheet— to uncover a more complete picture of your app’s usage.
Use Pivots to Answer:
- Which product categories are selling best at what time of day?
- How many minutes of video do my loyal customers consume every day of the week?
- In which city are my sales for hand sanitizer the lowest?
More information: Analyze Hidden Patterns in Your Data with Pivots
Why These Analytics Reports Matter Right Now
As marketers, you work in a data-driven environment. And decisions must be made based on insight from your data, not intuition. Particularly during a period when so many of the user habits you’ve come to count on have been changed by our public health circumstances.
Having access to these 5 analytics reports in your mobile marketing platform ensures that you get more than just data — you gain insight into what your users are doing and what marketing actions you must do next. This speed between knowledge and action can spell the crucial difference between keeping your precious customers or quickly losing them.

See how today’s top brands use CleverTap to drive long-term growth and retention
Shivkumar M 
Head Product Launches, Adoption, & Evangelism.Expert in cross channel marketing strategies & platforms.
Free Customer Engagement Guides
Join our newsletter for actionable tips and proven strategies to grow your business and engage your customers.
