


Table of Contents
Categories
Most Popular


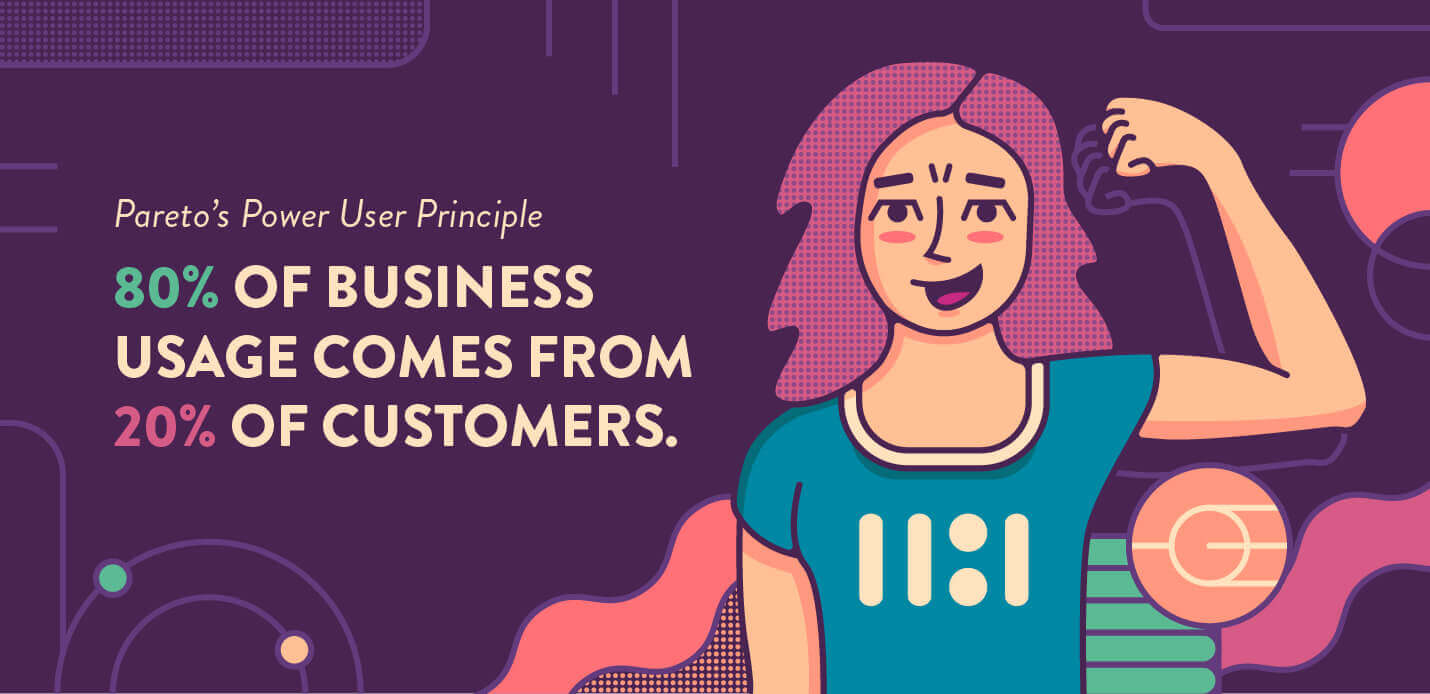
If 80% of your product usage comes from 20% of your users, you’re not alone. That’s the Pareto Principle in action. These 20% are your power users.
These are the users who log in frequently, engage deeply with your product’s features, share detailed feedback, and often bring in new users through referrals. Despite their significant impact on growth and retention, many businesses don’t give this cohort the attention it deserves.
This article explores who power users are, how to identify and analyze their behavior, and why they’re crucial for long-term growth. You’ll also discover strategies to engage them effectively and how CleverTap helps scale that impact.
What Is a Power User?
A power user is someone who engages with your product frequently, deeply, and with a higher-than-average impact on business metrics. Unlike passive users who might use only the basic features, power users explore the full range of your platform, often pushing its limits and providing valuable product insights.
Power users = high-frequency + high-intent + high-value.
While it’s tempting to define them just by usage frequency, the real signal lies in depth of interaction, long-term retention, and influence on others.
Power users aren’t exclusive to one industry. For instance:
- A rideshare power user, like an Uber customer, might ride multiple times a week, not just for special occasions, but as a default transportation option.
- A B2B power user of a tool like Slack might log in consistently every weekday, using the platform extensively during working hours.
These behaviors transcend sectors and are a strong signal of product fit and habitual reliance.
Importance of Power Users for a Business
Power users are the bedrock of sustainable, compounding growth. Businesses that succeed at scale often do so because they maximize value from their most engaged ones.
Here’s why:
- Retention: Power users return repeatedly because they’ve found long-term value in your product. They anchor your retention curve and are less susceptible to churn compared to light or moderate users.
- Revenue: These users are often the first to explore premium features, purchase subscriptions, or engage in upsell paths. In freemium models, they represent a disproportionately high share of revenue through in-app purchases or plan upgrades.
In products with lower frequency engagement, monetization becomes even more critical. Think of professional networking apps like LinkedIn. Users may not log in daily, but well-timed, high-value interactions can drive premium conversions.
- Feedback: Power users provide detailed, context-rich feedback. Since they explore more features and spend more time in the product, their feedback often highlights both high-impact bugs and valuable product improvement ideas.
- Advocacy: They’re natural brand evangelists. From writing reviews and testimonials to posting tips in forums or sharing use cases on LinkedIn, their organic outreach generates trust at scale.
- Product-Market Fit Signal: Power users are often early indicators of product-market fit. Their willingness to adapt workflows around your product and recommend it to peers is a sign that the core value proposition is resonating. Tracking what keeps power users engaged can help prioritize roadmap decisions for broader adoption.
Businesses that fail to segment and nurture their power users risk leaving significant value on the table. These users not only generate revenue but also provide the behavioral patterns and feedback that help convert casual users into loyal ones.
Analyzing What Makes Power Users Tick
Power users not only behave differently in volume, but they also behave differently in kind. Understanding what sets them apart can help product, marketing, and analytics teams refine how they segment, engage, and retain users at scale.
Product Usage Patterns
To truly understand power user behavior, surface-level metrics aren’t enough. You need to look at how these users interact with your product flow:
- Session Frequency: Daily engagement is a starting point, but go further. How often do they return after specific actions? For example, in a food delivery app, a power user might check the app every Friday evening and again on Sunday, suggesting routine-based engagement.
- Session Depth: How many actions do they take per session? Are they just browsing or adding items to their wishlist, using filters, checking reviews, and purchasing all in one go? These micro-patterns point to serious purchase intent.
- Feature Flow: Do they follow a consistent path through your core features like home → search → filter → add to cart—or jump between sections fluidly?
- Feature Stacking: This is when users combine features to create a compound value. For example, in a dashboard, a user might upload a dataset, run filters, visualize it, and share a report all within one session. These behaviors are highly predictive of long-term retention.
Behavioral Triggers by Industry:
Understanding which actions signal a power user varies by domain. For example:
- Ecommerce: Repeat purchases, filter use, wishlist saves, coupon redemptions.
- Gaming: Consecutive daily logins, leaderboard rankings, feature unlocks.
- Media/Streaming: Playlist curation, binge-watching sessions, social shares.
- Fintech: Weekly login frequency, SIP management, feature bundling.
- Travel & Hospitality: Frequent searches, last-minute bookings, loyalty program redemptions, destination-based personalization.
- Food Delivery: Multiple weekly orders, scheduled deliveries, preference for combos or reordering past favorites, use of ratings or reviews.
These industry-specific triggers can help you tune your segmentation and journey strategies.
With CleverTap, you can use event combination filters in funnels to discover these stacked behaviors, then use Journey Builder to trigger tailored nudges based on them.
Feedback and Support Signals
The most valuable insights from beyond just the analytics dashboards also come from what power users say (and how often they say it).
- Support Interactions: Power users often write in with requests like, “Can I automate this step?” or “This feature should integrate with X.” These are signs they want to go deeper with your product. Track these requests, especially if they repeat across users.
- NPS and CSAT Comments: A high NPS score is great. But a high score with context is gold. If a user gives you a 9 and adds, “I just wish I could clone my workflow from last week,” that’s direct UX input and a roadmap clue.
- Community Forums: In many verticals (fintech, gaming), power users show up in community Slack groups or help centers to support newer users. This behavior is a trust marker and also a signal that they’re invested in your ecosystem. Consider promoting them to superuser or ambassador roles.
What Is a Power User Curve?
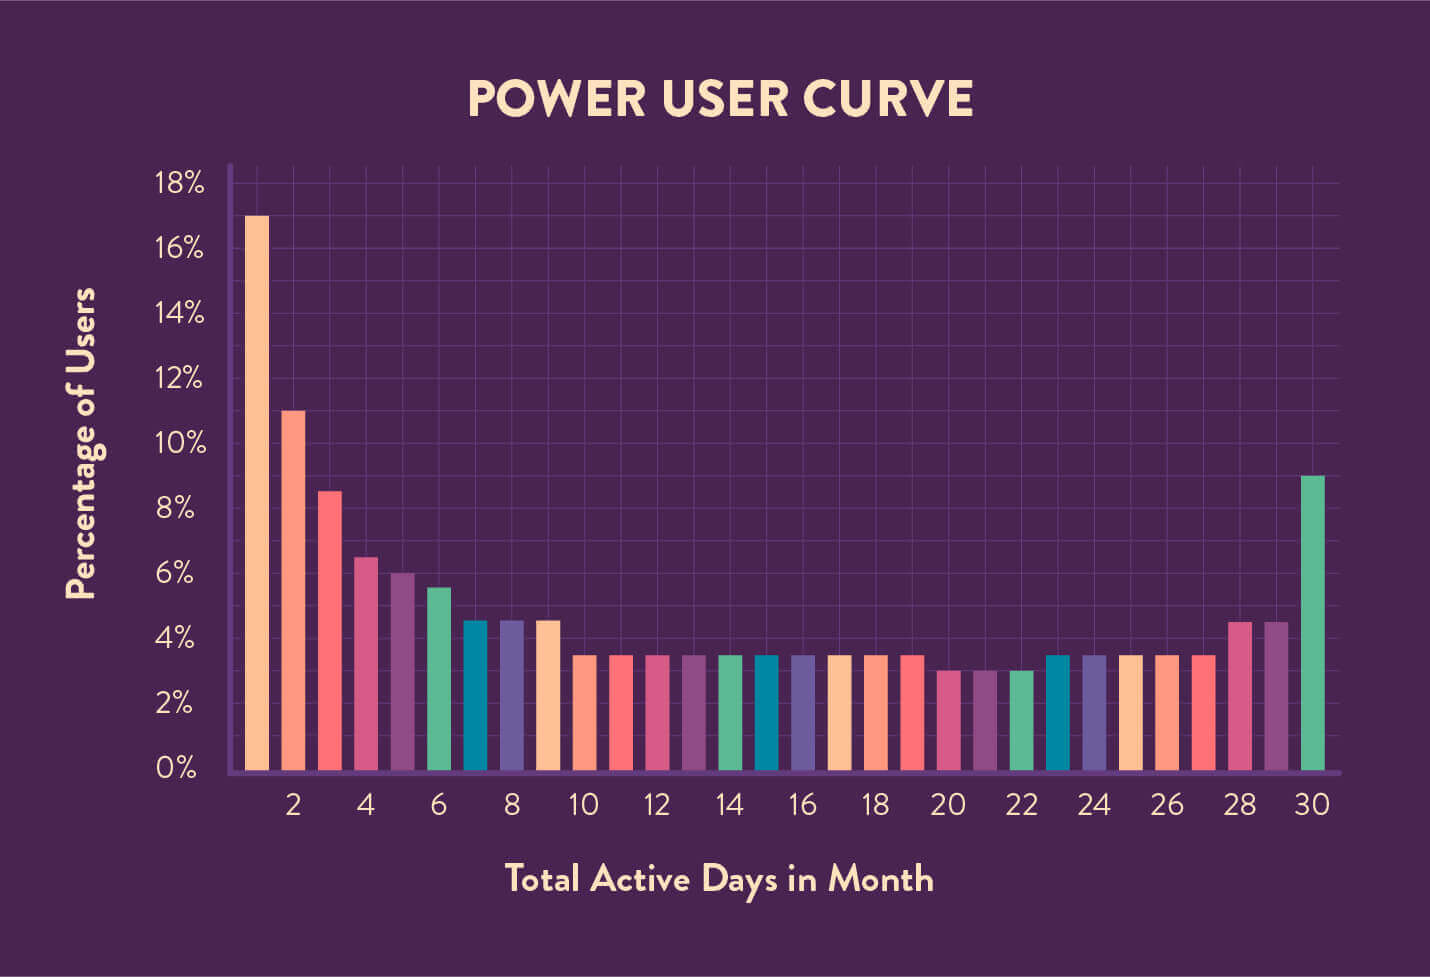
The Power User Curve is a histogram that plots the number of days a user is active in a given time period. It’s a visual way to see if your product is building habit-forming behavior. The X-axis shows the number of active days per user, while the Y-axis shows how many users fall into each group.
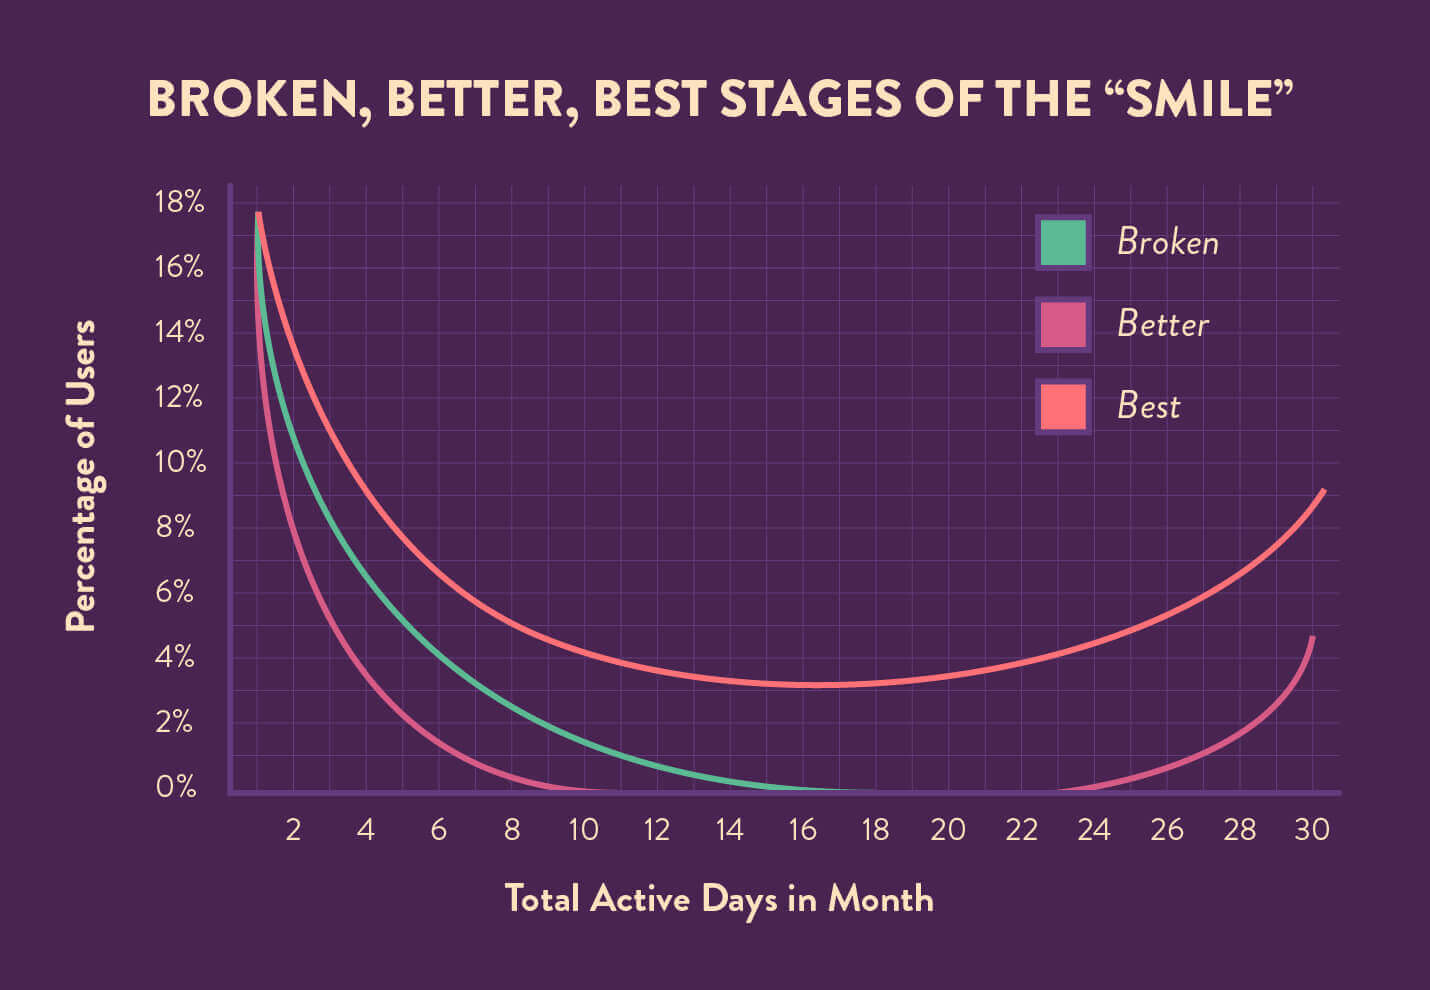
Power User Curve Smile
A “smile” curve is a visual representation of a healthy product engagement pattern. When plotted as a histogram showing user activity over a specific timeframe, it reveals three distinct clusters:
- A concentration of light users on the left: new users or those who engage occasionally.
- A dip in the middle: moderate users who engage sporadically but haven’t developed strong habits.
- A spike on the right: power users who engage frequently and deeply with your product.
This smile-shaped curve suggests your product appeals to a wide audience while successfully converting a meaningful portion into highly engaged, loyal users.
Why it matters:
- Signals product stickiness: Users are developing routines around your app.
- Highlights conversion success: You’re not only acquiring users but also nurturing them into high-value segments.
- Enables reverse engineering: By analyzing what moved users from left to right, you can recreate these journeys across your user base.
A right-leaning, crooked smile (or even a checkmark shape) is best, as it indicates that your product not only attracts users but also gradually molds them into loyalists through effective engagement strategies.
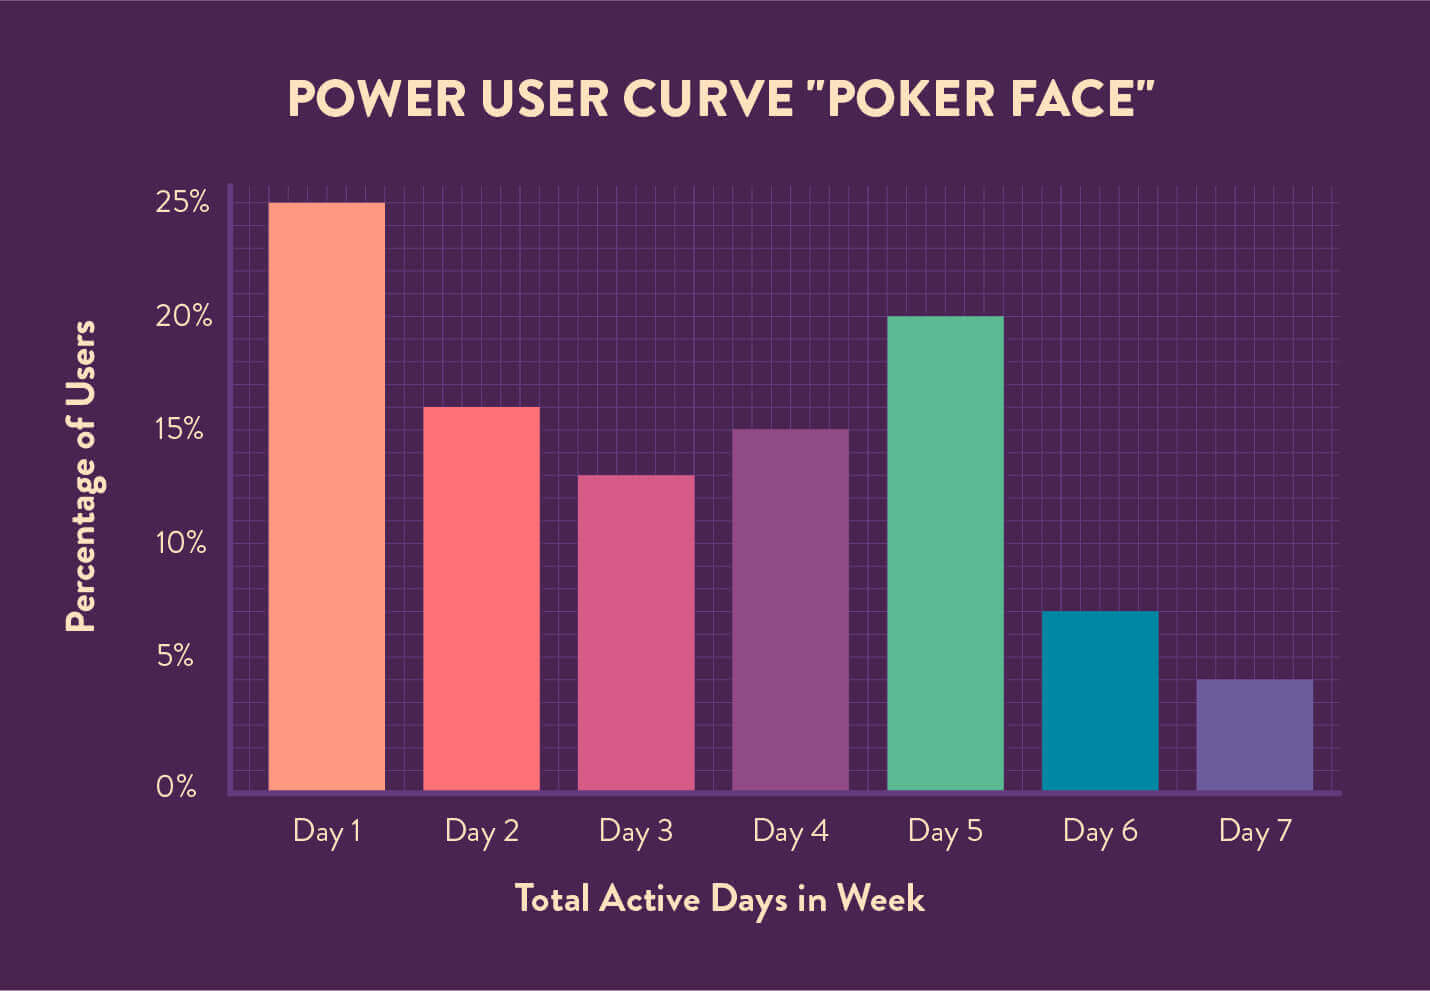
Power User Curve Poker Face
A “poker face” curve is the opposite of a healthy smile curve. It’s relatively flat, with most users falling somewhere in the middle of the engagement spectrum, logging in sporadically, but not often enough to indicate habit-forming behavior.
In some industries, like professional networking or enterprise SaaS, such a curve may still be expected. These businesses can still succeed by focusing on high-value monetization over high-frequency engagement.
Understanding the nature of your product’s engagement curve helps you make better monetization and activation decisions.
What it looks like:
- No spikes at either end. Light users aren’t curious enough to explore, and few users are engaging deeply.
- Uniform activity that reflects indifference rather than enthusiasm.
Why this is a red flag:
- Lack of differentiation: If no segment stands out as deeply engaged, your product may not be creating meaningful value.
- Onboarding or activation issues: Users may be getting stuck early or not discovering features that deliver the ‘aha’ moment.
- Product-market fit may be weak: Users aren’t compelled to return or invest effort in your product.
Power User Cohort Analysis
Cohort analysis allows you to track how different groups of users evolve into power users over time.
Start by slicing users into cohorts based on:
- Signup Date: Analyze if users acquired in January behave differently from those in March.
- Feature Exposure: Compare users who tried Feature A in the first 7 days versus those who didn’t.
- Acquisition Channel: Are users from paid campaigns progressing faster than organic signups?
- Geographic Region: For products with a large footprint (like Uber), compare DAUs to MAUs by city or country. It helps track where power user networks are expanding most rapidly.

Look at how retention, frequency, and feature usage trends shift across these cohorts. This helps identify:
- Which flows lead to more power users
- Where drop-offs occur before high-value behavior begins
Use these insights to optimize onboarding, reinforce high-value behaviors, and personalize communication based on cohort behavior.
L30 vs. L7: Choosing the Right Curve
- L30: The standard 30-day curve (popularized by Facebook) works well for B2C products with frequent engagement like gaming, streaming, or ecommerce.
- L7: For B2B products such as Slack or project management tools, where usage clusters Monday to Friday, the 7-day Power User Curve offers more meaningful insight.
Choose the one that aligns with your product’s natural engagement rhythm.
5 Tips to Target and Grow Your Power Users
Once you’ve identified your power users, the next step is to deepen their connection with your product and build a long-term value loop. These high-intent users want to be seen, heard, and rewarded, not with generic marketing, but with highly relevant, timely engagement. Here’s how to do it:
1. Personalize Every Touchpoint
Power users expect more than mass messages. Use behavioral data to tailor every interaction from onboarding nudges to loyalty rewards. Personalized push notifications, dynamic emails, and context-aware in-app prompts go a long way in keeping these users engaged. For example, a power user who has just completed their fifth purchase can be nudged toward a referral or upsell offer that builds on their usage history.
2. Offer Exclusive Access
Invite power users to beta-test new features or join insider feedback programs. Not only does this make them feel valued, but it also gives your team early feedback from your most invested users. Some brands even launch exclusive feature previews or roadmap webinars for their top-tier user cohort.
3. Actively Solicit Feedback and Show the Impact
Power users often have sharp insights into your product experience. Ask them for input through targeted surveys, NPS prompts, or community polls. Most importantly, close the loop, communicate what action was taken, and why their voice mattered. This fosters a deeper sense of ownership.
4. Create a Community Around Them
Facilitate interaction between your top users. Whether it’s a VIP Slack group, forum thread, or Discord channel, power users thrive in environments where they can connect with each other and with your brand. Elevate these users into ambassadors or “champions” who can also support newcomers.
5. Reward Consistency and Advocacy
Don’t underestimate the power of thoughtful rewards. Recognize loyalty with milestone badges, special perks, early access to features, or surprise gifts. Small gestures like a handwritten note, branded merchandise, or a discount code can turn engagement into advocacy and drive strong word-of-mouth. Use CleverTap’s segmentation engine and journey orchestration tool to automate these high-touch moments based on actual behavior, not assumptions.
Power Up Your Power User Strategy With CleverTap
CleverTap equips you with the tools to go beyond just identifying power users, it helps you decode their behavior, engage them intelligently, and expand this high-value segment across your user base.
Start by identifying high-value users through advanced segmentation techniques such as RFM analysis and behavioral cohorts. With TesseractDB™, CleverTap’s proprietary data platform, you gain access to 10 years of long-term behavioral data and the ability to process up to 10,000 data points per user each month. This helps teams uncover sustained engagement patterns that are often invisible in short-term windows.
Once identified, CleverTap allows you to personalize engagement across the entire user lifecycle. Lifecycle Optimizer helps automate contextual nudges based on behavior, campaign response, or funnel drop-offs. You can also micro-target users with Intent-Based Segmentation and craft emotionally resonant communication using Scribe, the AI-powered copy assistant that’s part of CleverTap’s Clever.AI suite. This suite also includes IntelliNODE, which prescribes optimal user journeys, and Journey Optimizer for dynamic orchestration at scale.
What sets CleverTap apart is its ability to reach users across more than 15 integrated channels, including Push Notifications (powered by RenderMax™), Email, WhatsApp, Web Messaging, and in-app notifications.
All of this is powered by real-time intelligence from the Real Impact Dashboard, which ties engagement initiatives directly to metrics like CLTV, churn, and retention. You can visualize user progression with Funnels and track trends using cohort analysis.
Whether you’re aiming to increase revenue, reduce churn, or scale advocacy, CleverTap gives you the infrastructure to build and grow a power user strategy that’s sustainable and measurable.
The Future of Power Users in the AI Era
As personalization evolves from rules-based campaigns to AI-driven engagement, power users will benefit from richer, real-time experiences. Platforms like CleverTap now utilize tools under the Clever.AI umbrella, such as Scribe for generating emotionally resonant messaging based on behavioral context, IntelliNODE for predictive journeys, and Journey Optimizer for orchestrating engagement dynamically.
Smart nudges, predictive journeys, and intent-based offers will help brands deliver precise value when it matters most and scale that advantage across millions.
Build and grow your power user base with CleverTap’s AI-driven engagement.
Conclusion
Power users are the ones who shape your product’s future. From deeper feature adoption to sustained retention and organic referrals, this segment drives measurable impact across every growth metric.
The key is not just identifying power users, but actively nurturing them with timely, relevant engagement. Whether you’re building habit loops, accelerating feature discovery, or scaling advocacy, power users offer a strategic edge that compounds over time.
CleverTap helps you unlock this advantage. With real-time analytics, advanced segmentation, and automated engagement across channels, you can build journeys that activate, retain, and grow your most valuable users.
Want to turn more users into power users? Book a demo and see how CleverTap can help.
Agnishwar Banerjee 
Leads content and digital marketing.Expert in SaaS sales, marketing and GTM strategies.
Free Customer Engagement Guides
Join our newsletter for actionable tips and proven strategies to grow your business and engage your customers.
