


Table of Contents
Categories
Most Popular


Want to understand your customers better? Learn how RFM analysis can help you segment your audience by value, uncover key insights, and refine your marketing efforts. We break down what it is, how to calculate RFM scores, and how to apply it to maximize engagement and retention.
What is RFM Analysis and How Does It Work?
RFM analysis, which stands for Recency, Frequency, and Monetary value, is a technique that helps marketers identify their most valuable customers. By studying the behavior of your customer base, this analysis allows you to tailor personalized marketing strategies that boost customer loyalty and lifetime value.
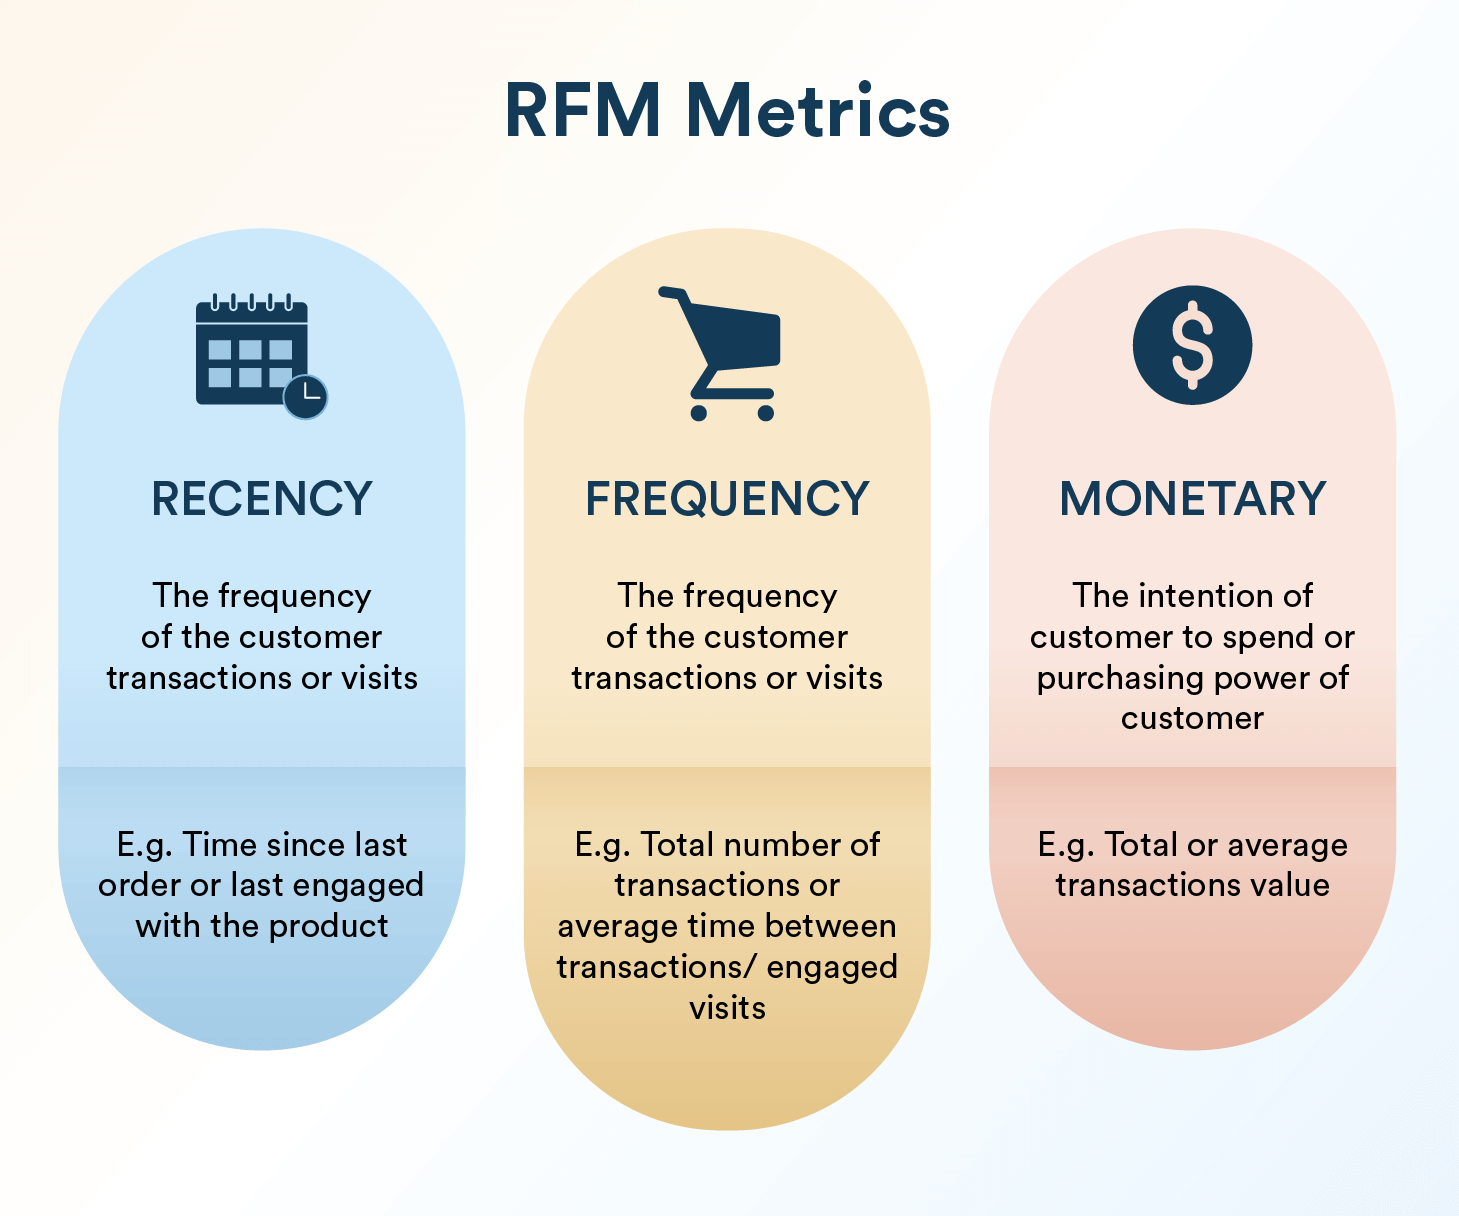
RFM analysis helps you identify which customers to invest in, which to nurture, and which are less critical to business results. Each of its components reflects a key aspect of customer behavior:
- Recency: How recently a customer has made a purchase.
- Indicates engagement and potential interest. Customers who have purchased recently are more likely to respond to marketing efforts and promotions.
- Frequency: How often a customer makes a purchase.
- Measures loyalty and ongoing engagement. Frequent buyers have greater attachment to the business and can be targeted with loyalty programs or special offers.
- Monetary Value: How much a customer spends.
- Reflects customer value and profitability. High spenders are valuable for driving revenue and can be rewarded with exclusive perks.
Unlike demographic segmentation or psychographic segmentation, RFM analysis categorizes customers by purchase behavior, focusing on how they shop rather than who they are. This makes it a more actionable approach for sales-driven strategies.
It additionally has benefits over cohort analysis as a tool for high-frequency purchase models by segmenting users based on multiple factors instead of single inputs. It is especially beneficial in marketplace or e-commerce settings where users make varying numbers of purchases and transaction sizes.
An RFM analysis enables marketers to create targeted strategies that drive both retention and growth. RFM factors illustrate these key insights:
- the more recent the purchase, the more responsive the customer is to promotions
- the more frequently the customer buys, the more engaged and satisfied they are
- monetary value differentiates heavy spenders from low-value purchasers
For businesses focused on activity metrics like engagement, site visits, or browsing behavior (instead of frequent purchases), the Monetary value component is replaced with an Engagement factor, creating an RFE model. Engagement can be measured by metrics such as bounce rate, visit duration, pages viewed, or product actions.
The flexibility of RFM/E analysis allows businesses to apply it in various ways:
- E-commerce: RFM in e-commerce helps identify valuable customers based on recent and frequent purchases, segmenting them for targeted promotions to drive repeat purchases and boost sales through personalized offers.
- Retail Subscription Services: RFM uses renewal dates instead of purchase recency. Analyzing metrics like active subscriptions, skipped months, and upgrades informs retention strategies like win-back offers and loyalty rewards.
- Fintech: In fintech, RFM helps evaluate customer activity through transaction recency, product usage frequency, and account value. It helps identify engaged users, detect inactivity risks, and uncover opportunities to promote relevant financial products, improving retention and customer lifetime value.
- Media and Content Platforms: For streaming services, RFM adapts to content engagement, focusing on viewing frequency, content type, and recent activity. This drives personalized recommendations, targeted marketing, and improved satisfaction.
- Gaming: In gaming, RFM helps identify players based on how recently they played, how frequently they return, and how much they spend on in-game purchases. These insights can be used to recognize highly engaged players, identify users at risk of churning, and deliver targeted rewards, events, or promotions that encourage continued gameplay and increase player retention.
- Hospitality and Travel: For hotels and travel agencies, RFM analyzes recency (last stay), frequency (repeat stays), and monetary value (spending), helping identify loyal customers for special offers and boosting repeat bookings.
Each model customizes RFM analysis based on what matters most to the customer relationship, whether purchasing behavior, engagement, or service usage, helping businesses achieve goals like increasing sales, reducing churn, enhancing loyalty, and optimizing personalized marketing.
Why RFM Analysis Matters for Marketers
RFM analysis plays a crucial role in marketing because it offers a focused approach to understanding where your revenue truly comes from. To distinguish repeat customers from new ones, marketers can design campaigns that enhance customer satisfaction and increase repeat purchases. This segmentation allows businesses to:
- Identify and nurture high-value customers.
- Pinpoint at-risk segments needing re-engagement strategies.
- Discover upsell and cross-sell opportunities based on customer behavior.
RFM analysis is a powerful tool for gaining insights into your customer base. It helps answer critical questions such as:
- Who are your best customers?
- Which customers are at risk of churning?
- Who has the potential to become more valuable?
- Which customers can be effectively retained?
- Who is most likely to respond to engagement campaigns?
It’s crucial to identify and optimize user groups based on behavioral segmentation in order to improve campaign performance. RFM analysis provides a roadmap for personalized marketing. It ensures that the right message reaches the right customer at the right time.
How to Calculate RFM Scores and Conduct an RFM Analysis
Let’s explore how RFM segmentation works using a sample dataset of customer transactions:
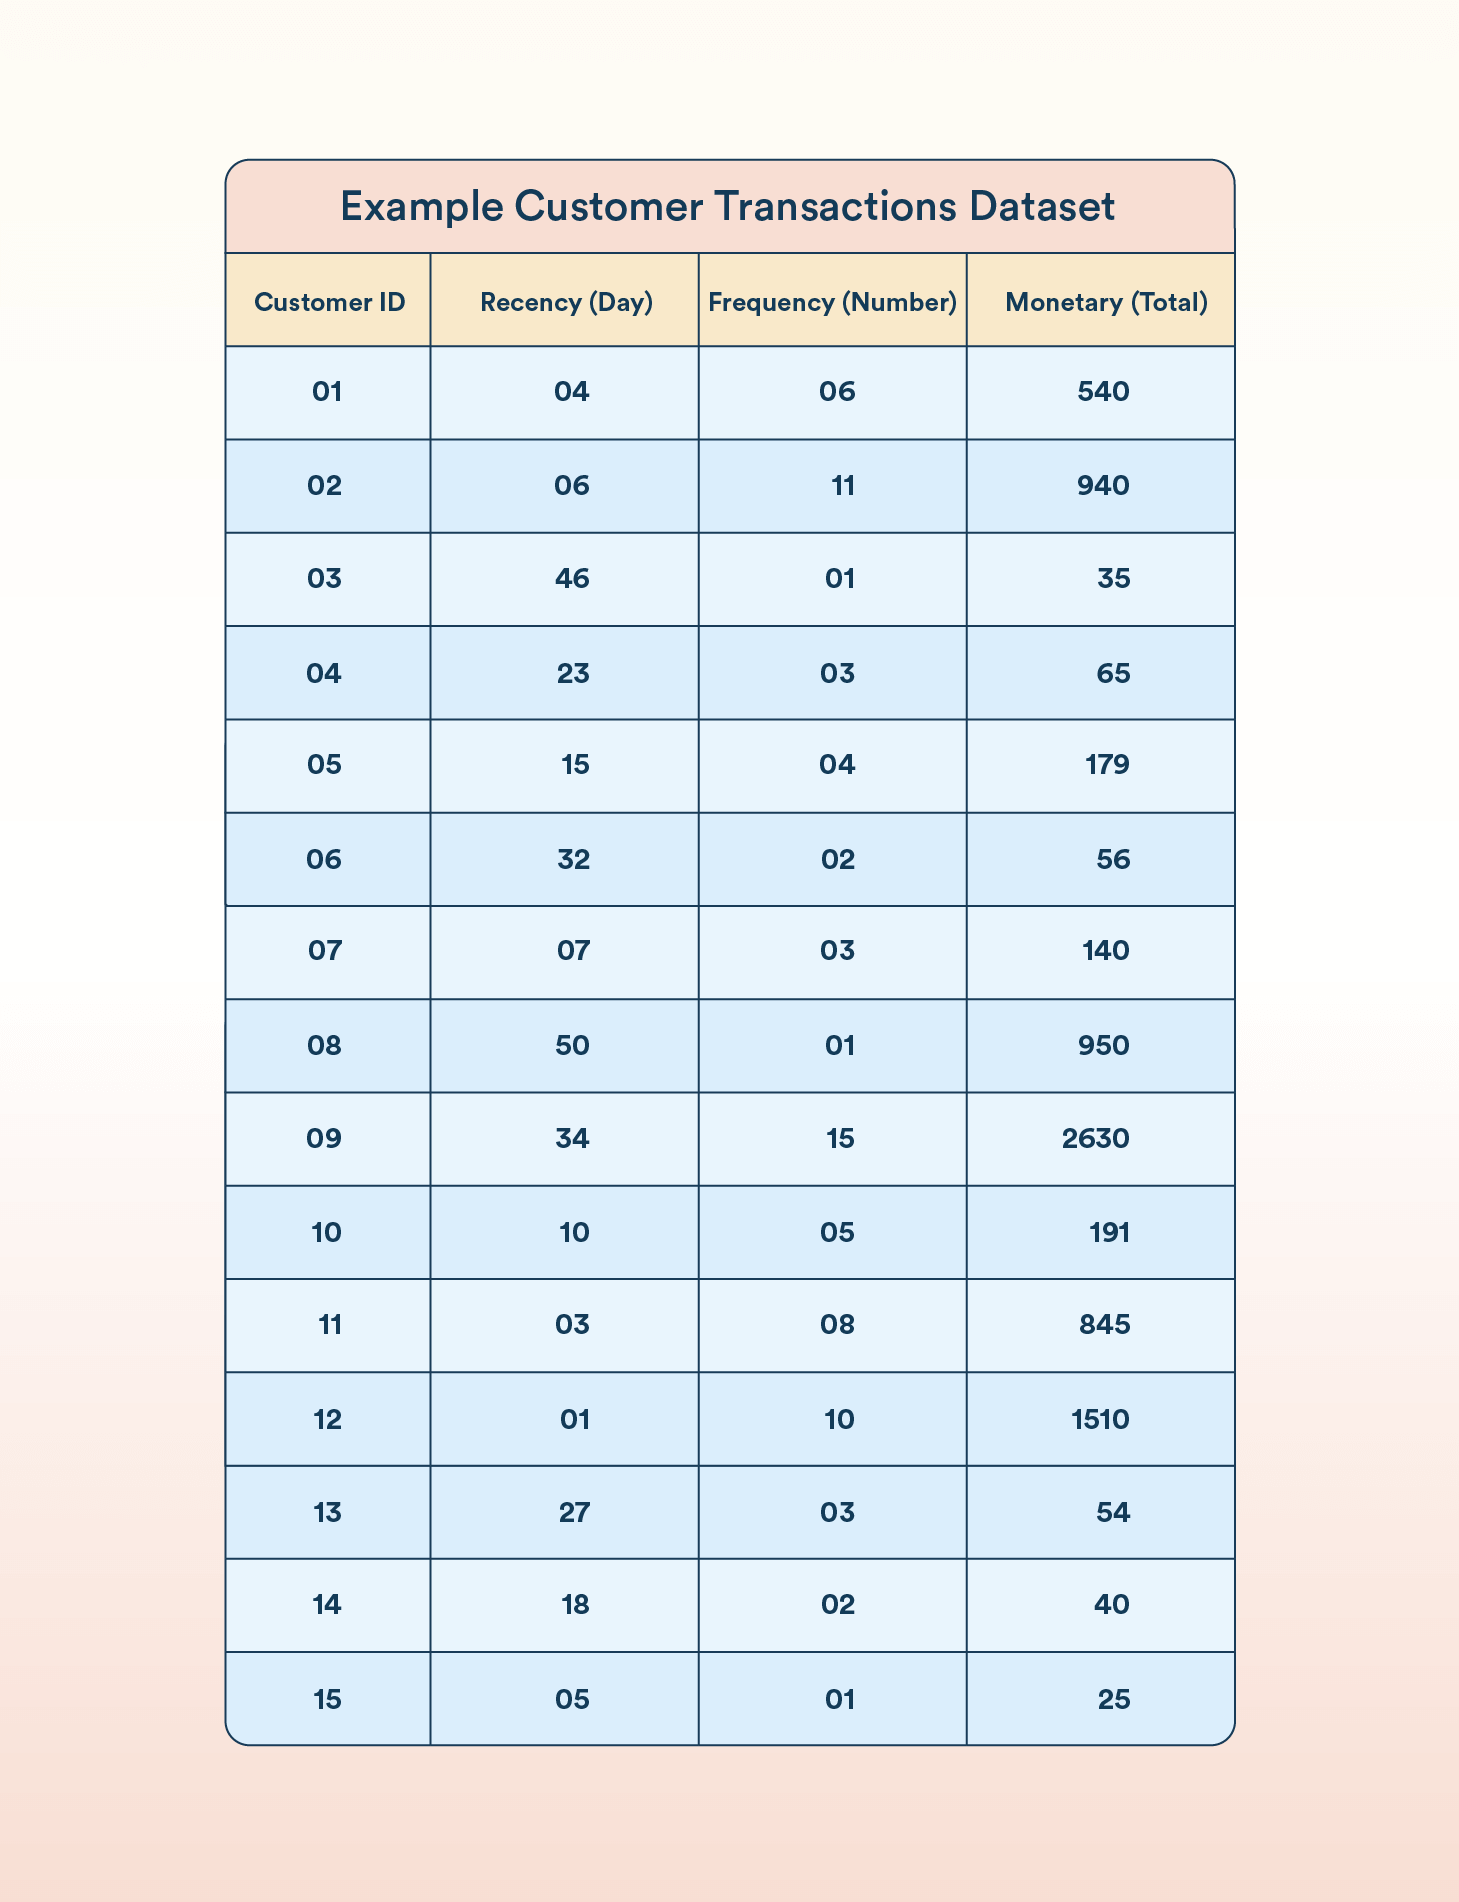
To conduct this analysis, customers are scored based on each attribute—Recency, Frequency, and Monetary value—separately. These scores are then combined to provide an overall RFM score. Hence, it helps in segmenting customers and making informed marketing decisions.
Step 1: Ranking Customers by Recency
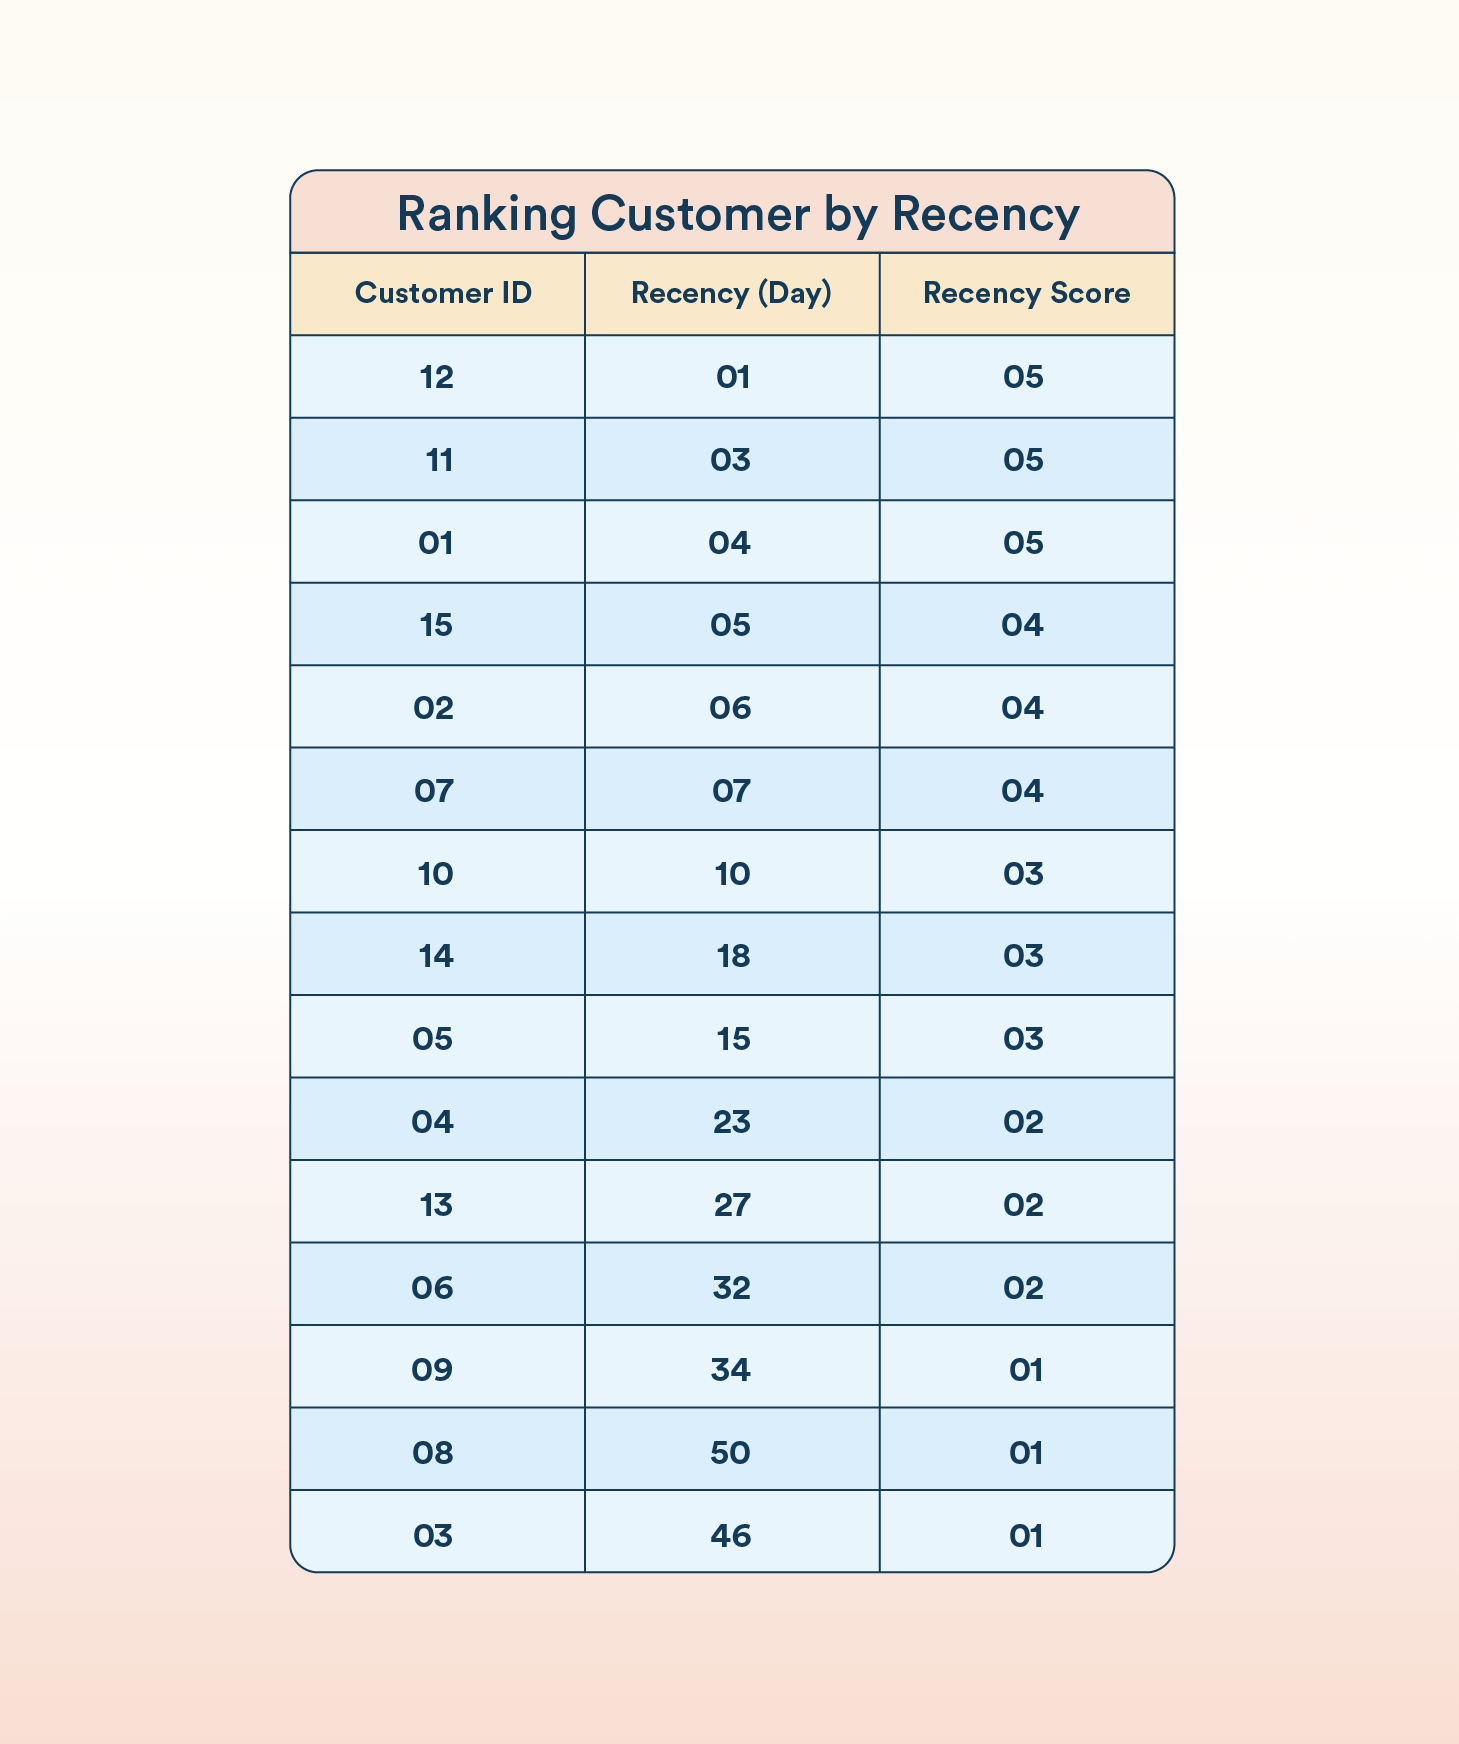
The first step in RFM analysis is to rank customers based on recency. So, measure how recently a customer made a purchase. Customers who have purchased most recently are given the highest scores. For this example, customers are scored from 1 to 5, with the top 20% receiving a score of 5, the next 20% a score of 4, and so on.
Step 2: Ranking Customers by Frequency and Monetary Value
Next, customers are ranked by frequency. Measure how often a customer makes a purchase. The more frequent the purchases, the higher the score. As before, the top 20% are assigned a frequency score of 5, and the lowest 20% a score of 1.
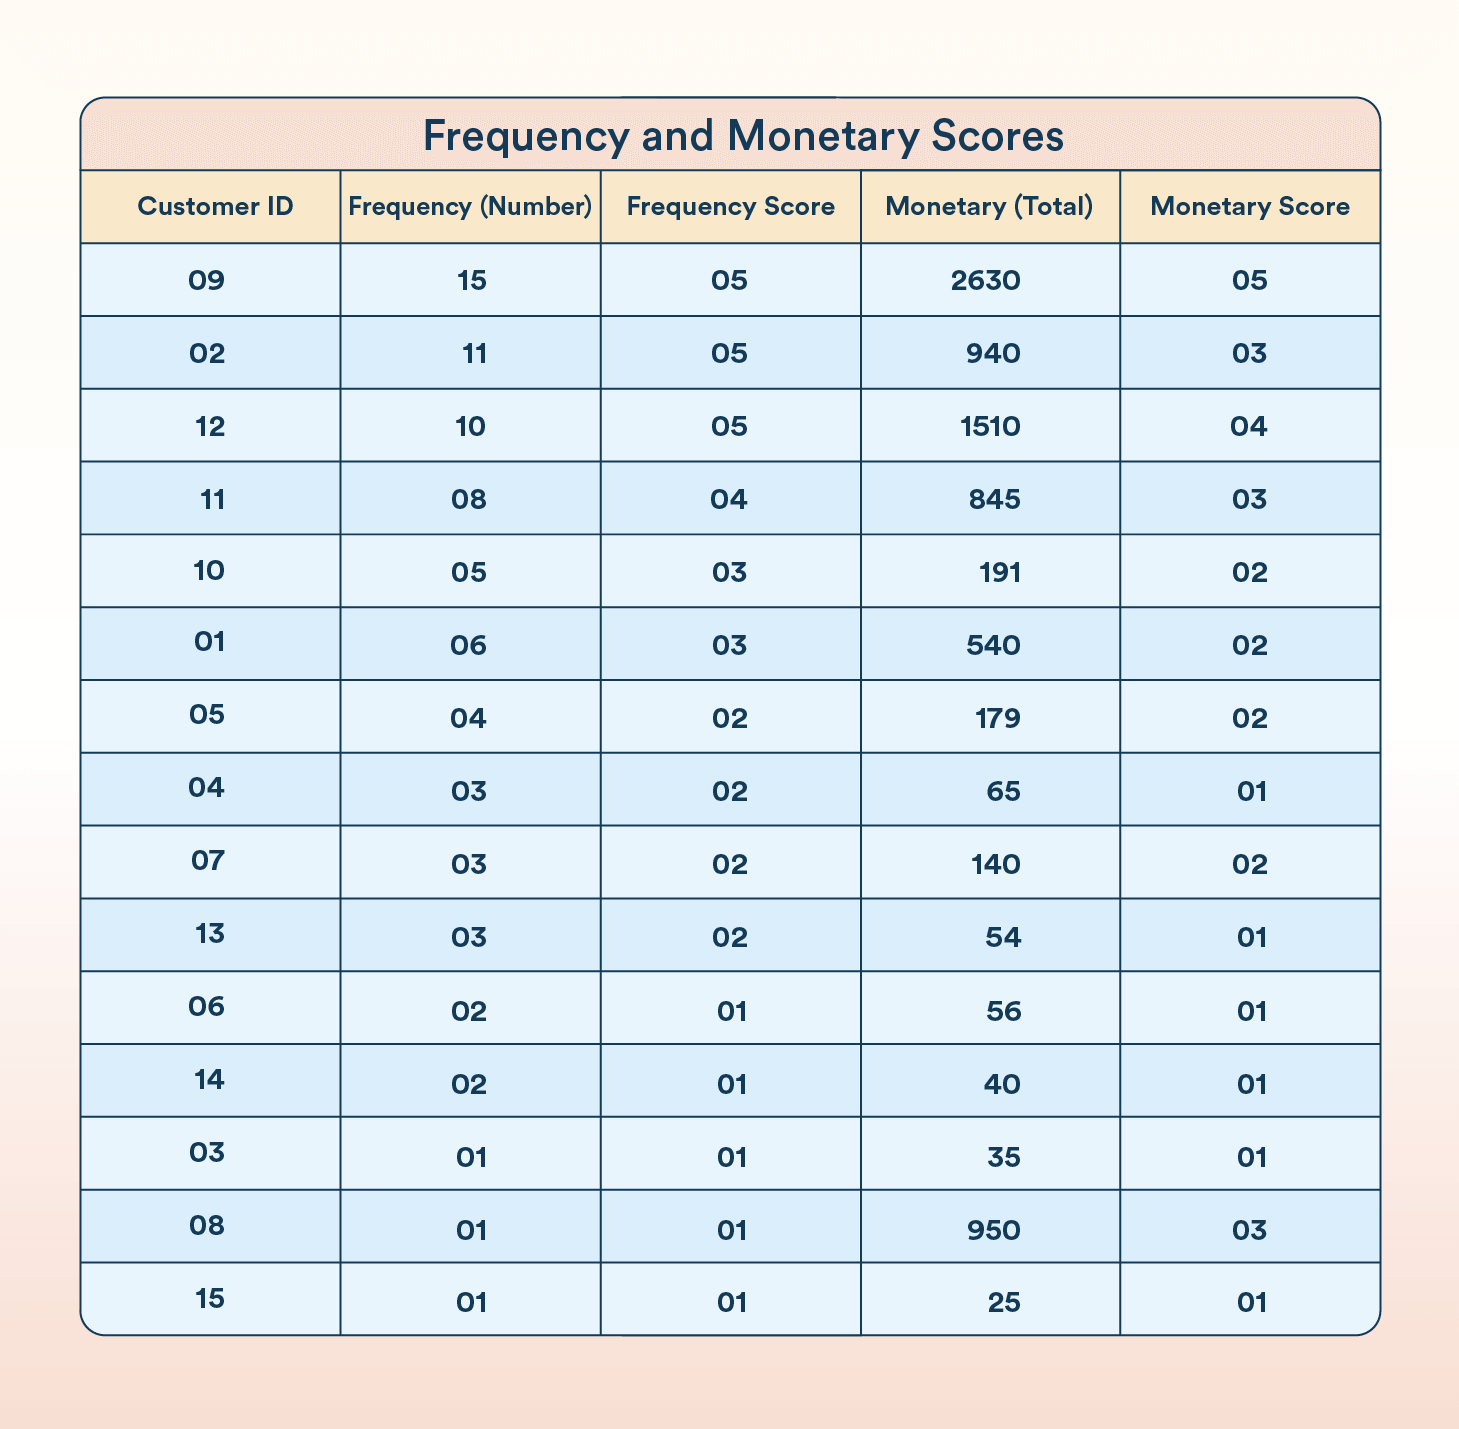
Similarly, rank customers by their monetary value. This will reflect the total amount spent by the customer. The highest spenders receive a score of 5, and the lowest spenders receive a score of 1.
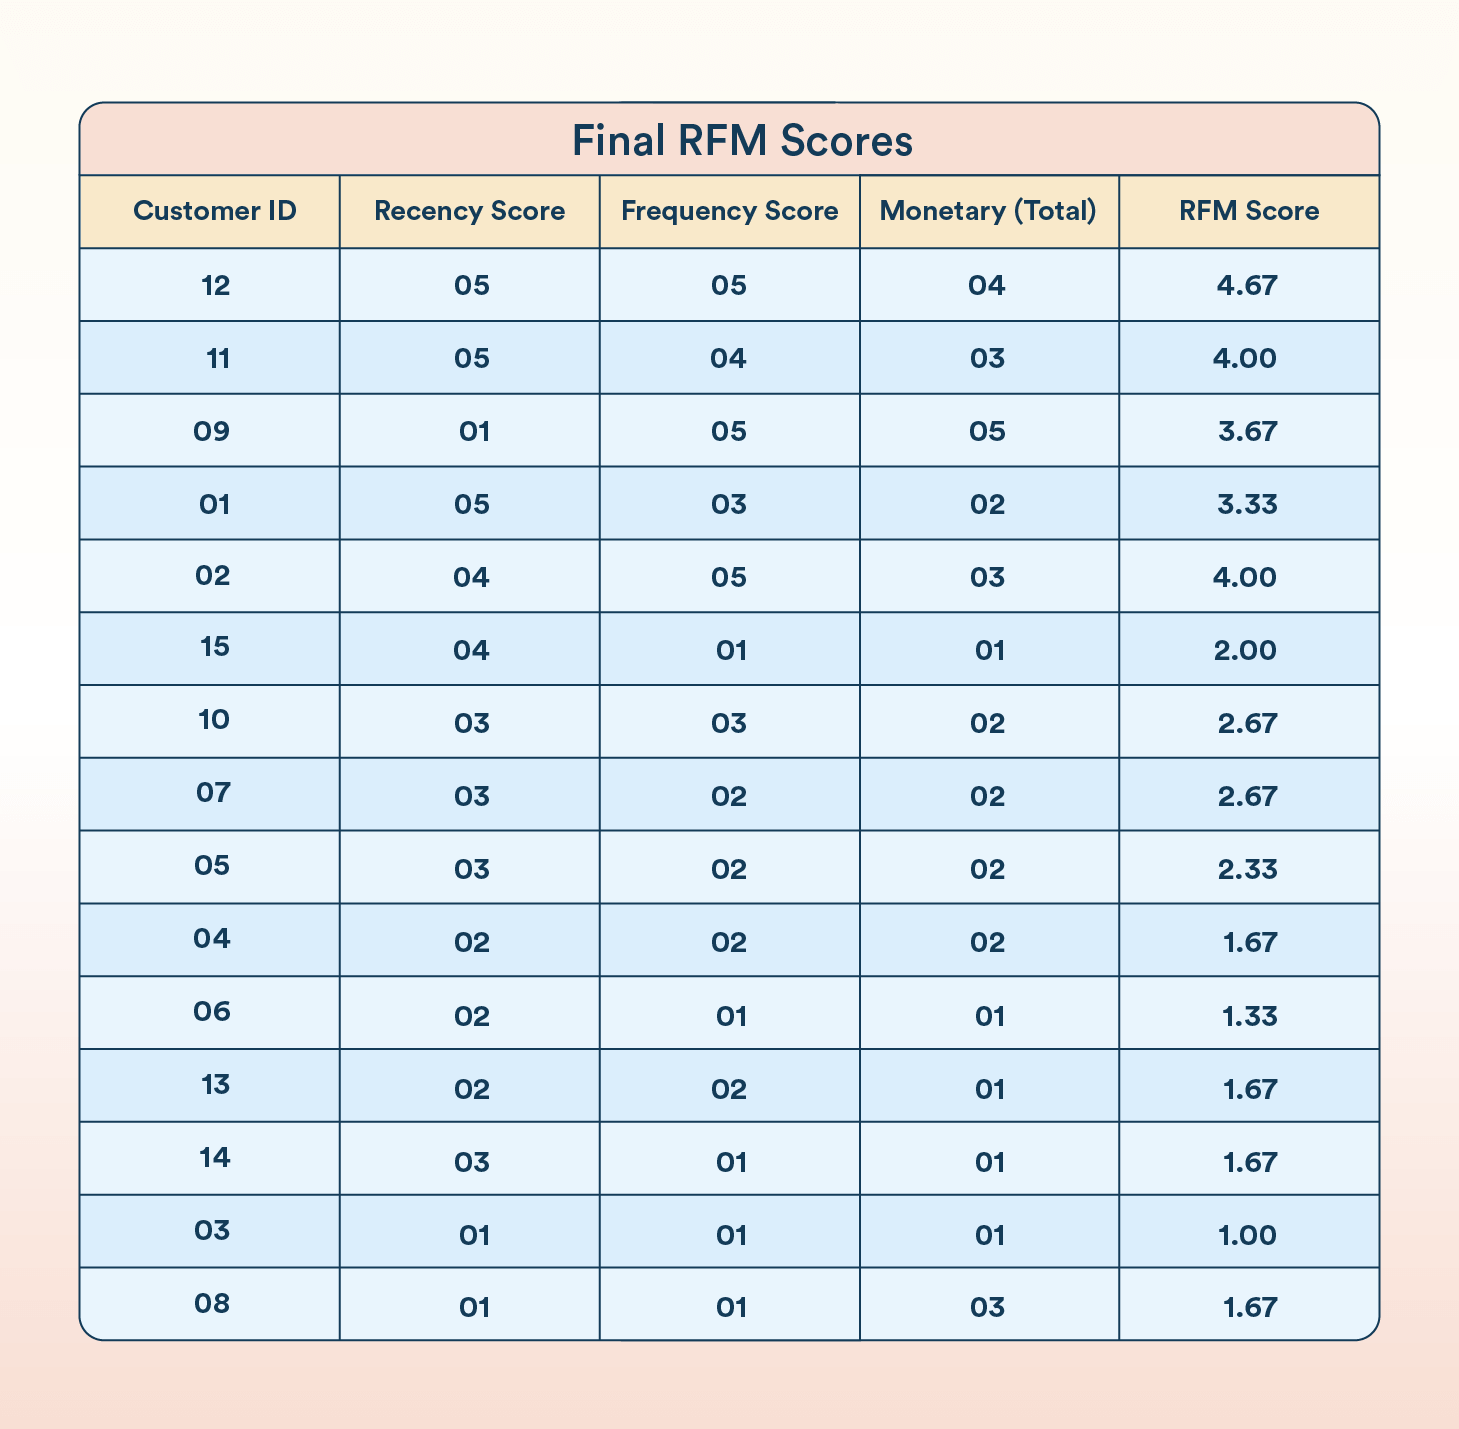
Step 3: Calculating the RFM Score
In this step, create an average of the Recency, Frequency, and Monetary scores to generate an overall RFM score. This score provides a comprehensive view of customer behavior, helping businesses identify valuable customers and those needing more attention, guiding marketing strategies and customer engagement efforts.
Step-by-Step RFM Scoring Example
Let’s say an online retailer is evaluating a customer who made their last purchase 10 days ago, placed 8 orders over the past year, and spent a total of $1,200 during that period.
Based on the scoring model above, the customer falls into the highest Recency bracket and receives a score of 5. Their purchase frequency also places them among the most active customers, earning a Frequency score of 5. With total spending that ranks among the highest customer groups, they receive a Monetary score of 5.
This gives the customer a final RFM score of 555.
A customer with a score of 555 would typically fall into a Champion segment because they purchase recently, buy frequently, and contribute significant revenue. Rather than focusing on discounts, marketers can use this insight to provide exclusive rewards, early access to new products, loyalty benefits, or referral incentives that strengthen long-term engagement.
Now consider a customer who purchased 8 months ago, placed only 2 orders, and spent $75 in total. This customer may receive a score closer to 122 or 133, placing them in an At Risk or Hibernating segment. In this case, a win-back campaign, personalized offer, or product recommendation would be more appropriate than a loyalty reward.
This example demonstrates how RFM scores help translate raw transaction data into clear customer segments that can be acted upon through targeted marketing strategies.
Customize Your RFM Model
Depending on your business model, you may want to adjust the weight of each RFM component to better align with your business goals. For example:
- High Transaction Value, Low Frequency (e.g., Consumer Durables): Emphasize Recency and Monetary value over Frequency.
- Retail and E-commerce: Prioritize Recency and Frequency, as customers make frequent purchases.
- Non-Retail and E-commerce businesses: Input key product metrics to derive an output. For content platforms like Netflix or Hotstar, binge-watchers prioritize engagement and frequency, while mainstream consumers focus more on recency and frequency.
Optimizing RFM Scoring for Greater Accuracy
While many businesses begin with equal weighting across Recency, Frequency, and Monetary value, this approach may not always reflect what drives customer value in a particular industry.
For example, in retail and e-commerce, Recency and Frequency often carry greater importance because repeat purchases are a strong indicator of future revenue. Customers who buy regularly and remain active are typically more responsive to marketing campaigns.
In fintech, Recency may play a larger role when evaluating active users of financial products. A customer who recently completed transactions, used a payment feature, or interacted with the platform may be more valuable than a customer with historically high activity who has become inactive.
Gaming companies often place greater emphasis on Frequency because regular play sessions are closely tied to retention. Players who return consistently are generally more likely to remain engaged and participate in future events, promotions, and in-game purchases.
For media and content platforms, engagement and viewing frequency may provide stronger signals than monetary value. A highly engaged user who returns frequently may be more valuable from a retention perspective than a user who visits only occasionally.
Subscription businesses may prioritize Recency and Frequency around renewals, feature usage, or service activity. Monitoring these behaviors helps identify customers who are healthy, at risk, or likely to churn.
The most effective RFM models reflect the behaviors that contribute most directly to business success. As customer behavior patterns become clearer, businesses can adjust the weighting of each factor to create more meaningful segments and improve targeting accuracy.
RFM Segmentation Simplified
RFM segmentation (Recency, Frequency, Monetary) is a data-driven method used to classify customers based on their purchasing behavior, helping businesses target different customer groups more effectively.
Customers are scored from 1 to 5 across each attribute: Recency, Frequency, and Monetary, resulting in up to 125 unique RFM scores (5x5x5), ranging from 111 (lowest) to 555 (highest). Each of these RFM cells reflects different customer behaviors. However, analyzing all 125 segments can be overwhelming.
To simplify, these 125 segments are often reduced to 25 by focusing on Recency and Frequency scores, with the Monetary value used as a summary of transactions or visit length, streamlining the analysis.
Learn how to conduct segmentation analysis from our detailed guide.
How to Use RFM Analysis for Customer Segmentation
Implementing RFM analysis is a systematic process that involves several key steps:
Step 1: Collect Data
Gather customer transactional data. This would include key details such as purchase dates, frequency of purchases, and total spending by customers.
Step 2: Set RFM Metrics
Define your criteria for Recency (what time frame to consider), Frequency (the period over which you measure the number of purchases), and Monetary value (define the total spending period), based on your business model and industry standards.
Step 3: Score Customers
Assign scores to customers based on your defined RFM metrics. This is typically done on a scale of 1 to 5, with 5 being the highest and 1 being the lowest.
Step 4: Segment Customers
Assess the importance of each RFM variable depending on the nature of your business. Then, segment your customers into groups based on their RFM scores.
Step 5: Craft Marketing Strategies
Develop personalized marketing strategies for each defined segment. Tailor your approach to the specific needs and behaviors of each group.
Here are some key segments and how you can tailor your marketing strategies to engage each one effectively:
- Champions: Your top customers who buy frequently, recently, and spend a lot. Reward them with exclusive offers, early access, and personalized communication to keep them engaged and promote your brand.
- Potential Loyalists: Recent buyers with good spending but average frequency. Encourage loyalty with memberships, upsell recommendations, or related products to move them toward becoming Loyalists or Champions.
- New Customers: High RFM scorers but infrequent buyers. Build relationships with onboarding support and special offers to increase visits and engagement.
- At Risk Customers: Previously frequent, high-spending customers who haven’t bought recently. Reactivate them with personalized campaigns and offers to renew their interest.
- Can’t Lose Them: Former regulars who have disengaged. Re-engage them with targeted promotions and surveys to identify issues before they turn to competitors.
Discover why CleverTap is a Leader in the 2026 Gartner® Magic Quadrant™ for Personalization Engines. Get the full report.
What Kind of Results Can RFM Segmentation Drive?
If you’re evaluating the impact of RFM-based targeting, here are some performance benchmarks to help set expectations and guide strategy:
- Click-through rates improve significantly with RFM-driven targeting: Campaigns built around behavioral segments tend to outperform generic outreach. In one analysis, segmented emails achieved 50% higher CTR compared to broad, non-targeted campaigns.
Source: FasterCapital - Retention rates rise when at-risk customers are proactively re-engaged: Applying RFM analysis to identify and target disengaging users has led to significant lifts in customer retention rates by 10-20%.
Source: TryPropel.ai - Targeted campaigns yield higher ROI: Behavior-based segmentation drives efficiency. Research reported campaigns using customer segmentation, like RFM, targeting yielded up to a 77% boost in ROI compared to one-size-fits-all approaches.
Source: ResearchGate
Looking for sharper insights into your customers? Explore the 10 best customer segmentation platforms today.
Challenges You May Face With RFM Analysis & How to Tackle Them
Despite its strengths, RFM in marketing has some limitations:
- Excessive Focus on Monetary Value: An overemphasis on how much customers spend can make you miss out on the value of loyal customers. Some of these users might not be spending as much, but contribute significantly through their frequent engagement.
- Outdated Data: RFM scores reflect customer behavior at a single point in time. Hence, regular updates and incorporating feedback are essential. Making decisions based on old data may lead to suboptimal marketing strategies.
How to Tackle These Issues
To address these problems, integrate RFM analysis with real-time data and additional behavioral metrics. This combined approach ensures a fuller picture of your customers. Keeping your RFM scores fresh and listening to customer feedback will help you stay on top of their changing needs.
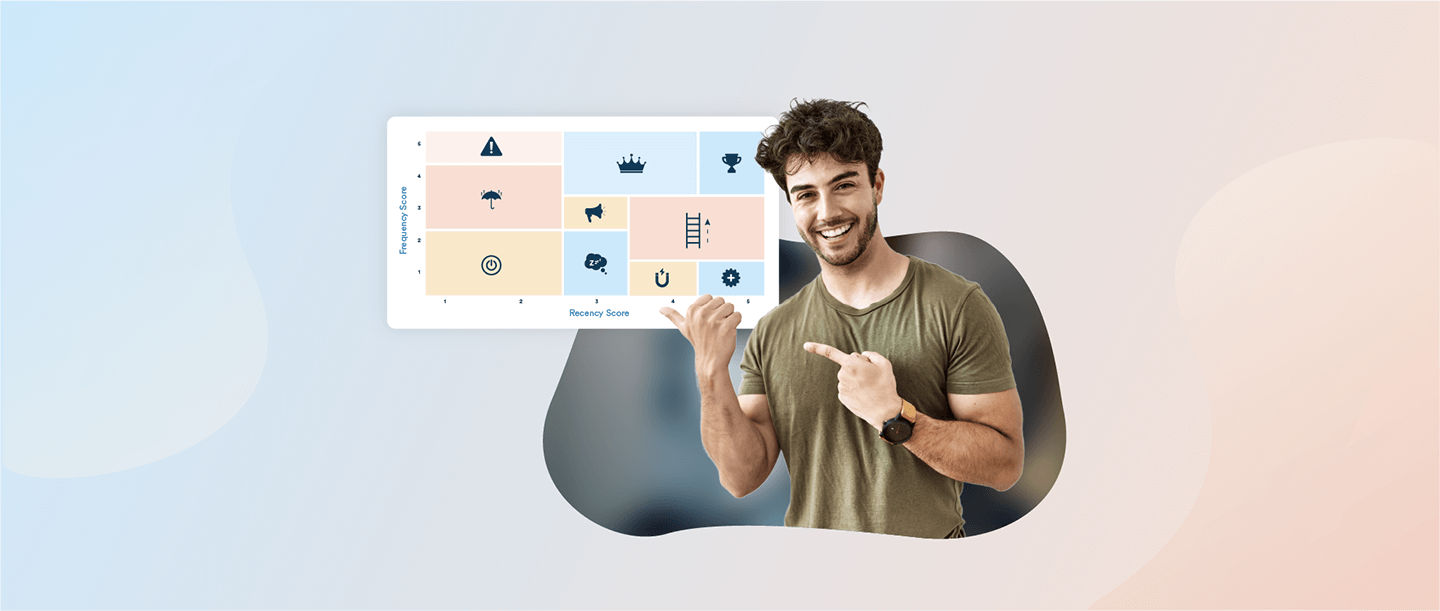
At CleverTap, we streamline the analysis by using Recency and Frequency scores to create a 2-dimensional graph. RFM analysis is native to our product and can be easily accessed and reviewed by lifecycle marketers to enable them to do their best work.
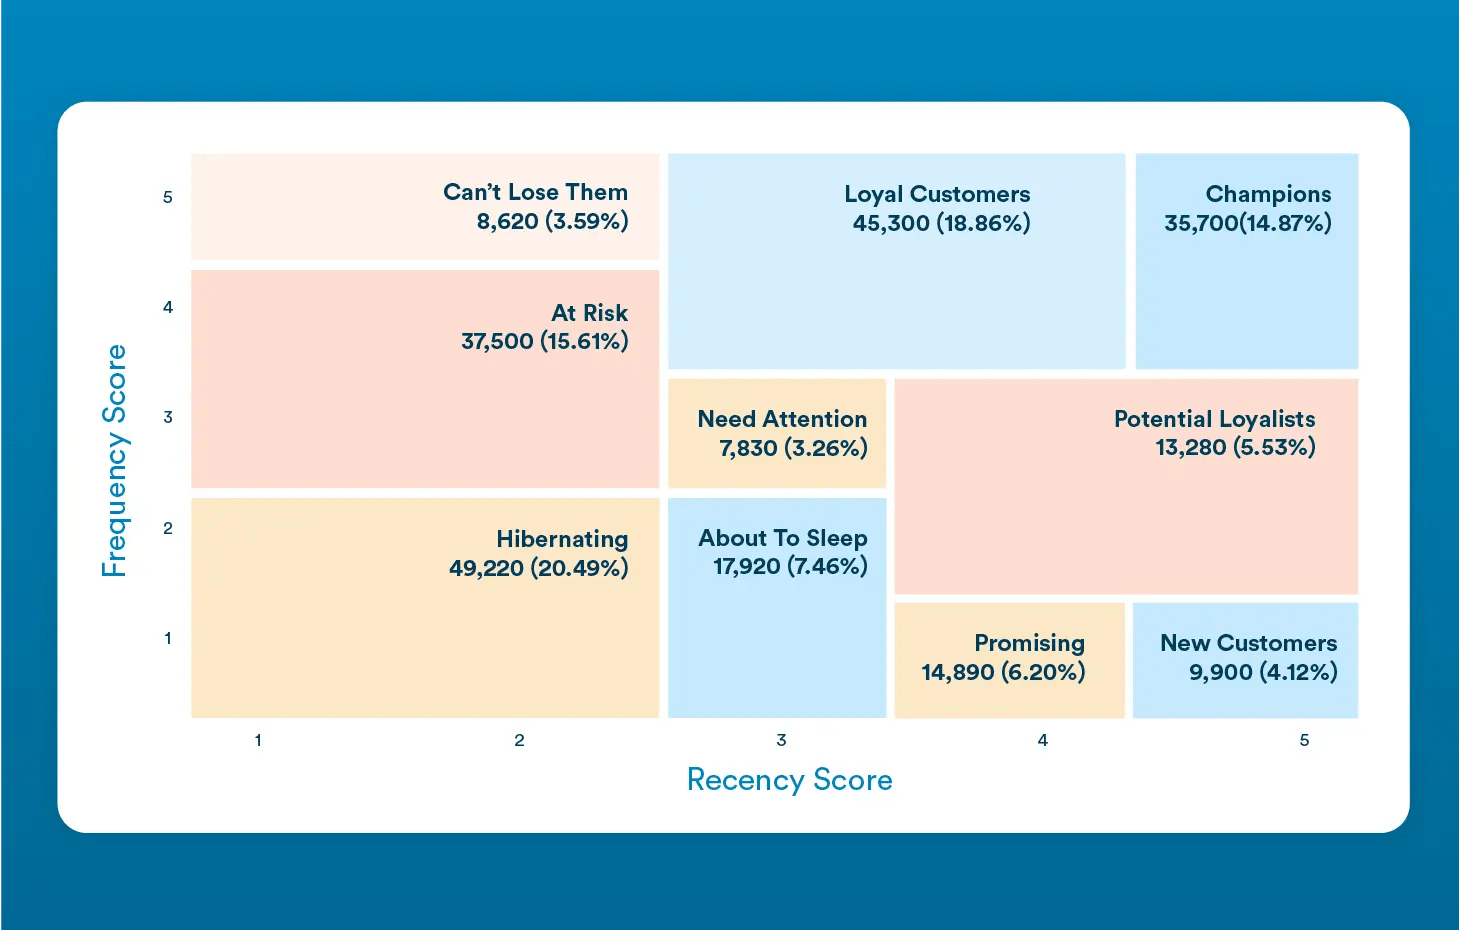
This visualization makes it easier for marketers to interpret the scores and take action, plus to see the size of the respective pool. We’ve refined the process by combining some segments into more manageable and intuitive groups. As illustrated in the RFM grid above, each segment of an RFM tree graph provides valuable information, including:
- A brief description of the segment
- Recency (last activity)
- Frequency (activity count)
- Average monetary value
- Reachability across different marketing channels
CleverTap’s RFM analysis feature is designed to help businesses quickly identify key customer segments: their size, where users sit across the different segments, and how their behavior changes over time.
Go beyond basic segmentation. Explore how RFM drives retention with CleverTap.
How CleverTap Simplifies RFM Analysis With Its Advanced Tool
The Recency Frequency Monetary Analysis feature by CleverTap provides two tools:
- RFM Grid: A visualization that showcases multiple elements, including the number of users in each RFM segment, their reachability on different marketing channels, and their average monetary value.
- RFM Transition: A visualization that highlights the flow of users from one RFM segment to another, helping you understand changes in customer behavior over time.
This approach ensures that you not only identify where your customers currently stand but also anticipate where they might be headed, allowing you to stay one step ahead in your marketing efforts.
Beyond RFM analysis, CleverTap offers a comprehensive suite of features to enhance customer engagement and retention:
- Advanced Segmentation: Create highly targeted segments based on user behavior and demographics.
- Personalized Campaigns: Deliver real-time, tailored messages across multiple channels like push notifications, in-app messages, and emails.
- Behavioral Analytics: Gain deep insights into customer journeys and behaviors, helping you optimize marketing strategies.
- Automation: Set up automated workflows to trigger personalized messaging based on user actions.
- Retention Tools: Identify at-risk users and engage them with personalized win-back campaigns.
CleverTap helps you create smarter marketing strategies, drive customer loyalty, and increase revenue.
Want to see how RFM analysis can work for your business? Schedule a demo with one of our growth specialists today. Discover how our powerful tools can drive growth and improve retention for your business.
Using RFM Segmentation to Power Automated Campaigns
Once you’ve segmented customers using RFM, the next step is to turn those insights into action. One of the most effective ways to do that is by automating personalized campaigns that respond to a customer’s real-time behavior and segment membership.
Here’s how automation can work with RFM in practice:
1. Re-engage At-Risk or Hibernating Users
Trigger automated win-back emails, push notifications, or WhatsApp messages when a customer enters an “At Risk” segment. Use offers, reminders, or helpful content to bring them back.
2. Reward Your Champions
Automatically enroll “Champion” users in loyalty programs or exclusive early-access campaigns. Since these customers are highly engaged and high-value, personalized rewards can help maintain their momentum.
3. Onboard and Nurture New Customers
When a customer appears in the “New Customers” or “Promising” segments, initiate an onboarding series that highlights product benefits, key features, or encourages that second purchase.
4. Suppress Communication to Lost Segments
Use segment filters to reduce spend on low-return users in “Lost” or “Hibernating” segments. Instead, focus automation budgets on users most likely to convert again.
5. Dynamic Segment Monitoring
With platforms like CleverTap, segments update in real time as customer behavior evolves. This ensures your automated campaigns stay relevant and timely, without manual rework. Whether you’re running reactivation journeys, loyalty rewards, or onboarding flows, CleverTap ensures your RFM-driven strategies are always a step ahead.
How to Measure the Success of Your RFM Strategy
Once RFM segmentation is in place, it is important to track performance over time. Monitoring the right metrics helps determine whether your segmentation strategy is improving customer engagement, retention, and revenue.
Retention Rate
Retention rate measures the percentage of customers who continue engaging with your business over a specific period. Improvements in retention often indicate that your segmentation and targeting efforts are successfully keeping customers active.
If retention rates increase among segments such as At Risk or Potential Loyalists, it suggests that your campaigns are encouraging customers to remain engaged longer.
Repeat Purchase Rate
Repeat purchase rate measures how many customers return to make additional purchases after their first transaction.
This metric is particularly useful for evaluating onboarding campaigns, loyalty initiatives, and cross-sell efforts. An increase in repeat purchases often signals that customers are moving toward more valuable RFM segments over time.
Reactivation Rate
Reactivation rate tracks how many inactive customers return after receiving a win-back campaign or retention-focused message.
Monitoring this metric helps marketers understand whether their efforts to re-engage Hibernating, At Risk, or Can’t Lose Them segments are generating results. A rising reactivation rate generally indicates that retention campaigns are effectively bringing customers back.
Revenue per Customer
Revenue per customer measures the average value generated by each customer over a given period.
Tracking this metric across different RFM segments helps identify whether customers are increasing their spending and progressing toward higher-value groups. Growth in revenue per customer often reflects successful upsell, cross-sell, and loyalty strategies.
Segment Movement Over Time
One of the most valuable indicators of RFM success is how customers move between segments.
Ideally, customers should progress from New Customers to Potential Loyalists, Loyal Customers, and eventually Champions. At the same time, marketers should work to reduce movement into At Risk, Hibernating, or Lost segments.
Monitoring segment transitions provides a clear view of whether your customer engagement strategy is strengthening relationships and increasing long-term customer value.
Turning RFM Insights Into Customer Growth
RFM is a data-driven customer segmentation technique that empowers marketers to make tactical decisions. It enables quick identification and segmentation of users into homogeneous groups. This allows for differentiated and personalized marketing strategies that improve user engagement and retention.
You Might Like to Read: What is Target Market Segmentation? Definition, Types & Examples!
Frequently Asked Questions About RFM Analysis
How many RFM segments are there?
RFM segmentation typically creates between 5 to 10 segments, depending on how you set the scoring thresholds for Recency, Frequency, and Monetary value. While a 5-point scale can generate up to 125 unique combinations, businesses often simplify by focusing on the most relevant segments for easier analysis and action.
What is an ideal RFM score?
An ideal RFM score depends on your business goals. A high score, like 555, generally represents a highly valuable customer. However, what’s most important is which metric holds the most weight for your business. Whether it’s Recency, Frequency, or Monetary value, understanding your priorities will help you identify the customers who are most valuable for your specific objectives.
Can RFM analysis be combined with other segmentation methods?
Yes, RFM analysis can be combined with demographic, psychographic, or behavioral segmentation to build richer customer profiles. For example, after identifying your top RFM segments, you can layer on demographic filters like age, location, or device type to tailor messaging more precisely. Combining RFM with qualitative data enables more effective personalization, campaign planning, and long-term customer strategy.
Meet CleverTap at eTail West, Palm Springs from 23 to 26 February 2026 and we can discuss your growth, personalization and retention challenges.
Pushpa Makhija 
Pushpa Makhija, a Senior Data Scientist at CleverTap, has over 15 years of experience in analytics and data science. She excels in deriving actionable insights for customer engagement and market research data, models built for marketer's use cases.
Free Customer Engagement Guides
Join our newsletter for actionable tips and proven strategies to grow your business and engage your customers.
