


Table of Contents
Categories
Most Popular


User retention is a critical metric to track if you want to understand why your customers churn. While acquiring new users is essential, retaining existing ones is often more cost-effective and beneficial for long-term growth. This is where retention analysis comes into play.
In this blog, we’ll explore what retention analysis is, why it matters for your business, and walk you through a 9-step process to conduct it effectively.
What is Retention Analysis?
Retention analysis is the process of evaluating user engagement over time to determine how long customers continue to interact with your product or service. This analysis helps identify patterns and factors that influence customer loyalty or attrition, providing insights essential for developing strategies to improve retention rates.
How Customer Retention Analysis Works
Customer retention analysis focuses on understanding the behaviors and characteristics of users who continue to engage with your product versus those who churn. It also helps you identify at which point in the customer journey they are more likely to churn.
By segmenting users into cohorts—groups sharing common characteristics or behaviors—you can track and compare their engagement over time.
Cohort analysis and cohort retention analysis are related but distinct methods for understanding user behavior. Cohort analysis segments users into groups based on shared characteristics or experiences over a defined timeframe, allowing businesses to identify patterns in engagement, conversion, and other metrics. In contrast, cohort retention analysis specifically focuses on measuring how well different cohorts retain users over time, tracking the percentage of users who remain active after their initial interaction.
What are the Benefits of Retention Analysis?
Retention analysis provides businesses with powerful insights that drive growth and improve customer engagement.
Here are the key benefits of retention analysis:
1. Reduces Customer Churn
By analyzing when and why customers stop using a product, businesses can identify and address the root causes of churn. This enables companies to make informed adjustments to product features, pricing, or customer support to retain users effectively.
2. Improves Customer Lifetime Value (CLV)
Retention analysis helps you identify and nurture high-value customers. By enhancing the retention of loyal users, you maximize their customer lifetime value (CLV), ultimately contributing to increased revenue over time.
3. Enhances User Engagement
By understanding how and when customers interact with your product, you can design personalized experiences that encourage deeper engagement. For example, cohort retention analysis can reveal which features drive user satisfaction, allowing you to prioritize improvements.
4. Optimizes Marketing Strategies
Retention data can be used to assess the effectiveness of different acquisition channels. Understanding which channels attract the most loyal customers allows you to focus your marketing budget on the platforms that deliver the best results.
5. Supports Product Development
Retention insights highlight what works and what doesn’t within your product. For instance, tracking behavioral cohorts can help identify underperforming features or onboarding issues, enabling data-driven decisions to enhance the product experience.
6. Strengthens Competitive Edge
Retention analysis helps you stay ahead of competitors by allowing you to proactively address churn risks, tailor offerings, and build stronger relationships with your users. A strong focus on retention ensures consistent customer satisfaction, fostering a positive brand reputation.
By leveraging retention insights, businesses can make strategic decisions that benefit both their customers and their bottom line.
9 Steps to Conduct Retention Analysis
It’s important to remember that there is no universal approach to retention analysis; each app and its users are unique. Let’s take a look at some steps to conduct retention analysis.
1. Define Active and Inactive Users
Before diving into retention metrics, you need to establish clear definitions for what constitutes an active or inactive user. Different types of mobile apps may have varying criteria:
- Active User: Some apps may consider anyone who opens the app as active, while others may only count users who complete specific actions, such as making a purchase or posting content.
- Inactive User: Conversely, inactive users might be defined as those who haven’t engaged with the app in a set period, like a week or a month.

It’s essential to align these definitions with your business goals and KPIs to ensure accurate measurement.
2. Set Retention Goals and Define the Right Metrics
Start by aligning your retention goals with your business model. For example:
- Customer Retention Rate (CRR): Percentage of customers retained over a period.
- Revenue Retention: Useful for SaaS businesses. Includes Gross Revenue Retention (GRR) and Net Revenue Retention (NRR).
- Product Feature Retention: How frequently users engage with specific features.
- Time-Based Retention: Day 1, Day 7, and Day 30 retention help gauge long-term stickiness.
Tip: Create a retention metric matrix to ensure cross-functional teams (product, growth, marketing) are tracking KPIs that matter.
Here’s how to calculate retention rate:
- Select a Time Frame: Choose an appropriate period for measurement—this could be daily, weekly, or monthly based on your app’s usage patterns.
- Initial User Count: Identify how many new users began using your app at the start of your selected time frame.
- Return Users: Count how many of those initial users return during the specified period.
The formula for calculating the retention rate is:
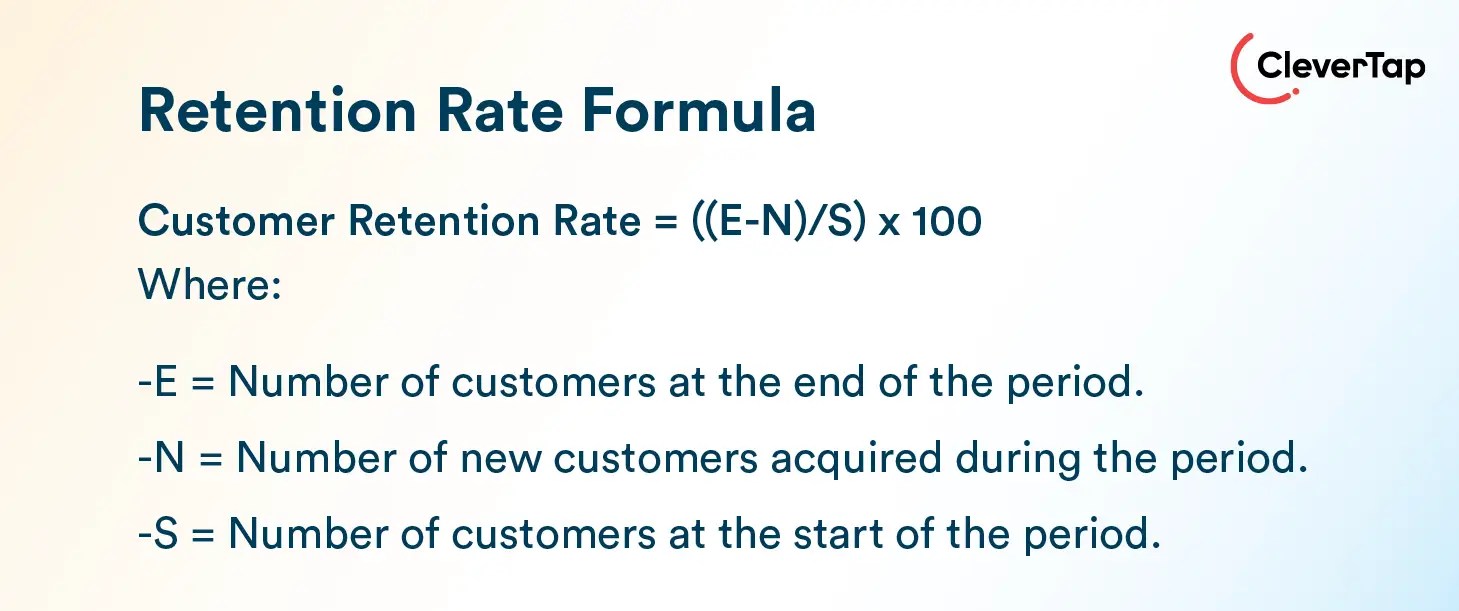
Learn how to calculate retention rate. Or use our easy-to-use retention rate calculator.
3. Segment Users with Cohort and Behavioral Analysis
Segment users into cohorts based on signup date, purchase behavior, or in-app actions. This allows you to:
- See how retention evolves over time
- Compare the effectiveness of different onboarding strategies
- Identify drop-offs within specific lifecycle stages (e.g., new vs. loyal customers)
Take it further by layering behavioral segmentation:
- Power users vs. casual users
- Users who used a feature within 24 hours vs. those who didn’t
- Demographic/geographic cohorts
For example, a fintech app may find that users who complete KYC within 48 hours have 2x higher 30-day retention.
4. Uncover Retention Drivers Using Funnel and Correlation Analysis
Understanding what causes users to stick is key. Use tools and data techniques to:
- Analyze funnel drop-offs: Where are users abandoning the journey?
- Run correlation analysis: Which behaviors (e.g., referrals, feature use) correlate strongly with long-term retention?
Use visualizations like journey maps, heatmaps, and behavior flow charts to illustrate insights.
Tool tip: Platforms like CleverTap can visualize these paths and surface trends.
5. Predict and Prevent Churn with Retention Modeling
Move from reactive to proactive by building churn prediction models:
- Use machine learning techniques like logistic regression or decision trees.
- Identify early warning signals such as inactivity spikes, uninstalls, or decreased engagement.
- Assign churn risk scores and trigger preemptive campaigns.
Tip: Combine churn prediction with customer lifetime value (CLV) scoring to prioritize high-value users.
6. Run Experiments to Improve Retention
Retention analysis isn’t complete without experimentation:
- A/B test onboarding flows, push notification timing, loyalty offers, or reactivation campaigns.
- Use holdout groups to measure incremental retention impact.
Run these tests continuously and tie results back to your retention KPIs. For example, you can test whether showing a progress bar in the onboarding flow increases Day 7 retention.
7. Create Real-Time Dashboards for Continuous Monitoring
Build dashboards that track retention in real-time and are accessible across teams:
- Segment by acquisition channel, product version, or campaign.
- Set up alerts for sudden drops in key retention cohorts.
- Use comparison views to see how new releases or experiments impact user stickiness.
8. Incorporate Qualitative Feedback to Add Context
Quantitative data tells you what happened. Qualitative data tells you why.
- Gather insights from NPS feedback, customer interviews, and churn exit surveys.
- Tag and categorize feedback to identify patterns (e.g., poor onboarding, confusing UX, missing features).
Tip: Align qualitative feedback with cohort insights to develop more human-centric retention strategies.
9. Turn Insights into Lifecycle Campaigns
Retention analysis should drive action:
- Use findings to create personalized lifecycle campaigns (e.g., onboarding nudges, win-back offers, loyalty rewards).
- Map campaigns to each stage of the user journey using tools like CleverTap Journeys.
Data-informed engagement strategies that adapt to where each user is in their lifecycle.
Retention Analysis Using CleverTap
Retention analysis is crucial for user retention and app growth, but it’s just the start. Relying solely on past data is ineffective. Using advanced data tools like CleverTap allows you to proactively address churn. Let’s see how.
What is a Retention Report?
A retention report visually groups users based on when they first completed an action, like launching an app, and when they returned. It helps marketers track retention trends and identify when new users are most likely to drop off.

Here’s a sample retention chart, also called a cohort retention chart:
This chart displays cohorts of new users who downloaded an app on a specific day and shows their return rate over the next 10 days. It can also be represented as a customer retention graph or retention curve.
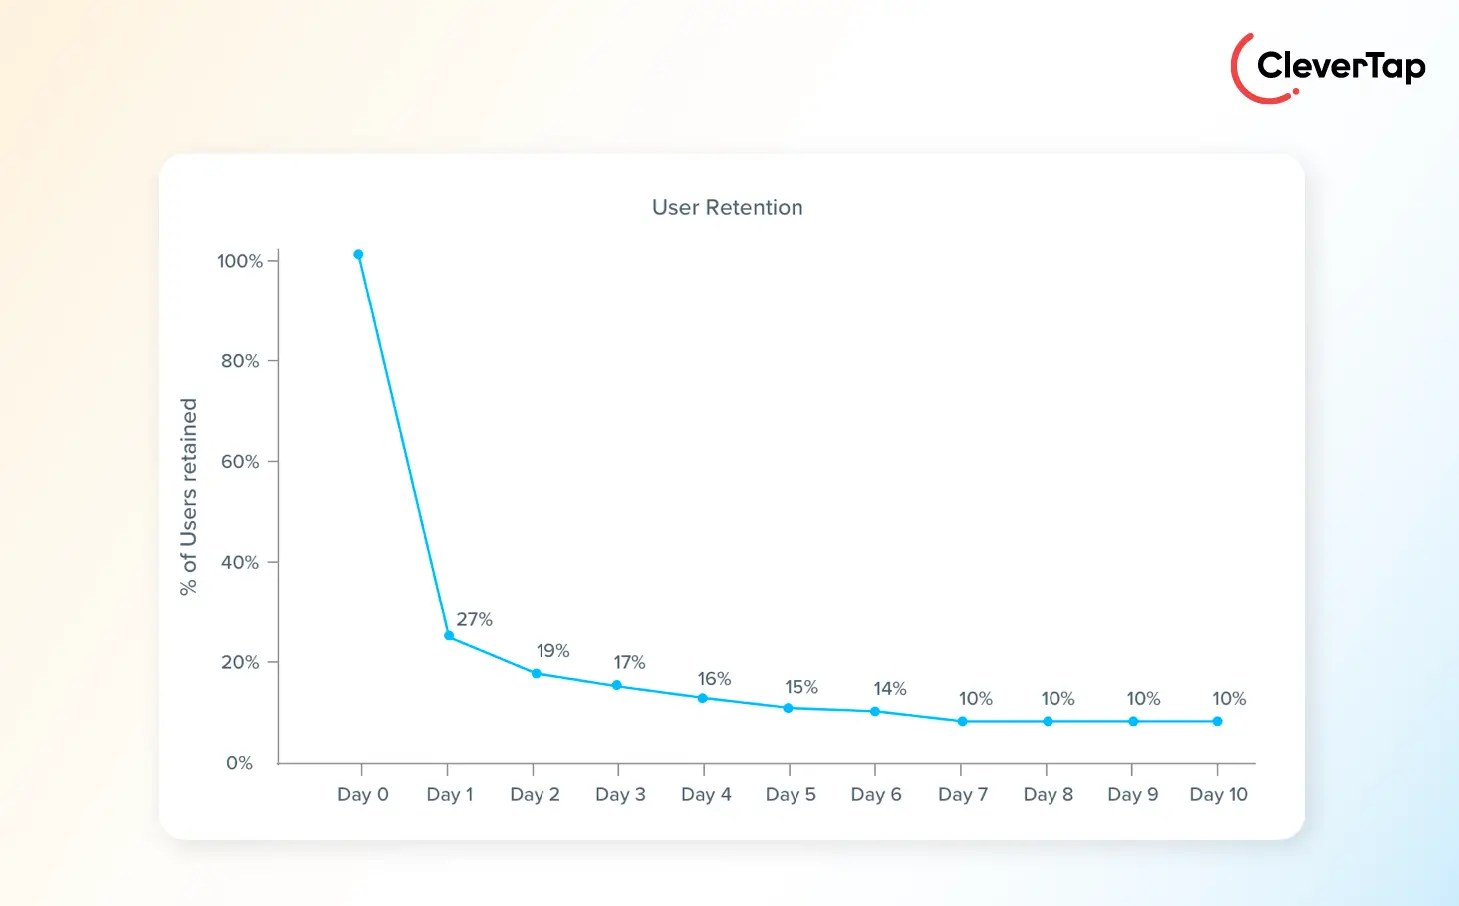
Cohort analysis reveals significant drops in user retention, helping marketers understand the optimal time to engage new users and focus their efforts on improving retention.
Look for answers to the following questions when conducting retention analysis:
1. How often do new users return?
Retention cohorts reveal return rates and user behavior throughout their lifecycle, enabling targeted onboarding campaigns that enhance user experience and drive conversions.

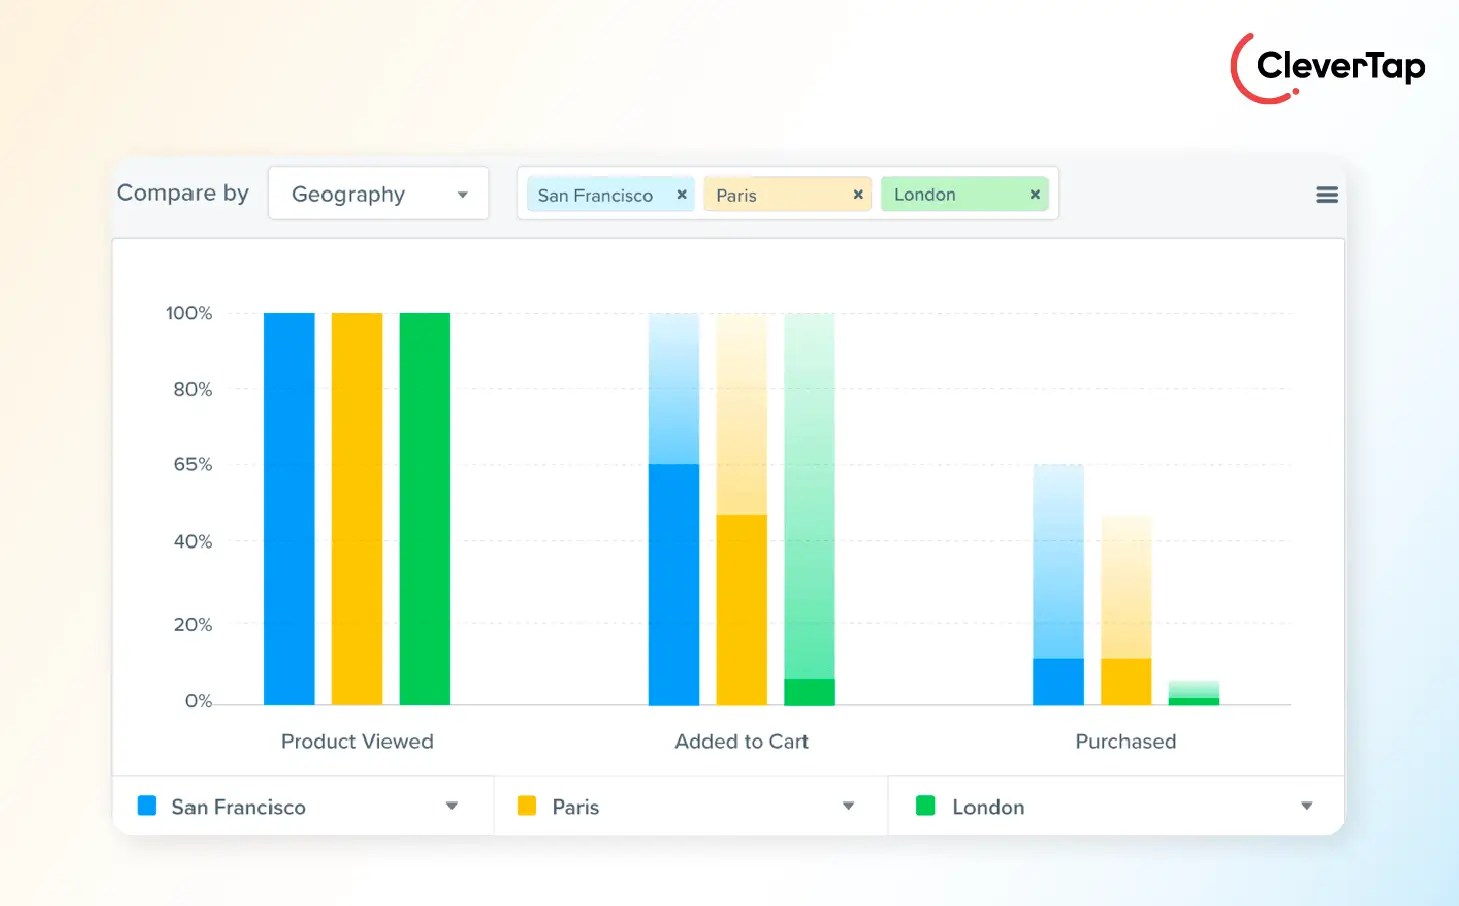
2. Where are users dropping off?
Funnel analysis visualizes user interactions, highlighting key activities that drive retention and points of drop-off. This insight helps refine user journeys and improve engagement strategies.
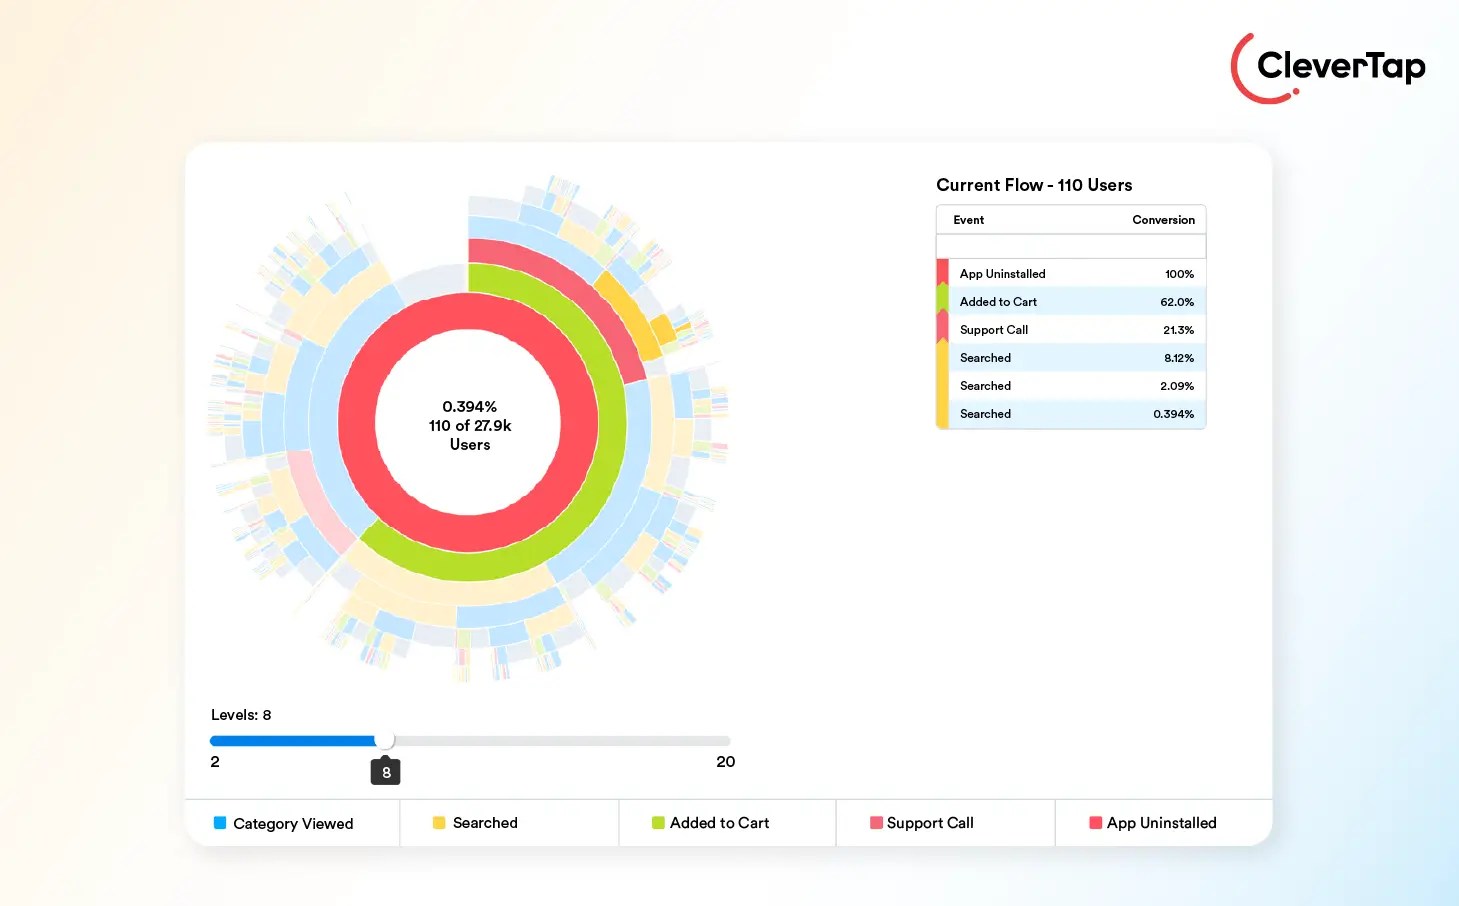
3. Which actions correlate with higher retention or churn?
Flows analytics show user behavior before and after specific in-app events, identifying actions linked to churn. This allows you to re-engage at-risk users and enhance overall user experience.
4. Which users are at risk of churn?
RFM analysis segments users based on engagement frequency and recency, helping identify loyal customers and dormant users. It also reveals effective channels to re-engage these users and prevent uninstalls.

From Analysis to Action
Effective retention analysis is crucial for sustainable app growth and long-term success. By defining clear metrics, understanding user behavior through cohort analysis, and using advanced analytics tools, you can identify patterns that lead to both retention and churn.
The key is not just collecting data, but acting on these insights through personalized engagement strategies and timely interventions.
Retention analysis is an ongoing process—not a one-time effort. Your retention strategies must adapt as user behaviors evolve and market conditions change. Start by implementing basic retention tracking, then gradually build more sophisticated analysis methods as you gather more data and insights about your unique user base.
Read to take control of your app’s retention?
Shivkumar M 
Head Product Launches, Adoption, & Evangelism.Expert in cross channel marketing strategies & platforms.
Free Customer Engagement Guides
Join our newsletter for actionable tips and proven strategies to grow your business and engage your customers.
