


Table of Contents
Categories
Most Popular


Has it ever happened that, as you reported on campaign stats like impressions, click-through rates, or conversions, you were mercilessly cut off with: “So what?”
While such metrics are great for comparing the performance of specific campaigns. These metrics are not enough to measure the real impact of marketing on business metrics. Using these stats you can’t answer questions like:
- What is the ROI of marketing activities per quarter?
- What is the year-to-date marketing contribution to revenue?
Beyond this, you can’t confidently tell if your marketing activities are working. There’s little or no visibility into how marketing is moving the needle. And there’s no long term view of the consolidated impact of all your engagement campaigns.
The Vicious Circle of Vanity Marketing Metrics
It’s great to get a stellar CTR for a push notification campaign.
And it’s essential to track your app’s number of downloads.
These metrics seem reasonable to measure. But there’s a catch. These metrics are often not actionable in the context of business growth.
In other words, vanity metrics are measurements designed to be impressive as opposed to being actionable or relevant to core business goals such as revenue or operating margins.1
Spending too much time and energy on tracking vanity metrics can keep you from doing the things that matter to the business.
Say you register a sudden spike in app downloads last month. The metric “app downloads” doesn’t tell you anything about what caused the sudden surge in downloads. Are these users using the app for free? And how engaged are they?
However, if you were able to track metrics like ARPU, retention rate, or frequency of use for users acquired in the last month. You would get actionable insights on the quality of users you just acquired. And unlike vanity metrics, these numbers are actionable.
Actionable Metrics vs Vanity Metrics
Metrics that tie specific and repeatable actions to observed results are actionable metrics. They usually cascade down from top-level business objectives.
On the other hand, vanity metrics offer a snapshot of the current state without telling marketers how it happened or what to do next.
Let’s examine the difference between actionable metrics and vanity metrics in the table below:
| Vanity Metrics | Actionable Metrics |
|---|---|
| Marketing Spend | Return on Marketing Spend |
| Number of Leads | Cost per Lead |
| Number of Social Media Followers | Social Media Referrals |
This is not to say that vanity metrics are useless. Generally, these are top of the funnel metrics that often act as indicators for things like brand awareness or reach. Given the right context, vanity metrics can be useful too.
Introducing Real Impact
One way to understand the efficacy of your marketing campaigns is to isolate users from receiving campaigns using a control group. Then measure the effectiveness by comparing this group with the target group that receives your campaigns.
Real Impact, our latest reporting dashboard, gives you a long term view of the consolidated impact of your engagement campaigns on business metrics.
Using it you can easily track metrics like average revenue per user, conversions, retention, stickiness, recency and frequency of purchase, and more.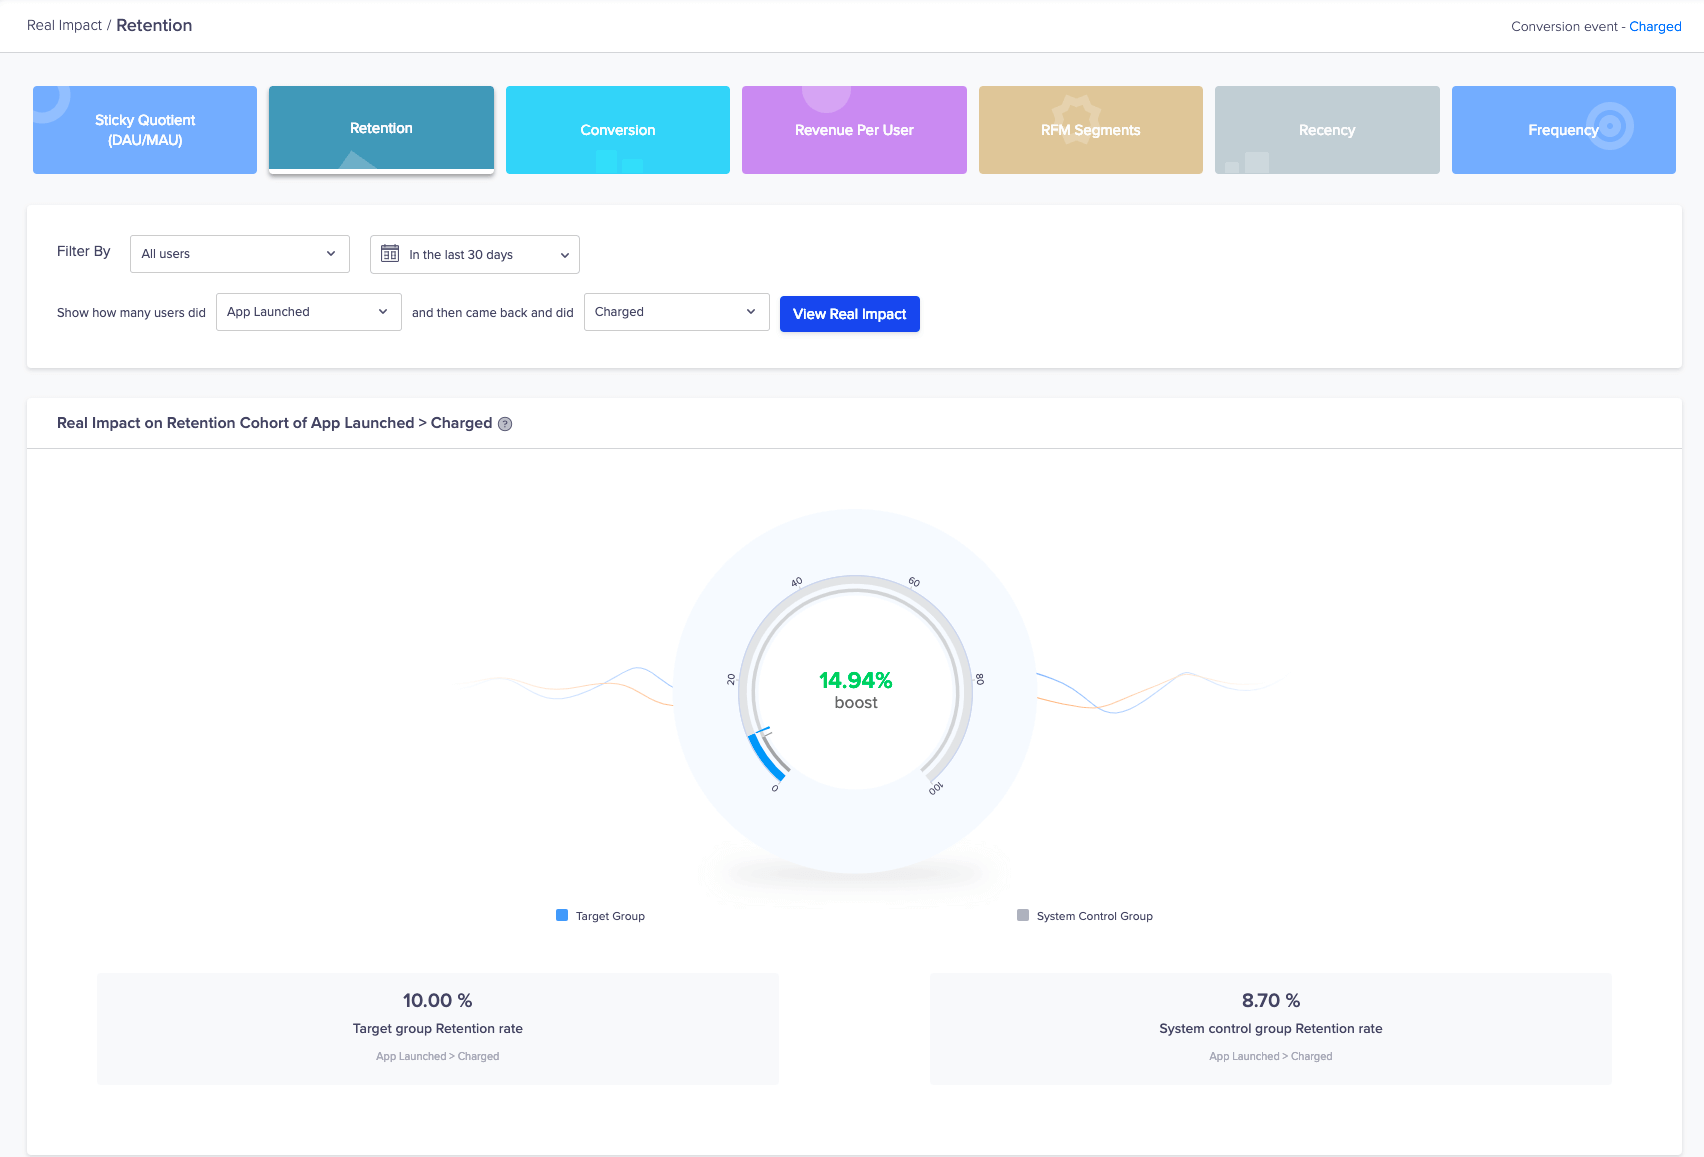
With Real Impact, you can tie marketing dollars spent to dollars earned and align marketing efforts to larger business goals.
Understanding Real Impact Metrics
Your marketing efforts are as good as your ability to assess their performance. Measuring the right metrics is the means to that end.
The advanced reporting dashboard of Real Impact helps you track a number of key metrics that indicate the effectiveness of your campaigns:
- Sticky Quotient (DAU/MAU): Real Impact on Sticky Quotient shows how often your audience engages with your product after receiving your campaign over a given duration. It measures the sticky quotient using the ratio of Daily Active Users to Monthly Active Users on your product.
- Retention:: This metric indicates how many users come back to your product to perform a set of actions based on your marketing efforts over a given period. For example, what percentage of users that made a purchase came back for a repeat purchase in the last 30 days?
- Conversion: Measure the Real Impact of your campaigns on a target group for a conversion event. This metric tells you what percent of target group users converted on your product as compared to the conversion rate of control group users.
- Revenue Per User: Select an event and its corresponding revenue property to identify the revenue per user over a period of time. For example, compare the average revenue per user in the target group (who received campaigns) and control group (who didn’t receive campaigns) in the last 30 days.
- RFM Segments: This Real Impact metric gives the boost in health score of the target group based on recency, frequency, and monetary parameters. For example: what is the RFM health score for all users that launched an app and made a purchase in the last 30 days?
The dashboard also shows an RFM grid that divides your audience into 10 different segments (champions, new customers, etc.) and indicates the change in the number of people in each segment. For example: there is a 17% boost in champion users. Or: the number of at-risk users shot up by 10%.You can further dive into this number from the RFM view to see the number of users that transitioned from one segment to another in a given time.
For example, the 17% overall boost in champion users came from 2,500 out of 12,000 potential loyalists that moved to the champion segment in the last 30 days while 500 champions left the segment in the last 30 days.
- Recency: Track how recently target users visited your product in the last 30 days as compared to the control group.
- Frequency: Track the frequency of visits of the users in a target group that made a purchase in the last 30 days.
Begin Measuring the Real Impact of your Marketing Campaigns
We have seen how important it is to track the right metrics to gauge the true performance of your marketing efforts. You can do it too. Just log into your CleverTap dashboard to start measuring the right metrics. Contact us to see the dashboard live in action.
Also, let us know what you think about the capability in the comments section below.
Subharun Mukherjee 
Heads Cross-Functional Marketing.Expert in SaaS Product Marketing, CX & GTM strategies.
Free Customer Engagement Guides
Join our newsletter for actionable tips and proven strategies to grow your business and engage your customers.
