


Table of Contents
Categories
Most Popular


Understanding your churn rate is crucial because it helps you pinpoint where you might be losing customers and why. In this article, we’ll explore what churn rate is, how to calculate churn rate, and why it’s a critical metric for sustaining long-term business success.
What is Churn Rate?
Churn rate is the rate at which customers stop using a product or service within a specific period of time, such as a month or year. It is expressed as a percentage of customers who terminate their contracts or subscriptions with a business during a defined period.
Churn rate is a vital sign of your company’s health. A high churn rate can signal problems like customer dissatisfaction, better competition, or perhaps a mismatch between what your business offers and what customers need. On the flip side, a low churn rate suggests that your customers are happy and loyal, which is great news for long-term growth.
Customer Churn Rate vs. Revenue Churn Rate
While both customer churn rate and revenue churn rate measure the loss experienced by a business, they capture different aspects of churn and offer distinct insights.
- Customer Churn Rate refers to the percentage of customers who stop doing business with a company during a specific period. It helps understand user retention and loyalty trends.
- Revenue Churn Rate, on the other hand, measures the percentage of recurring revenue lost due to customer cancellations, downgrades, or non-renewals within a given timeframe. This metric is especially important for businesses with tiered pricing models, as losing a high-paying customer has a greater revenue impact than losing a low-paying one.
Example Calculation:
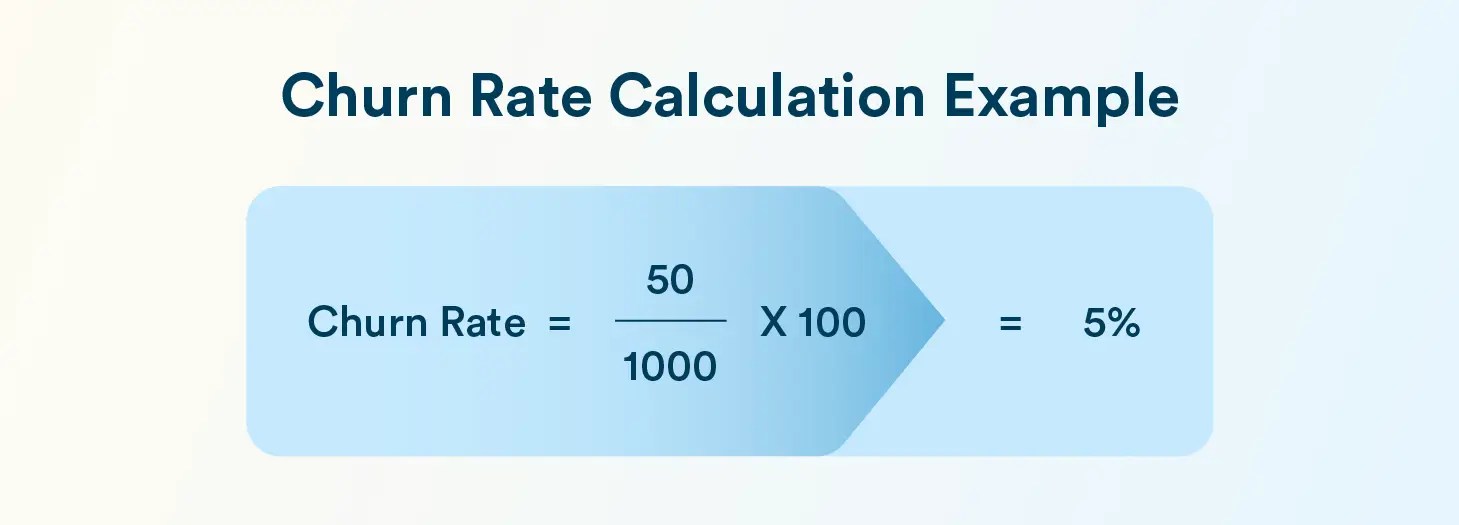
Let’s say a SaaS company had 1,000 customers at the beginning of the month and lost 50 of them by the end.
Customer Churn Rate = (50 / 1000) × 100 = 5%
Now assume the company started the month with $100,000 in Monthly Recurring Revenue (MRR) and lost $10,000 due to cancellations or downgrades.
Revenue Churn Rate = ($10,000 / $100,000) × 100 = 10%
This example shows that although only 5% of customers churned, they were likely high-value clients, resulting in a much higher 10% revenue churn rate. This highlights the importance of tracking both metrics for a full picture of business health.
How to Calculate Churn Rate? 4 Key Formulas Explained
Let’s talk a look at four formulas that you know need to know to calculate churn rate.
1. Customer Churn Rate
The customer churn rate formula is relatively simple and can give you great insights into how well you’re keeping your customers around:
Pick a Time Frame: Start by deciding on a time period to examine—this could be a month, a quarter, or even a year. The period you choose should make sense for how your business operates and how often you interact with your customers.
Check Your Starting Numbers: You need to know how many customers you had at the beginning of this period. This is your starting point. For subscription-based businesses, this means counting all active subscribers. For other types of businesses, it might mean counting all customers who made a purchase or used your service.
Track Who’s Leaving: Next, you need to count how many customers stopped being active during this time. This could mean they canceled their subscription, stopped buying from you, or just stopped engaging altogether.
Do the Math: Now, you can calculate churn rate using the following churn rate formula.
Churn Rate (%) = (Customers Lost During a Time Period ÷ Total Customers at the Start of the Time Period) X 100
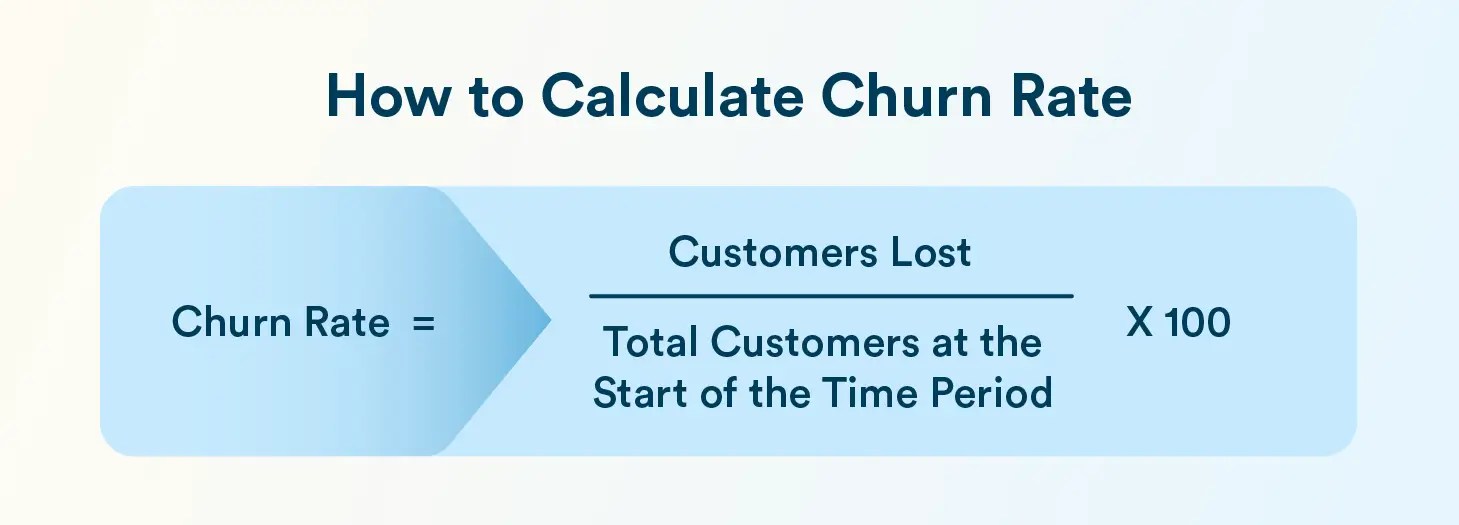
Understand What It Means: This percentage tells you how many customers you’re losing over time. A lower churn rate is generally good, showing that your customers are sticking around. A higher churn rate, however, might mean there’s something wrong—maybe with your product, service, or even customer support.
2. Gross Revenue Churn Rate
This metric measures the percentage of revenue lost due to customer cancellations, excluding any upsells or expansions. It’s crucial for identifying how much predictable revenue is leaking from your existing customer base.
Gross Revenue Churn Rate (%) = (Revenue Lost from Existing Customers ÷ Monthly Recurring Revenue (MRR) at Start of Period) × 100
Not every customer who churns brings in the same revenue. Gross revenue churn rate helps understand the actual financial impact of lost customers by measuring the percentage of recurring revenue lost during a period, giving a clearer picture of how churn affects your bottom line.
3. Adjusted Churn Rate
This rate accounts for newly acquired customers during the same period, offering a more realistic view of net churn. It’s particularly useful for fast-growing businesses where new customer acquisition and churn occur simultaneously. Adjusted churn rate gives a more balanced view of retention health.
Adjusted Churn Rate (%) = [(Lost Customers − New Customers Acquired) ÷ Total Customers at Start] × 100
4. Seasonal Churn Rate
This variant considers fluctuations tied to specific timeframes, such as holidays or fiscal quarters. Analyzing churn seasonally helps businesses uncover and prepare for predictable, cyclical behavior in customer departures.
Seasonal Churn Rate (%) = (Customers Lost in a Season ÷ Customers at Start of Season) × 100
Tips to Understand and Analyze Churn Rate
Calculating churn rate is just the beginning. To truly tackle churn, it’s essential to dig deeper into the reasons behind it and uncover actionable insights. By analyzing your data and identifying patterns, you can take targeted steps to retain customers and improve overall satisfaction. Here are some practical tips to help you get started.
- Look deeper: Not all churn is the same. Some customers leave because they found a better option, while others might leave because of pricing issues or dissatisfaction. Understanding why people leave can help you address these issues.
- Segment your data: If you can, break down your churn rate by different customer groups. This might show you patterns—like maybe new customers are leaving more quickly than long-time ones, or customers from a particular region are more likely to churn.
Learn how to conduct churn analysis and why it is necessary.
What is a Good Churn Rate?
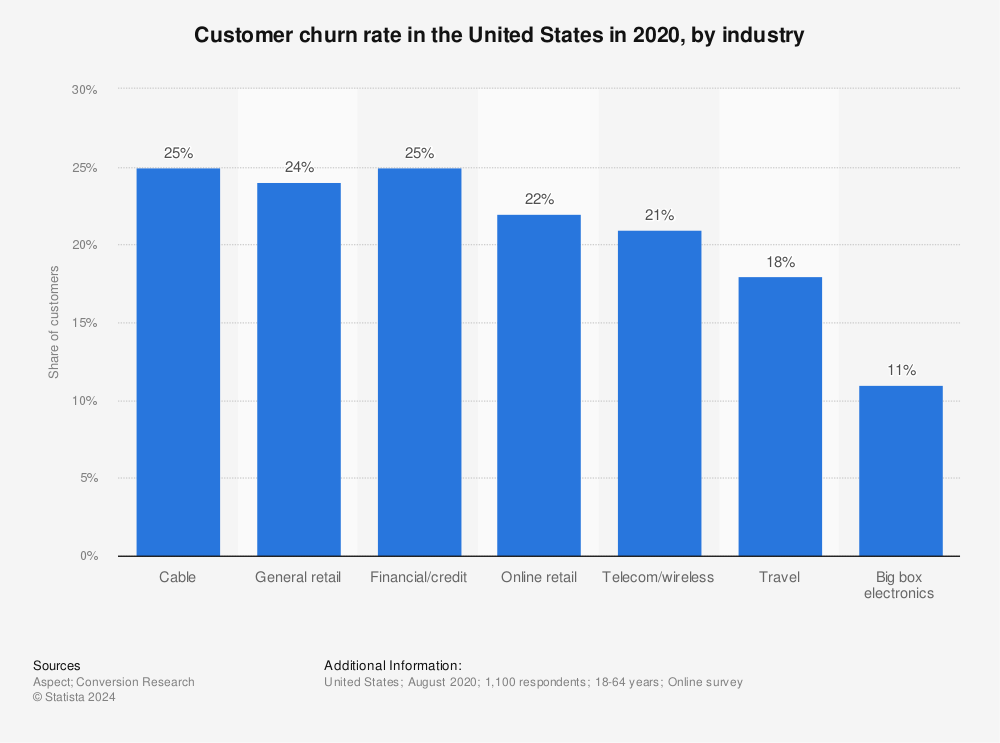
An acceptable average churn rate is 5%. But it varies greatly across industries, and there is no singular churn rate number that works for businesses of all sizes. Average monthly revenue churn rates typically range from 1% to 17%, with the majority of studies placing the median between 5% and 10%.
The following chart from Statista shows churn rate by industry in the United States.
Why Should You Calculate and Analyze Churn Rate?
Churn rate calculation goes beyond just a simple metric. It’s a vital piece of the puzzle that can offer deep insights into your company’s health, customer satisfaction, and growth potential. Understanding your churn rate is crucial for several reasons:

Tracks Customer Satisfaction
Your churn rate acts as a key indicator of customer satisfaction. If people are leaving, it might be because they found something better, had a bad experience, or simply no longer need your product.
High churn rates can signal trouble, like declining service quality, increased competition, or a customer service issue. Tracking churn helps you identify these issues early and address them before they lead to significant revenue loss.
Predicts Revenue
Understanding churn rates also helps in forecasting revenue. In a subscription-based model, for example, high churn rates can severely impact your revenue projections and cash flow.
If 20% of your subscribers are leaving each month, you can’t rely on your current customer base to sustain growth. This insight forces you to adjust your marketing and customer retention strategies, so you’re not just filling a leaky bucket.
For example, in 2011, Netflix made a controversial decision to increase its prices and split its DVD-by-mail and streaming services into separate offerings. Customers revolted and many churned. Netflix lost 4% of its subscriber base in the U.S. and $8 million a month in revenue. The company apologized and quickly reversed its decision.
This example highlights the importance of listening to customer feedback and when things begin to go sideways, being lightning fast in addressing the issue and potentially reversing course if a strategy is proving to be exceptionally damaging to the business.
Predicts Customer Acquisition Costs (CAC)
Churn rate is also closely tied to customer acquisition costs (CAC). It’s often said that retaining an existing customer is cheaper than acquiring a new one. This is true because the initial costs—advertising, onboarding, and initial discounts—are sunk costs that only pay off if a customer sticks around long enough to cover them.
A high churn rate means that your CAC will skyrocket, as you constantly need to replace lost customers just to maintain your current revenue level.
Helps You Assess Customer Lifetime Value
Knowing your churn rate also informs your customer lifetime value (CLV) calculations. CLV is the total revenue a business can expect from a customer over their entire relationship. If your churn rate is high, your CLV will be lower, as customers aren’t staying long enough to generate substantial revenue.
This, in turn, limits what you can spend on acquiring new customers. A balanced understanding of both CLV and churn rate helps in setting realistic budgets and expectations for growth.
For example, let’s consider Blue Apron, a subscription meal service kit. In 2017, Blue Apron went public, reporting that it had acquired over one million customers. However, the company also reported high churn rates, with many customers trying the service for a few months, then canceling, unsatisfied with the offerings. In addition to its CLV declining from 26 months to just six months over two years, the company also reported a net loss of $210 million in 2017, and its stock price declined by over 50% from its initial public offering price.
Obviously, churn here had a hugely negative impact on a seemingly successful company going public, and it had to undertake many changes to encourage customers to stay subscribed.
Better Customer Segmentation
Understanding churn allows you to segment your customer base more effectively. Not all churn is equal; losing a long-term, high-value customer is more detrimental than losing a short-term, low-value one. By analyzing churn data, you can identify which customer segments are more prone to leaving and shape your retention strategies accordingly. This could involve personalized offers, improved customer service, or even product improvements targeted at at-risk groups.
Learn how to effectively conduct customer segmentation in our detailed guide.
Tracks Market Share
A customer who leaves will likely find another business to meet their needs—your competitor. If too many customers leave, your company will suffer from the impact of this decreased market share and increasing inability to compete.
For example, BlackBerry was once the leading smartphone manufacturer in the world, with a dominant market share of over 50% in the U.S. market in 2009. However, the rapidly evolving smartphone market saw many customers switch to more preferred and innovative devices. BlackBerry reported a net loss of $1.1 billion in 2013; its stock price declined by over 70% from its peak in 2008. Eventually, the company largely exited the smartphone market altogether.
Calculating churn rate helps you track your market share and pushes you to continually “innovate or die.”
Tracks Brand Reputation
Another impact of customer churn can be on a company’s reputation, as unhappy customers can and will share their negative experiences on social media, website comments, and third-party review sites.
Timely churn rate calculation helps you understand customer sentiments and improve your product and services to improve customer retention and reduce churn.
4 Examples of Churn Across Industries
Here are some common examples of churn across various industries:
Subscription Services: Imagine you subscribe to a streaming service like Netflix. If you decide to cancel your subscription, maybe because you’ve binged all your favorite shows or found a better deal elsewhere, that’s an example of churn. For companies like Netflix, tracking how many people cancel each month helps them calculate their churn rate, understand customer satisfaction, and what might be driving people away.
Mobile Apps: Consider a fitness app that you download to help track your workouts. If you stop using the app because it’s not meeting your needs or you find it difficult to use, you’re considered “churned.” App developers often calculate churn rate to see how many users are active over time. High churn rates might indicate that users aren’t finding the app engaging or useful enough.
Discover strategies to reduce your mobile app churn rate.
Retail Businesses: Brick-and-mortar stores also monitor churn rate. Let’s say you frequently visit a local grocery store, but suddenly stop because another store offers better prices or a more convenient location. The grocery store would see this as a loss in repeat business, which is a form of churn. For them, understanding why customers leave can help improve their offerings or customer experience.
SaaS Products: For SaaS companies, churn can occur when a business stops using its software. For instance, if a company decides to switch from one project management tool to another because the new one offers better features or a lower price, the original provider has lost a customer. SaaS companies often focus heavily on reducing churn because acquiring new customers is usually more expensive than keeping existing ones.
How to Reduce Churn Rate? 5 Tips To Keep Customers Engaged
Reducing churn rate is a top priority for any business aiming to retain its customer base and ensure long-term growth. Here are five engaging strategies to help you keep your customers coming back for more:
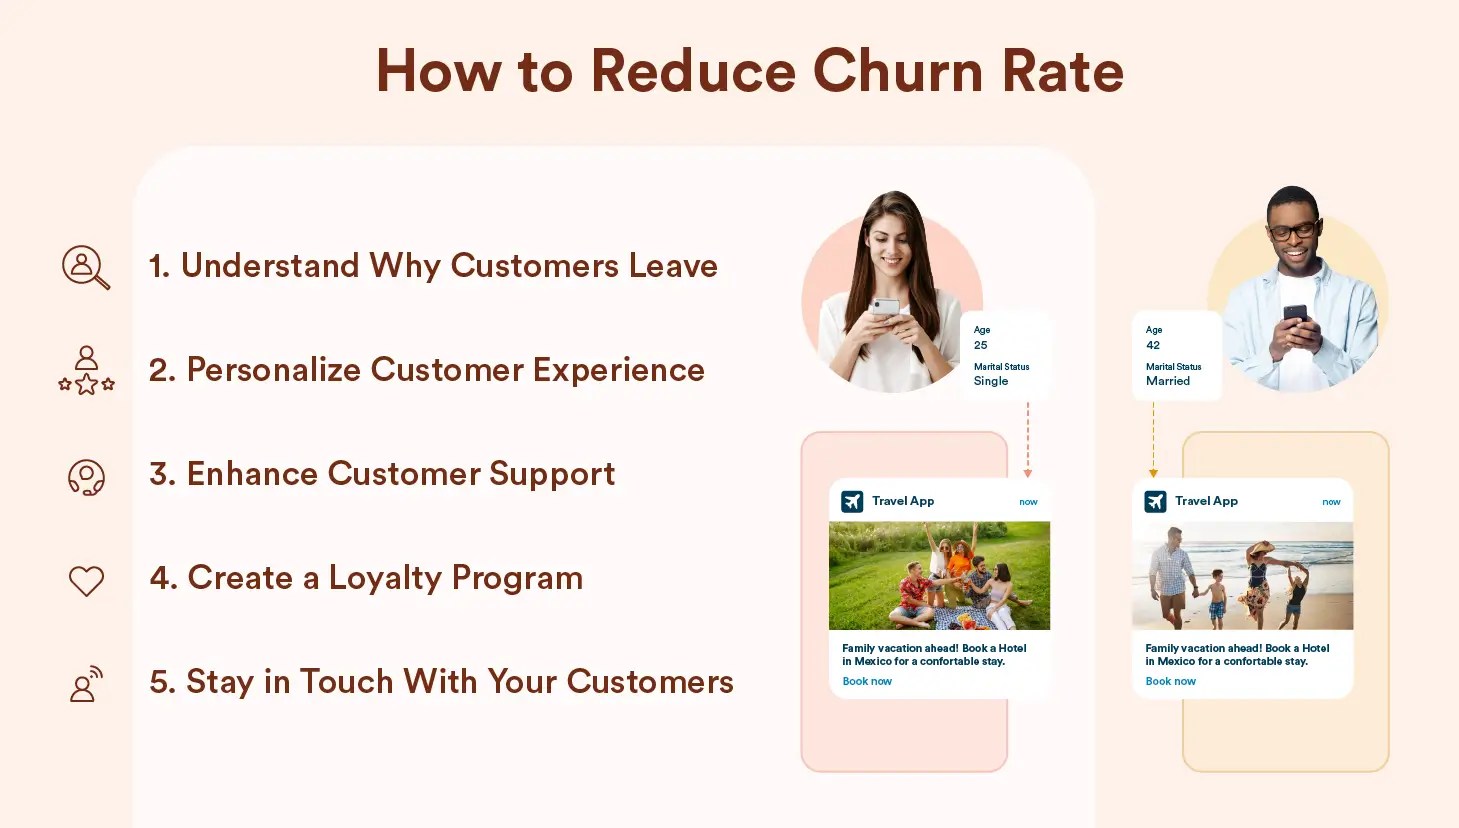
1. Understand Why Customers Leave
The first step to reducing churn is understanding why customers leave in the first place. Regularly collect feedback through surveys, interviews, and customer service interactions to get a clear picture of their pain points and needs. This insight will allow you to address issues proactively and show customers that their opinions matter.
2. Personalize the Customer Experience
Today, personalization is key. Use data analytics to tailor your interactions and offers to individual customers. From personalized email marketing campaigns to customized product recommendations, making each customer feel unique and valued can significantly reduce churn. Remember, a one-size-fits-all approach rarely works anymore.
3. Enhance Customer Support
Providing exceptional customer service is crucial. Ensure your support team is accessible, well-trained, and equipped to handle queries efficiently. Implementing live chat support and AI-driven chatbots can help provide immediate assistance. A quick and helpful response can turn a frustrated customer into a loyal one.
4. Create a Loyalty Program
Reward your customers for sticking around. A well-designed customer loyalty program can incentivize repeat business and increase customer satisfaction. Offer points, discounts, or exclusive deals to loyal customers. This not only encourages repeat purchases but also fosters a sense of belonging and appreciation.
5. Stay in Touch With Your Customers
Regular communication, whether through newsletters, social media, or personalized messages, keeps your brand at the forefront of their minds. Inform customers about new products, updates, and special offers. Consistent and relevant communication helps build a strong relationship and reduces the likelihood of churn.
How Ayopop Saw a 15% Reduction in Their 90-day Churn Rate With CleverTap
Here’s a real-world example of how CleverTap helped Ayopop, Indonesia’s fastest-growing mobile platform for consumer bill payments and digital transactions, to reduce its churn rate.
The Challenge
Ayopop faced several challenges common in fintech, particularly in transitioning from a market traditionally dominated by cash transactions to a digital platform. They needed to build trust around online payments, ensure data privacy and security, and create brand awareness to capture market share. Additionally, they struggled with a seamless onboarding process that could demonstrate the app’s value quickly and educate users about its features to prevent churn.
The Solution with CleverTap
To address these challenges, Ayopop partnered with CleverTap, leveraging its comprehensive suite of tools to better understand and engage its users. CleverTap’s platform enabled Ayopop to track every user interaction within the app, recording these as events. This granular data allowed the Ayopop team to use Funnels and Cohort Analysis to identify user behavior patterns, such as where and when users were most likely to drop off.
Key Strategies
- Automated Segmentation: Ayopop used CleverTap’s automated segmentation to categorize users based on demographics, usage frequency, and their likelihood to convert. This enabled them to create personalized campaigns tailored to specific user segments, improving engagement and retention.
- Behavioral Insights: By analyzing user interactions, Ayopop could refine their onboarding process and better engage users during critical points in their journey. They used push notifications and in-app messages to guide new users through the app, highlighting key features and benefits to ensure a smooth onboarding experience.
Results
These targeted strategies led to a 15% reduction in Ayopop’s 90-day churn rate, showcasing how understanding user behavior and engaging customers effectively can significantly enhance retention. Additionally, Ayopop saw a 26% growth in active users over the same period, demonstrating the broader impact of a well-executed retention strategy.
Learn how CleverTap can help boost your customer retention strategy.
Frequently Asked Questions (FAQs) About Churn Rate
1. Why is churn rate important?
Churn rate directly impacts growth and revenue. A high churn rate indicates customer dissatisfaction or poor product-market fit, while a low churn rate means customers are staying longer, boosting lifetime value and profitability.
2. What is a good churn rate?
A “good” churn rate depends heavily on your industry, business model, and customer type. However, an acceptable average churn rate is at 5%.
3. What is involuntary churn?
Involuntary churn refers to customer loss due to failed payment issues, not because they chose to cancel. Common causes include expired credit cards, insufficient funds, billing errors or fraud flags, and lapsed subscriptions not actively renewed.
Churn Rate is More Than Just a Metric
Your churn rate offers more than just insights into customer loss; it opens up new pathways for growth and improvement. By studying your churn rate, you can identify specific areas where customer satisfaction may be lacking, such as product features, customer service, or pricing strategies. This understanding allows you to explore targeted retention strategies, like personalized customer outreach, loyalty programs, or product enhancements.
As you move forward, consider how a deeper analysis of churn data can inform not only your customer retention efforts but also your overall business strategy. Viewing your churn rate as a strategic tool rather than just a metric can lead to more sustainable growth and a stronger connection with your customers.
Shivkumar M 
Head Product Launches, Adoption, & Evangelism.Expert in cross channel marketing strategies & platforms.
Free Customer Engagement Guides
Join our newsletter for actionable tips and proven strategies to grow your business and engage your customers.
