The primary aim of any marketing campaign is to effectively engage with the target audience and encourage them to perform the desired set of actions.
To deliver an effective marketing campaign, a marketer requires 3 key things:
- A target audience
- An effective message
- A means to evaluate the campaign’s result
Generally, a lot of time and effort is spent on identifying the audience. A relatively less effort is spent on creating an effective message and even lesser effort is focused on evaluating the results. An ideal target audience and a poor messaging will mostly likely result in poor results. Hence, the importance of an effective message cannot be understated. But, creating an effective message is highly subjective in relation to the other two points. Therefore, it is imperative to use a technique that helps the marketer to quantify the impact of available choices. The choices may range from content, aesthetics, emojis, subject lines, etc. Generally, the choices are distinguishable but sometimes even subtle changes might result in a dramatic shift in outcomes.
For example: We have observed that for similar campaigns, by using the word ‘cashback’ instead of ‘offers’, the CTRs increased by almost 15% to 20%.
Given couple of messaging choices, marketers often resort to A/B testing analytics to select the best choice.
What is A/B Testing?
Consider A/B testing as an experiment where two variants of a message are shown to 2 different groups of users. These groups of users comprise of a small proportion/sample of the entire target audience.
After running the experiment, the marketer selects the best message based on CTRs, conversion rates or other actions performed.
Put simply, the A/B testing can be broken down into 3 parts, viz., message variants, selection of user groups and choosing the winning variant. Let’s delve into each part in greater detail with the help of an example:
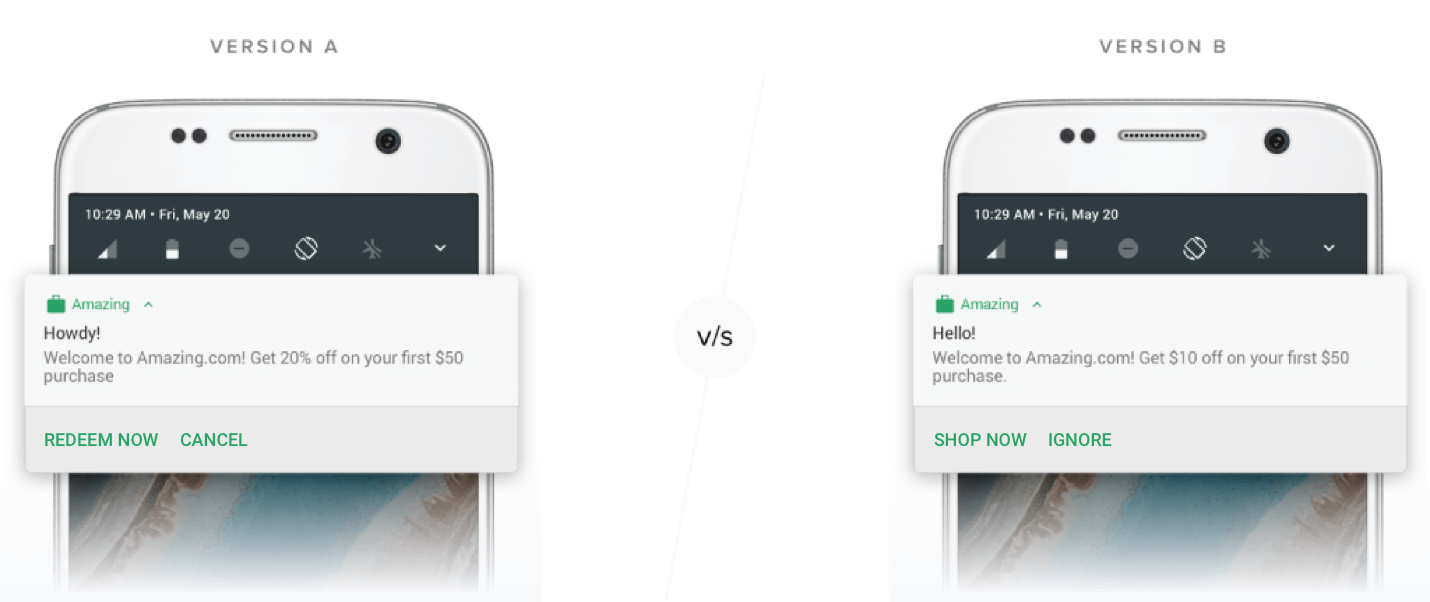
Suppose you are in charge of creating a push notification campaign for a product with a discount offer. You have at your disposal the target audience of 100,000 and the design templates of the push notifications.
I. Message Variants
Usually, there are multiple messages that are likely to resonate with your target audience. Hence, you will have to evaluate these and then select the most suitable version. Painstakingly, now assume, you have gone through the options and filtered down to two of your best candidates.
The difference in the two notifications above is just the content. We could also test different aesthetics, layout, etc. The framework of A/B experiments could be extended further for cases where you may have more than 2 cases.
Generally, Variant A is your default/first choice whereas Variant B is competing to dislodge your default choice.
II. Selection of User Groups
In order to conduct the experiment, you would need to reach out to two different groups of users.
What should be the size of each user set? Should it be 5%, 10%, 25% or some other number?
Ideally,
- The size of the user sets should be a small sample of the entire target audience.
- Also, the results from the marketing campaign run on those user groups should be numerically reliable i.e. the results obtained from the sample should be reproduced on the remaining target audience.
How do we ensure that the above objectives are met?
Thankfully, we have a good statistical rule which makes it easier to estimate the right sample size.
The key input to get the sample size is the expected CTR (the metric of interest in our example). Though we do not know the CTR, the campaign would ultimately clock, we need to make an educated guess based on the past CTRs of similar campaigns.
Target Audience for the campaign in the example = 100,000
for each Variant
Optimize your A/B tests and customize your marketing campaigns to drive the maximum ROI
For an expected CTR of 3%, we require a set of 12,421 distinct users in each variant. From the above calculator, you could infer that as the expected CTR increases, the required sample size decreases.
In practice, you should err on the side of caution and assume a lower expected CTR, if the target audience is sufficiently large.
You should also keep in mind other variables while deciding the expected CTR such as demographics of the target audience, operating system or device receiving the campaigns, time of sending the message out, duration of A/B testing, etc.
For example, we have observed that
- CTRs on Android devices are generally higher than iOS devices
- Gender of the user tend to have an impact on CTR for gender-specific campaigns
- Food apps get highest CTRs during lunch and dinner hours whereas Media and Publishing apps get the highest CTRs during evening hours
Another key point to note is that your sample size is not dependent on your target audience.
This helps you to know in advance the required sample size for different levels of CTR. In practice, it is not advisable to run A/B tests if the experiments are to be conducted on more than 50% of the target audience.
III. Choosing the Winning Variant
Congratulations! You are ready to start your experiment.
On what basis would you select the winner? Wouldn’t it be naive to select the winner based on just the highest CTR clocked?
Let’s take three scenarios for example:
| Scenario # | Variant A | Variant B |
|---|---|---|
| Scenario I | 300 (CTR = 2.42%) | 310 (CTR = 2.50%) |
| Scenario II | 300 (CTR = 2.42%) | 340 (CTR = 2.73%) |
| Scenario III | 300 (CTR = 2.42%) | 400 (CTR = 3.22%) |
The above table shows the actual number of users who clicked on the campaign during multivariate A/B tests under 3 different scenarios. The campaign was sent out to 12,421 users in each variant.
- For Scenario I and II, the CTRs are not significantly different. Hence, no clear winner.
- Scenario III seems to have a clear winner – Variant B.
How could we standardize our approach to select a winner and be sure that there is sufficient difference in CTRs between the 2 variants? We can certainly achieve this by using a statistical test.
Use this calculator to verify your A/B testing results. Please refer to this article to understand the working behind this methodology.
Conclusion
Just as you would prepare yourself for a mock session prior to a crucial sales pitch or test your code rigorously before deployment, it is always a good practice to test the efficacy of your messages. A/B testing provides a reliable framework for deciding the best variant which can maximize the desired action.

How to track your customers through your Conversion Funnel
Jacob Joseph 
Heads Data Science.Expert in AI, Data & Analytics and awarded 40 under 40 Data Scientists in India.
Free Customer Engagement Guides
Join our newsletter for actionable tips and proven strategies to grow your business and engage your customers.


