
















































Table of Contents
Categories
Most Popular


Sustainable scaling is impossible if existing revenue is quietly leaking out the back door. While acquisition metrics often steal the spotlight, tracking gross revenue retention (GRR) is how seasoned growth teams gauge the true stability of their business.
Also referred to as the gross retention rate, GRR is an essential health check for subscription and recurring revenue businesses. It shows exactly how much recurring revenue you retain from your existing customer base over a given period before factoring in any upsells or expansion.
This guide breaks down the GRR formula in plain, non-financial terms, covering a step-by-step calculation process, real-world examples across different business models, industry benchmarks, and how GRR differs from Net Revenue Retention (NRR).
What Is Gross Revenue Retention (GRR)?
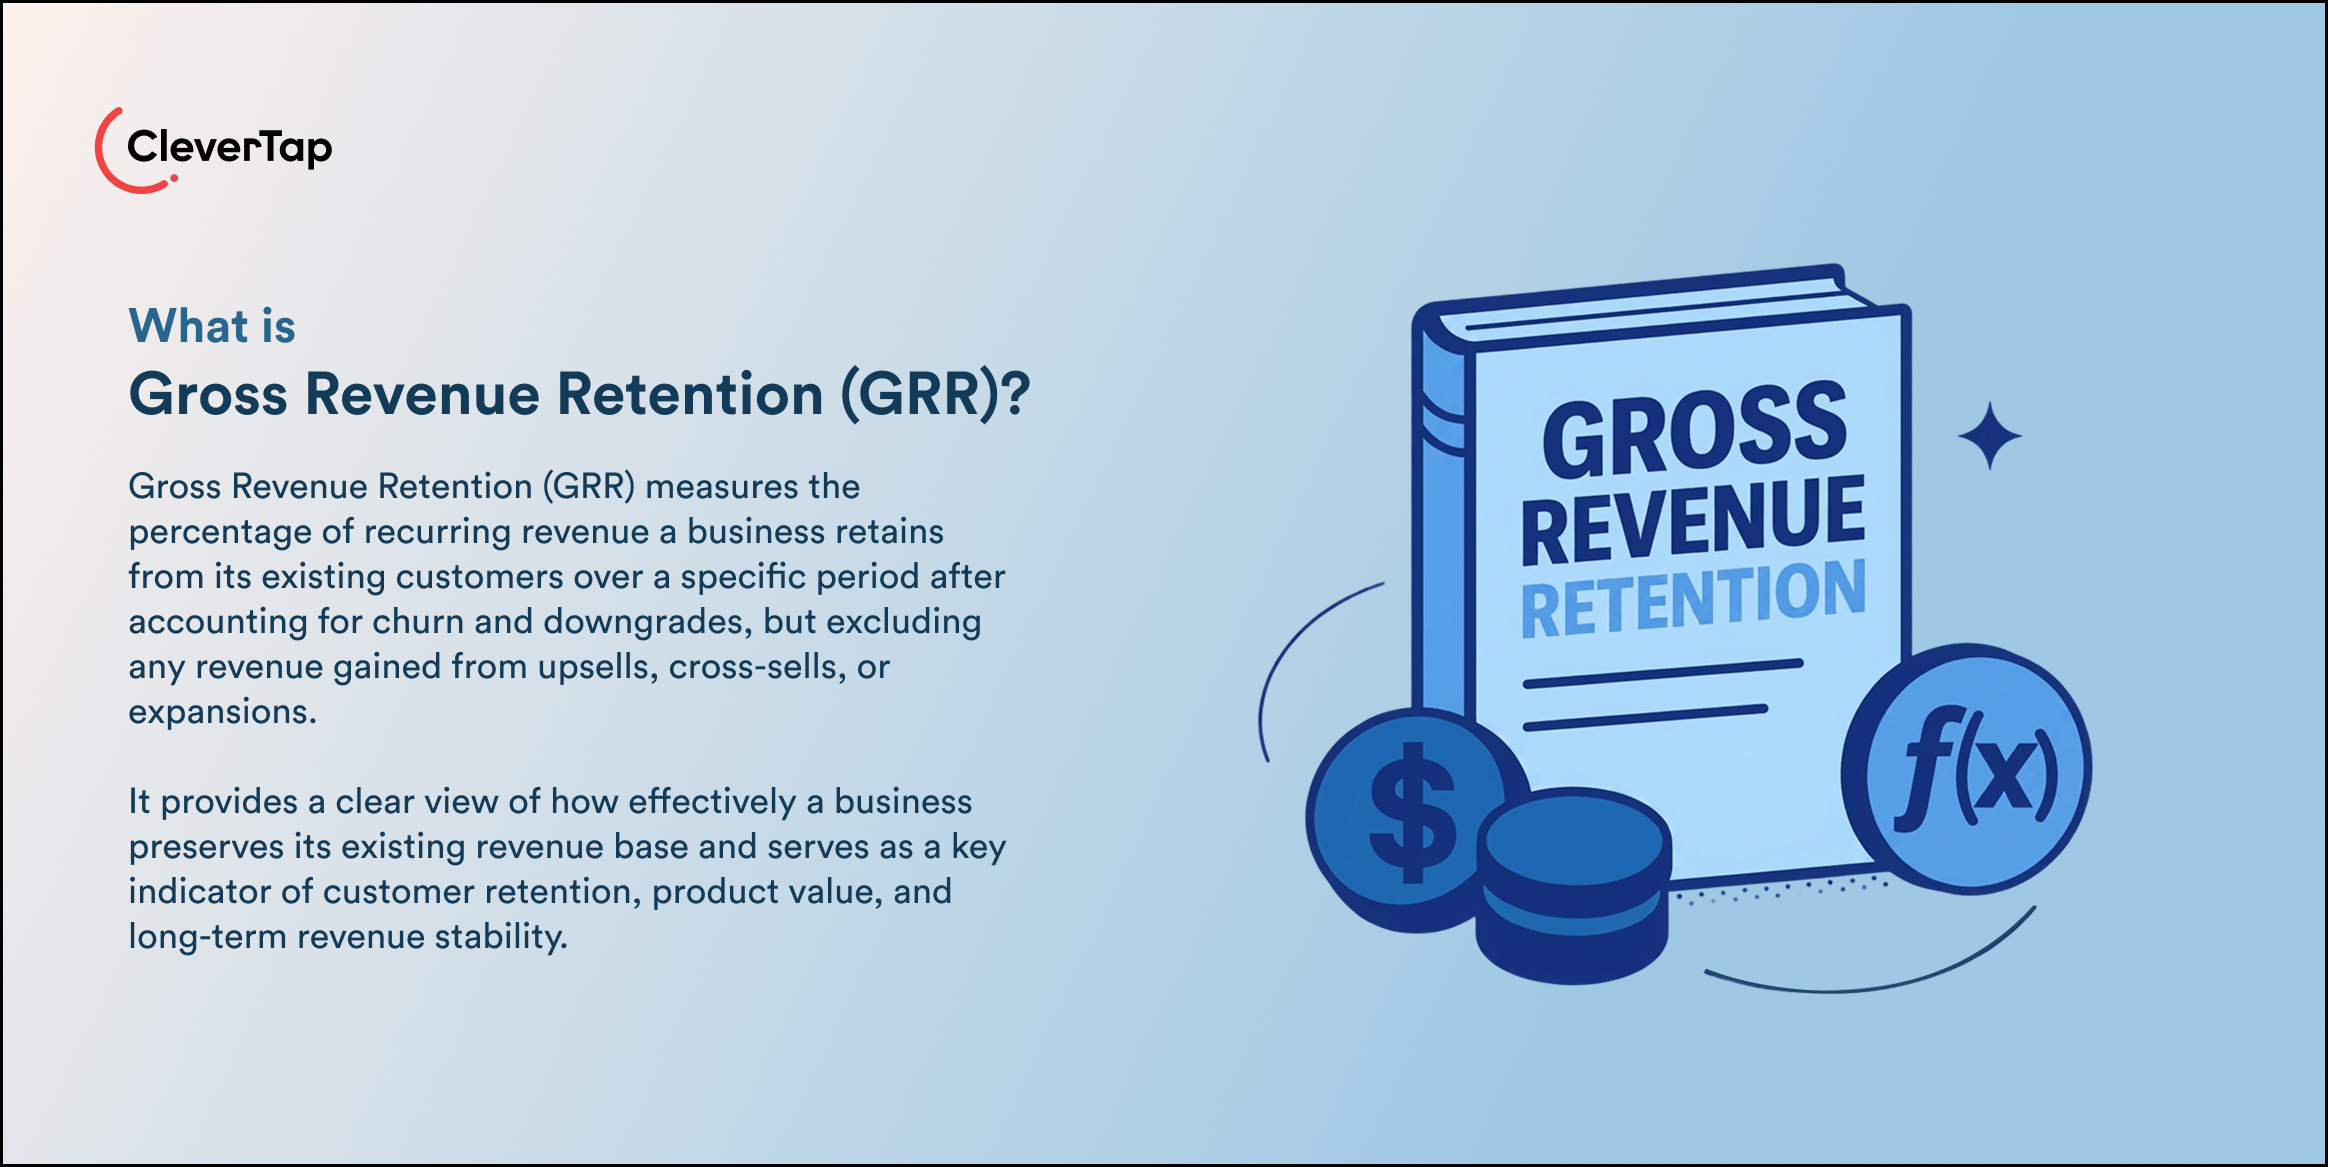
Gross Revenue Retention (GRR) measures the percentage of recurring revenue a business retains from its existing customer base over a set period, typically monthly or annually, excluding any expansion, upsell, or cross-sell revenue.
For subscription and recurring revenue businesses, GRR acts as a direct indicator of product health and customer satisfaction. It gives you a clear view of baseline financial stability by focusing purely on how well you’re preventing revenue leakage.
When GRR is high, it signals that your existing customers are consistently finding value in your product. When it slips, it’s usually a sign that churn or plan downgrades are quietly eroding your revenue base.
What makes gross revenue retention particularly valuable is what it leaves out. Excluding expansion revenue, it removes the flattering effect that upsells can have on retention numbers, giving growth teams an honest look at the true revenue impact of churn and downgrades. That makes it one of the most reliable signals of customer retention quality and long-term business viability.
Why Gross Revenue Retention Matters
GRR reveals how well a business preserves revenue from its existing customer base. While acquisition can temporarily mask high churn, a declining gross retention rate exposes the true stability of your core revenue foundation and signals that something needs fixing before you scale marketing spend or headcount.
For growth teams and product managers, GRR helps separate genuine retention health from surface-level revenue gains driven by new customer influx, giving you a clearer picture of where the business actually stands.
Here’s what consistent GRR tracking tells you:
- Revenue Preservation: How well your product protects its existing revenue base over time
- Churn and Contraction Bottlenecks: Where cancellations or plan downgrades are quietly causing financial leakage
- Product Value and Satisfaction: Whether customers continue finding meaningful value in their current tier
- Long-Term Financial Stability: How predictable your revenue runway is without relying on constant new acquisitions
This is exactly why investors and growth teams monitor GRR closely. It acts as a strong indicator of long-term revenue stability.
Gross Revenue Retention Formula
The gross revenue retention formula strips away all growth anomalies and isolates core retention. It relies entirely on your starting revenue baseline and the negative revenue events that occurred during that period, making it one of the cleanest ways to measure true revenue stability.
The formula is:
Gross Revenue Retention (GRR) =
((Starting RR − Churned Revenue − Contraction Revenue) / Starting RR) × 100
Here’s what each component means:
- Starting Recurring Revenue: The total MRR or ARR generated by your existing customer base at the beginning of the measurement period
- Churned Revenue: Recurring revenue was completely lost from customers who canceled their subscriptions during the period
- Contraction Revenue: Revenue lost from existing customers who downgraded to lower-priced tiers, reduced seats, or cut usage spend
One important distinction is that expansion revenue, such as upsells, cross-sells, or tier upgrades, is completely excluded from this formula. GRR measures pure revenue preservation, ensuring that growth numbers never mask underlying churn or contraction issues. That’s what makes it a more honest retention signal than most top-line metrics.
How to Calculate Gross Revenue Retention (Step-by-Step Guide)
Calculating your gross retention rate requires a methodical approach to auditing your recurring revenue streams. Breaking the process into sequential steps helps growth teams pinpoint exactly where revenue leakage is occurring.
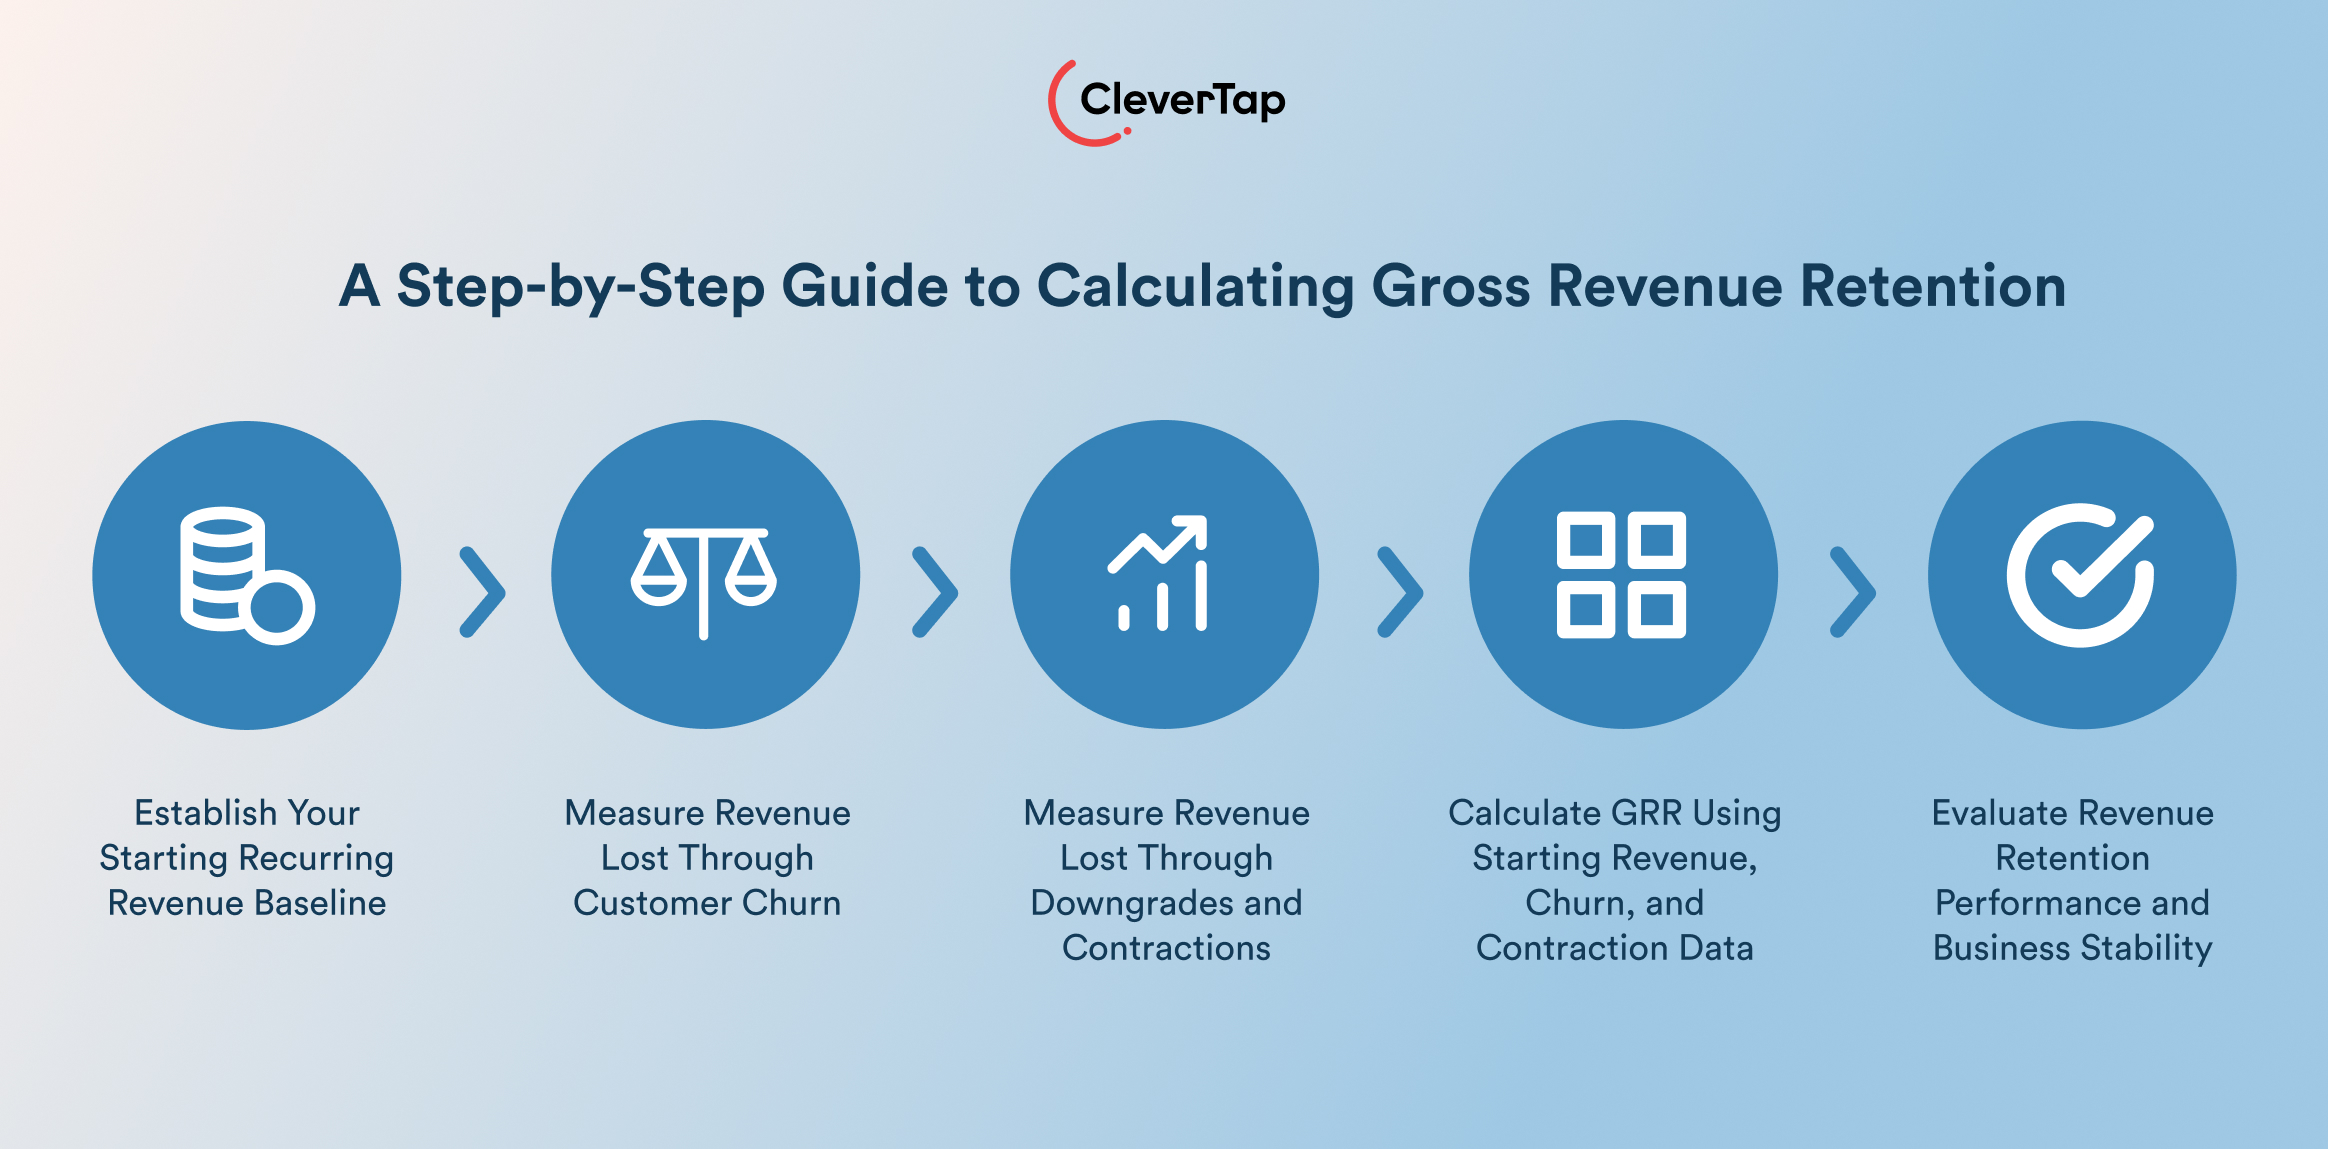
Step 1: Identify Starting Recurring Revenue
Begin by selecting your measurement period, like a month or a quarter. Then quantify the exact MRR or ARR generated by your active, paying customers on the first day of that period. This figure becomes your baseline cohort for the entire calculation.
Step 2: Calculate Churned Revenue
Audit your baseline cohort to identify complete cancellations. Sum up all recurring revenue lost from customers who terminated their accounts, failed to renew, or stopped using the platform entirely during the period.
Step 3: Calculate Contraction Revenue
Look at the remaining customers in that same cohort who reduced their spend without canceling. Aggregate revenue lost from plan downgrades, reduced seat counts, or lower usage tiers. Do not include any upgrades or expansions at this stage.
Step 4: Apply the GRR Formula
Subtract your total churned revenue and contraction revenue from your starting recurring revenue. Divide that figure by the starting recurring revenue, then multiply by 100 to get your final GRR percentage.
Step 5: Interpret the Final Percentage
A high GRR indicates a stable product foundation where customers consistently find value. A low GRR flags deeper issues, such as poor onboarding, product-market fit gaps, or pricing misalignment, that need addressing before you scale.
Gross Revenue Retention Examples
The following examples show how the GRR formula applies across three different recurring revenue models. The dollar figures used are illustrative, designed to make the math easy to follow. The churn and contraction mechanics, however, reflect how these businesses actually operate, and the final GRR percentages align with verified industry benchmarks for each model.
E-commerce Membership Example: Amazon Prime
In e-commerce membership programs, revenue contraction often happens when subscribers downgrade plans, pause memberships, or cancel due to perceived value gaps.
- Starting MRR: $300,000
- Churned MRR: $24,000
- Contraction MRR: $6,000
Formula:
GRR = (($300,000 − $24,000 − $6,000) / $300,000) × 100
GRR = 90%
A 90% gross retention rate indicates strong membership stability for an e-commerce business. Most subscribers continued seeing enough value in benefits like faster delivery, discounts, and loyalty rewards to maintain their memberships, though the remaining churn still signals room for stronger engagement and retention efforts.
Subscription Business Example: Spotify
Consumer subscription platforms typically see higher voluntary churn and tier transitions, driven by shifting household budgets and lifestyle changes.
- Starting MRR: $500,000
- Churned MRR: $75,000
- Contraction MRR: $25,000
Formula: GRR = (($500,000 − $75,000 − $25,000) / $500,000) × 100
GRR = 80%
An 80% gross retention rate is typical for B2C consumer platforms. It reflects predictable baseline health while pointing to a clear opportunity, targeted engagement campaigns to reduce voluntary churn before it compounds.
Membership Business Example: ClassPass
Fitness and wellness platforms navigate continuous monthly shifts as members adjust their routines seasonally or reduce commitment levels.
- Starting MRR: $100,000
- Churned MRR: $12,000
- Contraction MRR: $3,000
Formula: GRR = (($100,000 − $12,000 − $3,000) / $100,000) × 100
GRR = 85%
An 85% gross retention rate indicates stable core program adoption. The business can sustain operations at this level, but the 12% cancellation rate is a signal worth acting on, proactive reactivation and lifecycle engagement campaigns can move this number meaningfully.
What Is Included in Gross Revenue Retention?
To calculate GRR accurately, you need to isolate the components that represent pure revenue stability. There are no growth metrics, no new customer revenue, just the financial predictability generated by your existing customer base.
Three inputs make up the GRR calculation:
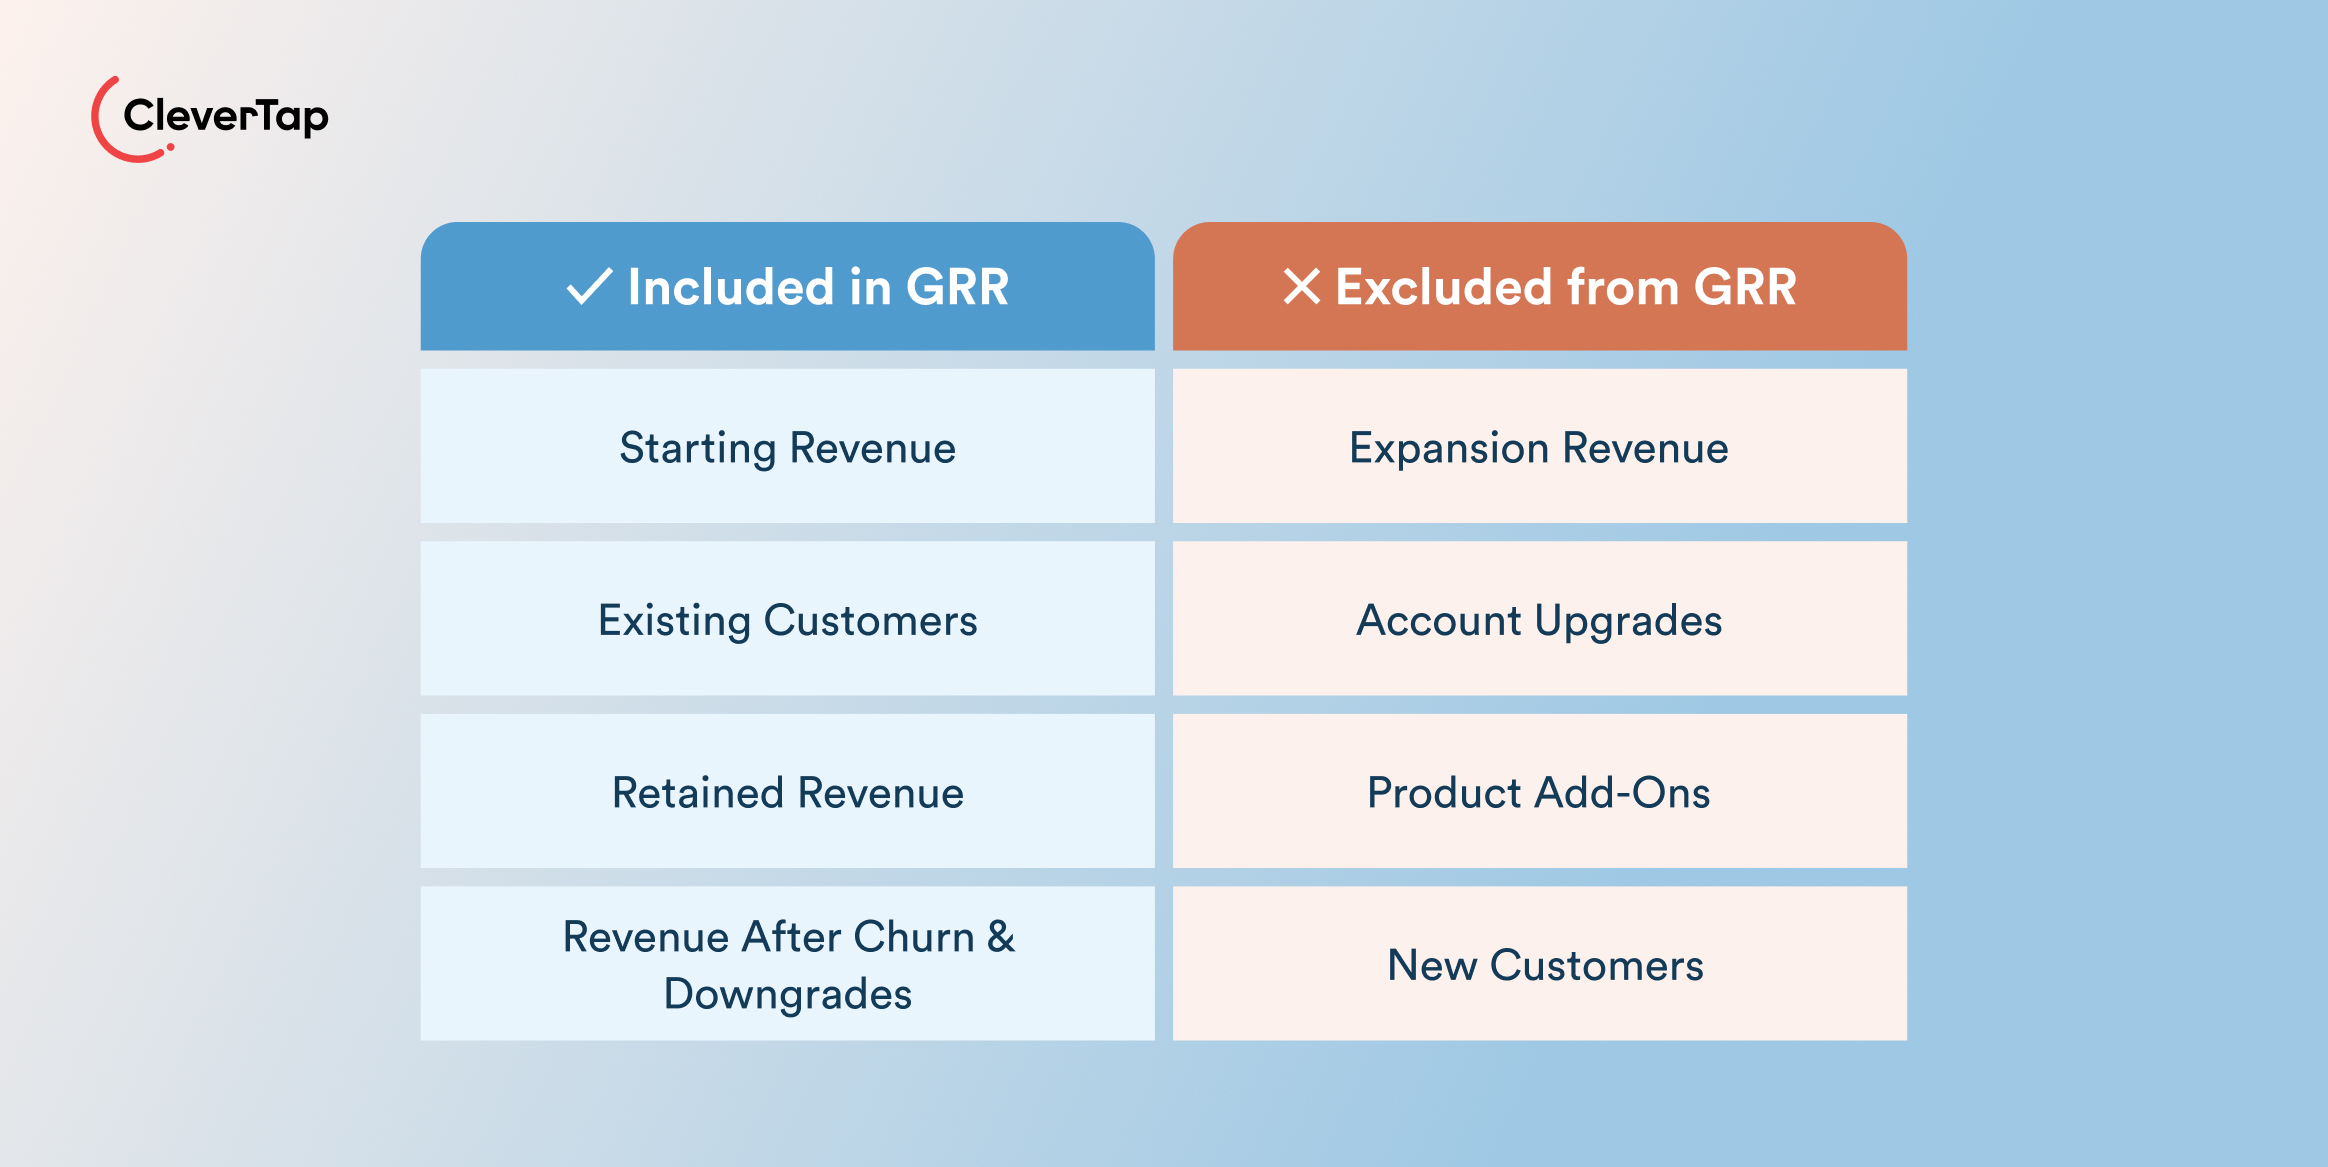
- Existing Recurring Revenue: The baseline MRR or ARR from your active customer base at the start of the measurement period
- Retained Subscription Revenue: The contract value from customers who kept their existing subscription tiers active and unchanged throughout the period
- Revenue Remaining After Attrition: The total revenue left after subtracting both complete cancellations and partial downgrades
Together, these inputs serve one purpose: measuring your business’s ability to preserve revenue from customers who were already with you on day one. No upsells, no new logos, no expansion, just an honest look at how much of your existing revenue base held firm.
What Is Not Included in Gross Revenue Retention?
To maintain the integrity of your GRR calculation, you need to strip out anything that signals growth or new acquisition. Mixing expansion revenue into the formula inflates the final percentage and masks the churn and contraction issues you actually need to see.
Four categories are excluded from GRR:
- Expansion Revenue: Any incremental revenue generated by your existing customer base during the measurement period
- Account Upsells: Revenue earned when a current subscriber upgrades to a higher-priced tier or increases their seat count
- Product Cross-Sells: Revenue from existing customers purchasing complementary add-ons or secondary modules
- New Customer Acquisition: Recurring contract value from brand-new customers who converted during the tracking cycle
Excluding these keeps your GRR percentage honest. It forces growth and product teams to confront actual churn and contraction numbers, without new sales or upsells softening the blow. If your GRR is slipping, no amount of expansion revenue should be allowed to hide it.
Gross Revenue Retention vs Net Revenue Retention
While GRR gives you an honest look at baseline revenue stability, Net Revenue Retention (NRR) shifts the lens toward overall cohort growth. The defining difference between the two comes down to one thing: how they treat expansion revenue.
| GRR | NRR | |
| Includes Expansion Revenue | No | Yes |
| Accounts for Churn | Yes | Yes |
| Accounts for Contraction | Yes | Yes |
| What It Measures | Pure revenue retention | Retention + expansion growth |
| Primary Use | Retention quality signal | Growth and monetization signal |
| Maximum Possible Value | 100% | Unlimited |
A simple example: A subscription brand starts the month with $100,000 in recurring revenue. During the period, they lose $10,000 to churn but generate $20,000 in expansion revenue from existing accounts.
- GRR = 90%, it flags that 10% of core revenue leaked away
- NRR = 110%, it shows that expansion more than offsets the loss
Both numbers are true. But only GRR tells you there’s a retention problem worth addressing. NRR can look healthy even when churn is quietly compounding, which is why tracking both metrics together gives you the full picture.
What Is a Good Gross Revenue Retention Rate?
A GRR of 90% or higher is generally considered strong across subscription and SaaS businesses. According to research, 90% is widely regarded as the baseline standard for enterprise platforms to maintain competitive parity.
That said, benchmarks shift depending on your business model and contract values:
| Segment | Median GRR Benchmark |
| Enterprise B2B | 95+ |
| Mid-Market B2B | ~92% |
| SMB / SaaS | ~90% |
| B2C Subscriptions | 75–80% |
A GRR below 80% is a warning sign, typically pointing to gaps in onboarding, product adoption, or core value delivery. More important than any single snapshot is the trend. A GRR that holds steady or climbs over consecutive quarters signals healthy product-market fit. A gradual decline, even from a strong baseline, is worth investigating before it compounds.
How Businesses Improve Gross Revenue Retention
Improving GRR requires a proactive strategy that addresses revenue leakage at every stage of the customer lifecycle. Since expansion revenue doesn’t factor into this metric, the focus has to be entirely on keeping existing customers engaged and successful on their current plans.

Here are five levers worth pulling:
- Optimize Onboarding: Guide new users to their first meaningful product win quickly; early drop-off is one of the biggest drivers of preventable churn.
- Drive Product Adoption: Run targeted feature education campaigns to ensure customers are using the full scope of their current plan, embedding your product into their daily workflows.
- Address Churn Drivers: Audit exit surveys and support interactions to identify recurring friction points. You need to fix systemic issues before they trigger more cancellations.
- Monitor Customer Health Signals: Track engagement signals like declining login frequency or dropping feature usage to flag at-risk accounts before they downgrade or churn.
- Deploy Proactive Engagement Campaigns: Don’t wait for renewal season. You need to set up automated outreach, value checkpoints, and milestone touchpoints that reinforce product utility year-round.
How CleverTap Helps Improve Gross Revenue Retention
CleverTap is an all-in-one customer engagement and retention platform that helps businesses understand user behavior, reduce churn, and build stronger long-term customer relationships across the lifecycle. It combines behavioral analytics, real-time segmentation, predictive insights, and omnichannel engagement to help growth and marketing teams identify revenue leakage early and take action before it impacts recurring revenue performance.
Identify High-Risk Customer Segments Early
CleverTap helps teams detect declining engagement before it turns into churn or downgrades. Using behavioral analytics, you can track signals like reduced session frequency, lower purchase activity, falling feature adoption, inactivity streaks, and declining campaign engagement across specific cohorts.
With RFM analysis and real-time customer segmentation, teams can isolate high-risk customer groups dynamically and trigger intervention campaigns before revenue contraction accelerates.
Build Personalized Retention Journeys
Retention often declines when engagement becomes generic or poorly timed. CleverTap allows marketers to create automated lifecycle journeys based on real-time user behavior, subscription milestones, inactivity windows, and product usage patterns.
For example, businesses can:
- Trigger onboarding journeys for inactive new users
- Re-engage dormant subscribers with personalized offers
- Send feature education campaigns to low-adoption cohorts
- Launch renewal reminder flows before subscription expiry
- Deliver loyalty and rewards messaging based on purchase behavior
These automated journeys help reinforce customer value consistently throughout the lifecycle.
Engage Customers Across Multiple Channels
Customers rarely engage through a single touchpoint. CleverTap enables businesses to run coordinated retention campaigns across push notifications, in-app messages, email, SMS, and WhatsApp from one platform.
Because campaigns are powered by live behavioral data, messaging stays contextual to each user’s activity, helping reduce disengagement caused by irrelevant outreach.
Use Predictive Analytics to Reduce Revenue Leakage
CleverTap’s predictive capabilities help teams move from reactive retention to proactive intervention. Predictive segmentation can identify users likely to churn, disengage, or reduce activity based on behavioral patterns and historical trends.
This allows teams to prioritize high-risk cohorts and launch targeted engagement campaigns before cancellations or downgrades impact recurring revenue performance.
Measure Retention Performance Over Time
Improving GRR requires continuous measurement. CleverTap’s analytics and cohort reporting help teams understand how retention campaigns influence long-term engagement, repeat usage, subscription stability, and customer lifespan.
By tracking behavioral trends across cohorts, businesses can identify where revenue leakage occurs, optimize lifecycle campaigns continuously, and improve long-term revenue stability more systematically.
Explore how CleverTap helps teams turn customer behavior insights into stronger retention and long-term revenue stability.
Conclusion
Gross Revenue Retention is one of the clearest indicators of revenue stability for recurring revenue businesses, measuring your absolute ability to preserve core capital without the masking effect of upsells.
While expansion metrics highlight growth velocity, GRR isolates foundational stability, exposing the exact financial toll of customer churn and contraction.
Tracking this metric accurately helps businesses scale on a more stable revenue foundation. Keeping your current subscriber cohorts engaged and active is the most efficient path to long-term profitability.
Looking to strengthen customer retention and improve long-term revenue stability? Schedule a demo with CleverTap today to uncover how advanced behavioral analytics can secure your retention goals.
Deliver Live 1:1 Personalization That Drives Higher Lifetime Value
Customer loyalty is built when engagement keeps pace with changing needs and behavior. With CleverTap’s AI-native Customer Retention Management Platform, powered by CleverAI™, you set the goals and guardrails while past context, live intent, and AI decisioning deliver Live 1:1 Personalization. Each outcome informs the next decision, helping curb churn, and maximize customer lifetime value.

Subharun Mukherjee 
Heads Cross-Functional Marketing.Expert in SaaS Product Marketing, CX & GTM strategies.
Free Customer Engagement Guides
Join our newsletter for actionable tips and proven strategies to grow your business and engage your customers.