


Table of Contents
Categories
Most Popular


Just like with any other marketing campaign, your mobile app needs constant monitoring to make sure it serves your brand consistently. If you’re not tracking objective key performance indicators (KPIs), how can you judge whether your campaign is a success? You might feel like you have a well-designed mobile app. But without the data to back it up, you’re just running on a hunch.
To see just how essential KPIs are for your business metrics, look no further than casual dating app disruptor HUD. HUD seeks to simplify dating for users who aren’t necessarily looking for a long-term relationship, but are still looking for casual, commitment-free interactions.
HUD ran into challenges tracking the success of their platform without clearly established KPIs, however. They needed to better understand who was using the app (via free trial or committed use), how much time they spent on it, and how to better optimize the service to help users get what they wanted. Without clear metrics—and a way to track them—marketers were essentially planning in the dark.
By partnering with CleverTap, HUD’s team had all the user data they needed right at their fingertips. “After exploring many options, we landed on CleverTap specifically because of the multitude of things we could do through the platform—be it user segmentation, messaging, tracking performance, or understanding users in real time,” says Marketing Director Mikayla Robinson. Since partnering with CleverTap to track and meet KPIs, HUD has seen a 20% increase in user retention!
You need to monitor a range of metrics to ensure your campaign is performing to expectations: acquisitions, activations, engagement, uninstalls, reachability—the list goes on. But in addition to the staples, consider these other mobile-specific KPIs that can further accelerate your mobile app’s success.
Mobile App Performance and UX Metrics
Your app doesn’t simply exist in a vacuum. There are real people on the other end who are using it every day (or at least, that’s the goal). Use these metrics to establish an objective understanding of their user experience.
Retention Rate
Your retention rate indicates how many people continue using your mobile app over time. Essentially, the larger your retention rate, the greater your individual user value. Depending on your vertical of business, different milestones will have different meanings and impacts—but regardless of what those goals are, tracking retention overall can still provide meaningful insight into your business sustainability.
Measure your retention rate with this simple formula: (users that log in at least once per day) / (total installations within a given time frame).
Once you have a basic understanding of your retention rate, you can take steps to improve it. Consider adapting your message to better address consumer needs, A/B testing your product, and paying particularly close attention to the onboarding process once someone first downloads your app.
Use our retention rate calculator to measure your own retention rate
Churn Rate
Users who stop using your mobile app can be filed as churn. Certain users completely uninstall the app; in other cases, they simply don’t log into the app. Regardless, this rate is an important indicator of app success—and what changes you may need to make.
Churn rate also has a direct correlation with your company’s bottom line. The higher the churn rate, the higher your acquisition costs. In-app event tracking can help determine exactly when a churn starts to happen, providing valuable insights into your user roadmap.

How to calculate churn rate
Daily and Monthly Active Users
Many customers will live somewhere in the space between outright churn and dedicated use. They’ll vary in frequency—some may be daily users, others perhaps sign in less frequently. Tracking data across all these users can provide valuable and varied insights for your business. How does your mobile app address the needs of various consumer profiles?
Define your own Daily Active User (DAU) or Monthly Active Users (MAU) metrics, as they may look different for every business. Once you decide how your organization classifies these varieties of active users, you can explore different data ranges and frequencies accordingly.

What are DAUs?
Overall, DAU and MAU can provide insights into your profitability and business forecast. If you have a growing number of active, loyal users who are interacting and logging in at multiple touchpoints throughout the day, it’s indicative that your business is on the right track.
Here at CleverTap, however, we believe that MAU is an overrated metric and is not a reliable indicator of growth or success. Better alternatives are: CLTV (which we tackle below), monthly retention rates, and your key conversion rates.
Average Session Length
You’re tracking how often users sign in, but you also want to know how long they stay in per visit. Calculate average session length with the following formula: (user’s total session length) / (number of launches in session).
Many marketers will take this a step further, segmenting by demographic data such as the type of device used, among other user factors.
A low session length could indicate a problem—and potentially a high drop rate. If you have a high rate of users logging on, but they don’t stay on long enough to be beneficial for business, this could indicate a problem with the user experience. Use these insights to further enhance app products and services and produce better ROI in the future.
The average session length in Q1 of 2022 was 19.1 minutes according to research by Adjust.
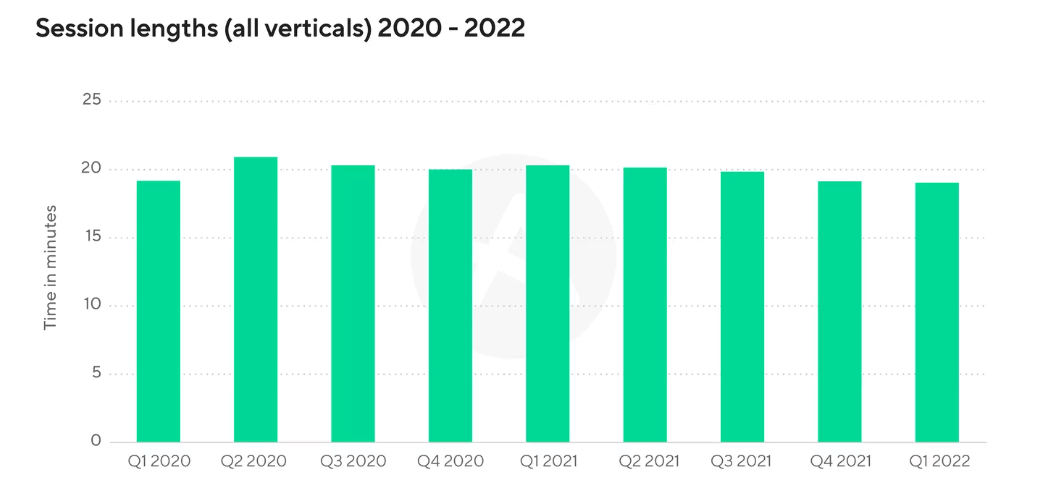
The average app session length from 2020-2022. Image from: Adjust
Mobile App Revenue KPIs
In addition to mobile app performance and UX metrics, tracking certain revenue-based KPIs like CLV, ARPU, and conversion rates can take your business analysis even further. Understanding the correlation between UX and revenue KPIs helps you refine the two in tandem, building a more cohesive operation overall.
Customer Lifetime Value (CLV)
Every customer is important—but how can you effectively assess how important they are? Evaluating customer lifetime value will tell you just how much each customer contributes to your bottom line over the course of their mobile app usage—including everything from in-app purchases, in-app advertising, and subscriptions.
CLV can help determine if you are spending too much (or too little) on advertising. For example, perhaps the amount you spend to recruit each user simply isn’t balanced out by app services and purchases. It can also help you better segment and personalize your marketing approaches, catering to customers with higher CLV to increase ROI
Calculate CLV (or CLTV) with this formula: (average purchase size) x (number of purchases) x (transaction period). Or simply use our online CLTV Calculator.
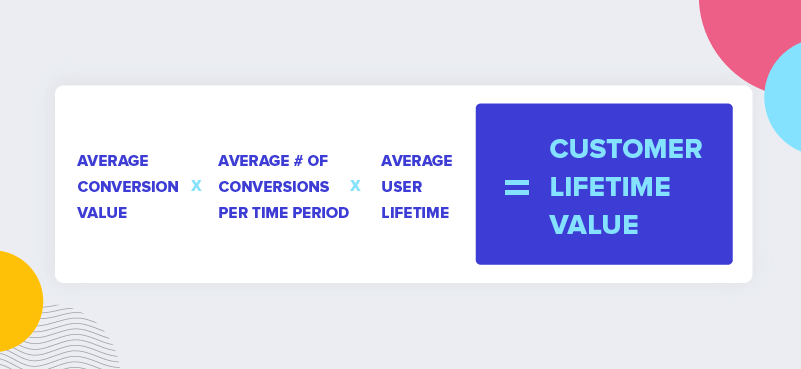
Formula for calculating CLTV.
Average Revenue Per User (ARPU)
Tracking the average revenue generated per user in your mobile app can add further context to your marketing decisions and pricing strategies. Divide the total revenue within a specific time frame by the number of active users in that time to assess ARPU.
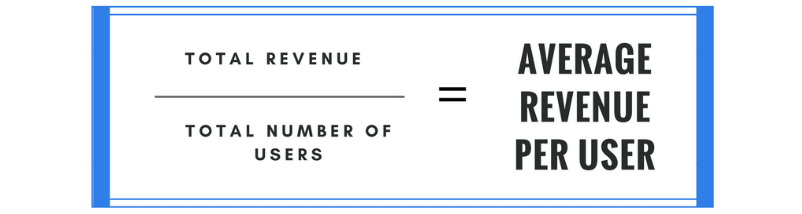
Formula for calculating ARPU.
Mobile Conversion Rate
Just like with website conversion, it’s important to track your mobile app conversion rate. How else will you know the exact benefit of this option? How you choose to track conversion is up to you—some may choose to track installations, others might prefer purchases, for example. But the point is to intimately understand just how customers participate in and interact with your mobile app.
Overall, your company’s conversion rate will depend on your business model’s individual goals regarding a specific element of conversion—there’s no fixed “perfect” number. But this metric can provide key UX insights, as well as pinpointing conversion moments in the sales life cycle. Track conversion rates to access more touchpoints across the customer journey.
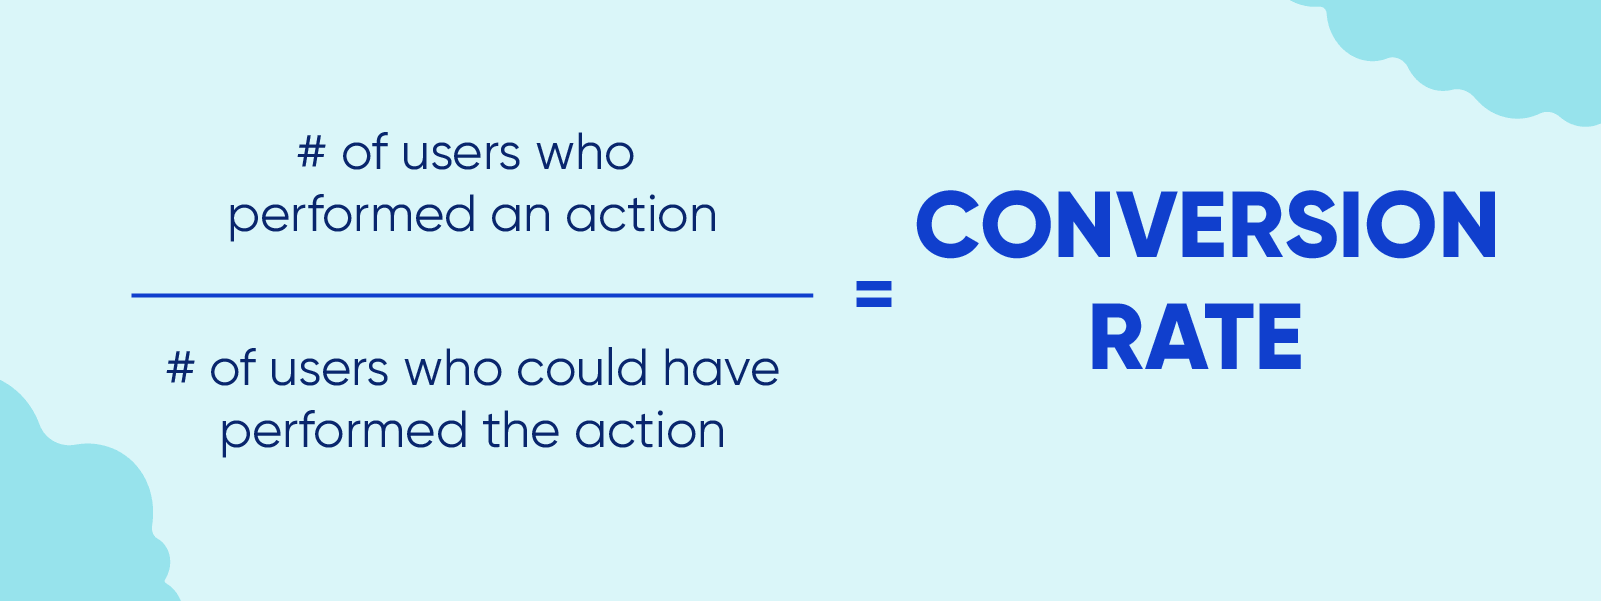
Formula for calculating conversion rate.
Track Your KPIs for Better User Experiences—and a Better Bottom Line!
As with any journey, to achieve the sales goals you want, you have to know where you’re starting from. Mobile apps bring you into contact with a whole new set of consumers—but you need to assess the data you glean as with any other channel. Tracking KPIs like the ones listed here will give you a comprehensive, nuanced view of the role your mobile app plays in your overall strategy.
However, collecting relevant behavioral analytics for app optimization is time-consuming to set up and often requires more than one system — resources that startup app developers don’t always have. That’s where CleverTap comes in. From customizable metric tracking to A/B testing, comprehensive reports, and more, CleverTap has an analytic solution to boost your business and a built-in engagement component as well.
If you want to learn more about how you can receive reliable, real-time insights into your app performance and engage your audience, don’t forget to check out and subscribe to our blog.

Subharun Mukherjee 
Heads Cross-Functional Marketing.Expert in SaaS Product Marketing, CX & GTM strategies.
Free Customer Engagement Guides
Join our newsletter for actionable tips and proven strategies to grow your business and engage your customers.
