One of the most important metrics that mobile marketers work for is to increase their app’s conversion rates.
Whether that translates to installs or purchases is up to each brand, but the idea is the same: get the prospect through a funnel, get them to complete an action that converts them into a paying customer or a lead. And measure that number assiduously.
This will inevitably lead you and other mobile marketers to ask: “What’s the best conversion rate for mobile app downloads?” And: “What is a good conversion rate vs. an average conversion rate?” Or even: “What are some benchmarks for my app category and industry?”
But what if we told you there’s an even better KPI to track for measuring growth?
What if, instead of mobile app conversion rates that you can find on a dozen other websites, we hand you a unique formula that no one talks about, but which we’ve proved works to predict success?
We’ll give you that unique KPI. Then explain what app conversion rates are, show you industry benchmarks, and explain why these rates aren’t good enough on their own to predict your app’s revenue and growth.
CAC-to-Conversion Rate: Because Acquisition Metrics Can’t Stand Alone
So this is it — the magic formula. We’ve used this unique KPI and seen it lead to success with our customers as well as in our own efforts to grow.
We call it the CAC-to-Conversion Rate. CAC, as you might recall, is customer acquisition cost, or how much you spend to acquire a new customer.
Typically, when we mobile marketers talk about CAC, we’re talking about CAC-to-Install, or how much it costs to acquire a user who installs our app. Unfortunately, that cost is really controlled by the marketplaces – Google, Facebook, etc. – since you have no direct control over the bidding rates for ad keywords. But if you can break down CAC into phases that make sense to your business, then you have 2 key metrics that you can influence.
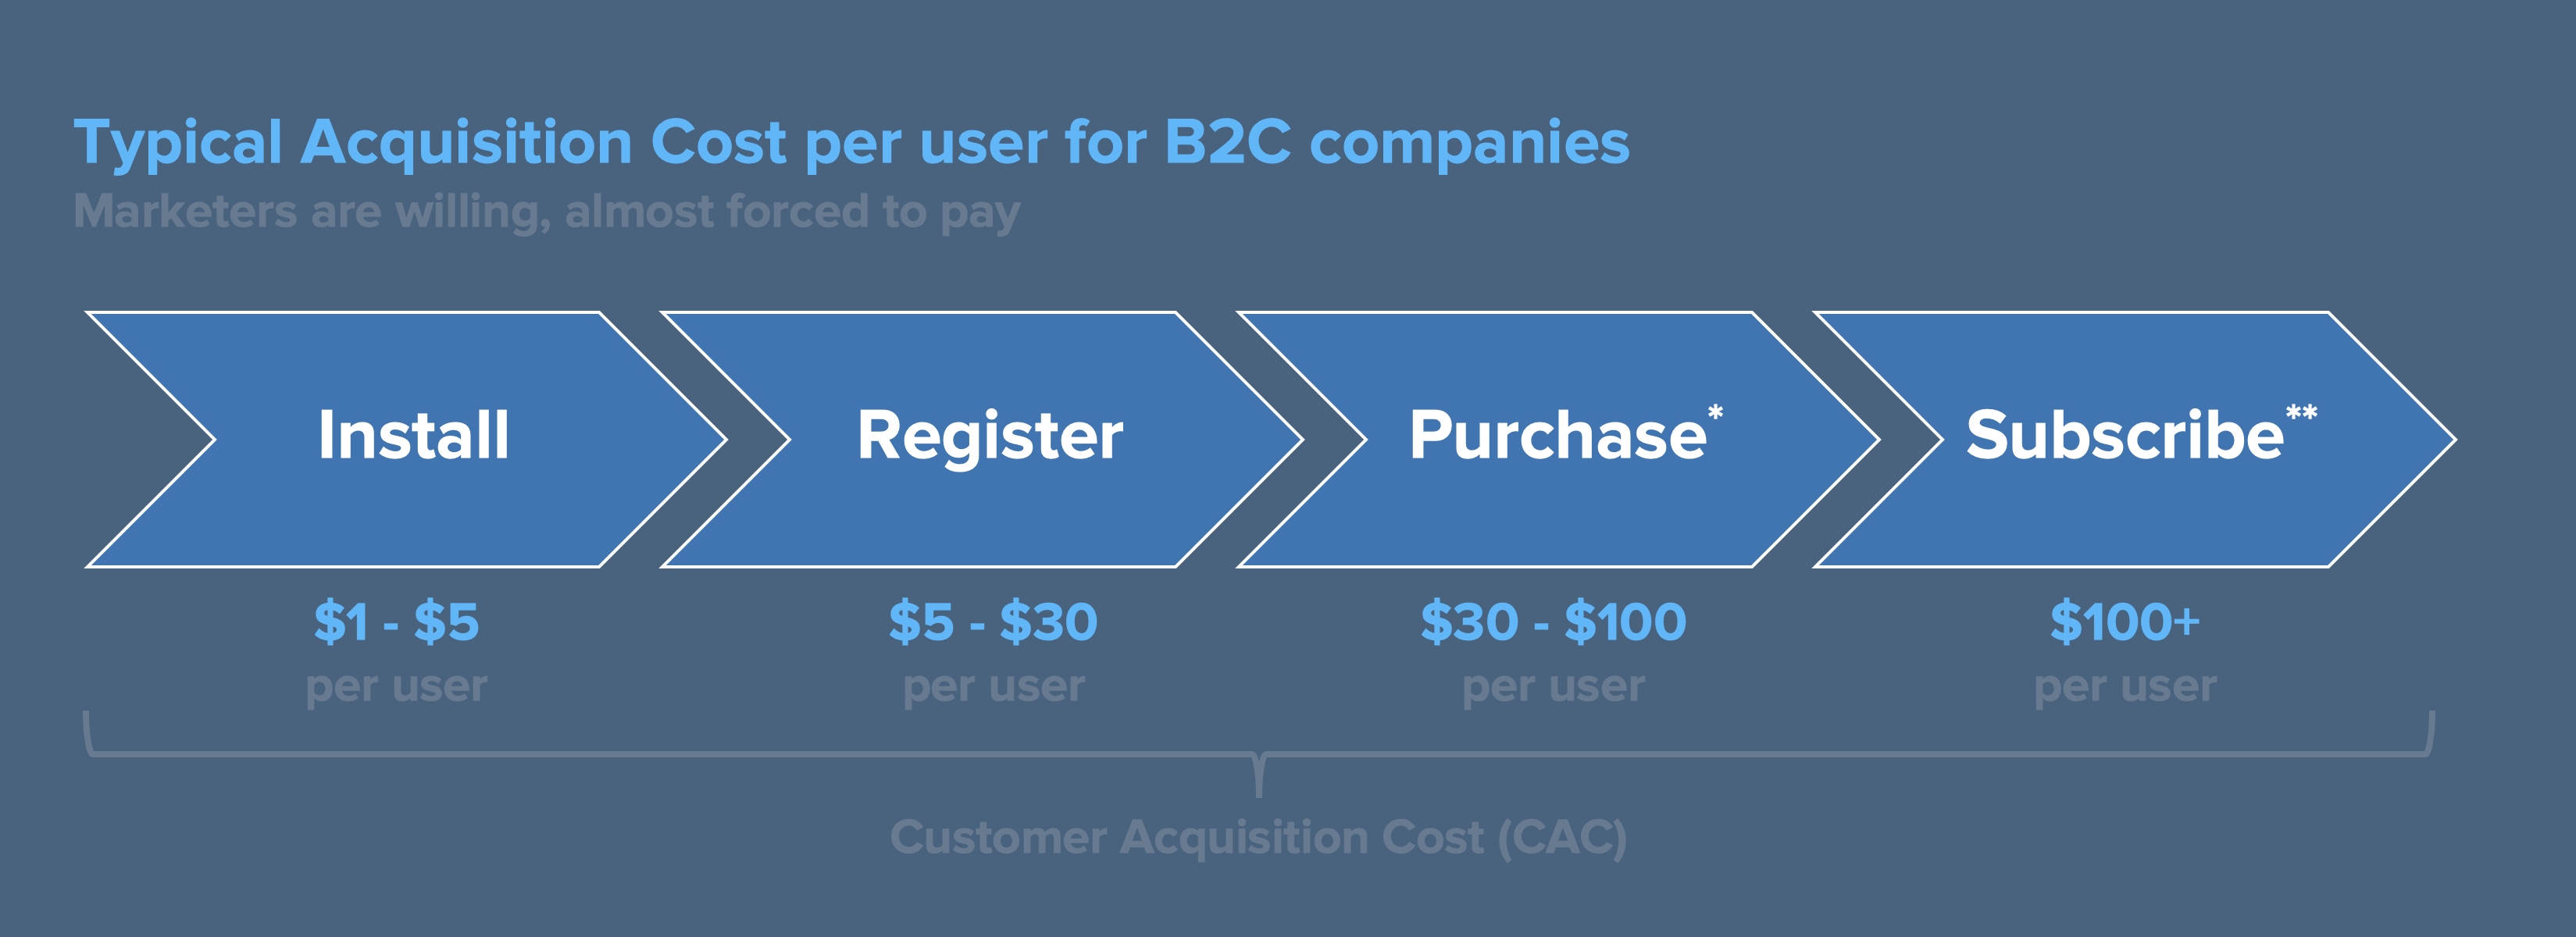
Here are typical acquisition costs per user for B2C apps:
- CAC-to-Install: $1- $5 per user. This range exists because of differences in verticals. For example, an ecommerce app is much more competitive and would cost more to bid for, so you pay more to acquire users. This metric is largely out of your control as it’s set by the marketplaces.
- CAC-to-Register: $5 – $30 per user. Only a small percentage of your installed users go on to register (i.e. give you their email, name, or social login).
- CAC-to-Conversion: For apps that deal in purchases, it costs $30 – $100 to acquire a new user. For apps that deal in subscriptions, it costs $100+ to acquire a new user. (Non-subscription services should use Repeat Purchases or LTV as an equivalent metric.) For simplicity’s sake, we group Purchase and Subscribe under one umbrella as the conversion event.
Again, only a small percentage of those who register actually convert and give you their money. Yet this is the KPI that you should be tracking no matter what your business is.
By breaking CAC down into CAC-to-Install, CAC-to-Register, and CAC-to-Conversion phases, you can focus on the last two metrics that you can directly impact and improve.
Why is this so vital? Because conversions shouldn’t stop once a user installs your app!
Conversion Rate Definition, By the Book
Here’s a conversion rate definition so we know exactly what it means.
According to our very own Mobile Marketing Glossary, a conversion rate is the percentage of your mobile app users who accomplish an action that fulfills a desired business objective. You calculate this rate by taking the number of people who completed the desired action, dividing that by the overall size of your audience, and then expressing that number as a percentage.
Here’s an example: The goal with your shopping app is to increase purchases for the month so you send a “free shipping” promo code via push notification to all 8,000 users. When 400 users use that promo code, you have a conversion rate of 5% for your “free shipping” campaign.
How to Define “Conversion” for Your App
Just know that the sheer number of possible conversion events makes it tricky to discuss conversion rates without first clarifying: “What will this conversion result in, exactly?”
In the most common usage of the term among mobile marketers, it will probably be one of the following:
- An install: The user converted by downloading and installing your app from the app store.
- A registration: A user converted by giving you their email address, username, and password, or a social network login
- A purchase/subscription: A user converted by buying or subscribing to your service. This is also the most common understanding of the term “conversion” between marketers.
But, depending on what your app does, it could refer to one of the sample conversion events below:
App Category Conversion Events
| Travel | Itinerary saved, Flight booked, flight check in, flight schedule checked |
| Media & Entertainment | Content viewed, content rated, content purchased, user subscribed |
| Food Tech | Order purchased, food reviewed, restaurant subscribed to |
| eCommerce | Item viewed, item added to cart, checkout started, checkout completed |
| Social Network | Contacts added, content posted, comments made |
Why Should You Care About Conversion Rates?
There are several good reasons you should care about the mobile app conversion rate metric:
- Increased conversion rates mean better ROI.
When you optimize for a higher conversion rate, you’re being smarter with your marketing spend, allowing you to get better results without increasing the budget. - Good conversion rates show that your marketing is effective.
Good conversion rates indicate that users want what you’re offering and are willing to click, buy, or sign up. This means you probably have a good handle on user pain points and what needs to be communicated in order to encourage them to act. - Focusing on conversion rates lowers overall CAC.
One way to prioritize your conversion rates is to drive more revenue from existing customers. And this effort can significantly lower CAC.Since it’s 5x to 16x more expensive to convert a new user than it is to nurture the loyalty and repeat purchases of an existing customer. This could equal huge savings in customer acquisition costs.

From App Store to Download: The App Install Rate
Here’s the most common type of conversion rate that marketers monitor: app store page conversion rate. Basically this measures how many people install an app after landing on your app store page. It’s measured by dividing the number of app downloads by the number of app page views or impressions, and expressing it as a percentage.
Below are just a few app categories and their average conversion rates from November 2018.**
App Category Avg. App Store Page Conversion Rate (App Units/Impressions)
| Travel | 11.8% |
| Shopping | 8.1% |
| Social Networking | 6.9% |
| Entertainment | 6.9% |
| Health & Fitness | 5.9% |
| Education | 5.4% |
| Games | 3.5% |
| Music | 1.3% |
Remember that your control over your CAC-to-Install rate is very small. The marketplace sets the price for keywords and the amount of competition for keywords will depend on your category. But what you can control at this stage is App Store Optimization.
If your app store page conversion rate is low, it means you must focus on improving your app store optimization (ASO) efforts via proper usage of keywords, better images or icons, informative descriptions, more social proof, etc. Oftentimes, this page is a user’s first contact with your app and any improvements you can make can affect whether they go on to install.
Check out our article on app store optimization tips.
From Download to Purchase: The Average Conversion Rate
You’re probably asking: “Is there a single, average conversion rate that can be used as a benchmark for my app?”
The challenge here is that every app and industry will have varying conversion events and thus varying rates. Using a single conversion rate for everyone won’t be realistic because objectives will vary depending on your app category and your target market.
Sifting through the data across marketing websites, analyst studies, and even our own experience with our customers, the majority of marketers agree that most mobile apps have a 1-2% average conversion rate. That means, on average, just 2 people out of every 100 app installs will make a purchase.**
Of course there are exceptions. For example, we’re working with a gaming app whose conversion rate (from install to purchase) is at a healthy 7%. Another customer is a music app with an average conversion rate of 12% (from install to subscription) over the past year.
To get another view of these numbers, consider the average ecommerce conversion rate. The 2017 ecommerce report by Wolfgang Digital found that the overall ecommerce conversion rate was 1.56%.** And while this number is not about apps or installs, it does offer us very similar numbers.
Type of eCommerce Avg. Conversion Rate
| Overall | 1.56% |
| Travel | 2.42% |
| Online only retail | 1.81% |
| Retail | 1.39% |
| Multichannel | 1.20% |
Why CAC-to-Conversion is Better Than Simply Measuring Your App Conversion Rate
This brings us all the way back to the KPI mentioned at the beginning of the post.
Other websites will offer up their researched numbers and say mobile app conversion rates are essential metrics. And of course we agree with that.
But what we’re saying is that they’re lackluster if you use them alone. Instead, support them with your CAC-to-Conversion rate. Here’s why:
- Growth depends on acquiring the right type of customers.
- CAC better measures how much it’s costing you to acquire a new customer who will pay for your product or service.
- CAC-to-Conversion is a metric that you can directly improve. By lowering this rate, you get better ROI.
- Conversion doesn’t stop once a user installs your app. You can continue to upsell, cross-sell, and encourage your users to make repeat purchases and renew subscriptions.
Conclusion
In the end, app conversion rates will always be crucial as mobile marketers and brands work to drive more revenue from their user base.
Just be sure you understand what conversion really means to you, and track the right conversion metrics that match your business goals, including:
- Average Conversion Rate (install to purchase)
- App Store Page Conversion Rate or App Install Rate
- CAC-to-Conversion Rate
Read More About Conversion Rates and Metrics
- What CMOs Want: The Mobile Marketing Metrics Executives Actually Care About
- The Definitive Guide to Mobile App Metrics
- App Store Optimization + Ranking Factors

Metrics That Matter for Growth: A Handbook for Mobile Marketers
Shivkumar M 
Head Product Launches, Adoption, & Evangelism.Expert in cross channel marketing strategies & platforms.
Free Customer Engagement Guides
Join our newsletter for actionable tips and proven strategies to grow your business and engage your customers.


