Learn how you can Unlock Limitless Customer Lifetime Value with CleverTap’s All-in-One Customer Engagement Platform.

If you’re overwhelmed by mobile app metrics, you’re not alone.
All the data in the world won’t help you grow your mobile app unless you know how to interpret and apply it.
The good news?
Mobile ROI doesn’t have to be complicated. With the right mobile app metrics in place, identifying problems and solutions can be painless.


You can’t grow your mobile app if you don’t win over new users — and you can’t win over new users if you don’t understand where current users come from. That means tracking downloads and attributing them to specific acquisition channels.
Let’s say $5,000 on Google AdWords nets you 125 downloads over 3 weeks. But the same investment on the Google Play Store gets 10x that in 3 days. Daily download and attribution tracking shows you where to invest your marketing resources so you can meet lofty download goals in record time.
Convert Web Visitors into Mobile Users. Encourage web visitors to download your app by adding a “Download the App” button and offering incentives like loyalty points or a discount on their first in-app purchase.
Launch a Referral Program. According to a study conducted by Nielsen,1 92% of people trust referrals from friends.
By incentivizing current users to recommend it, you can rapidly expand your user base and provide powerful social proof to prospective users. Companies like Airbnb and Uber turn mutual incentives into powerful customer acquisition engines.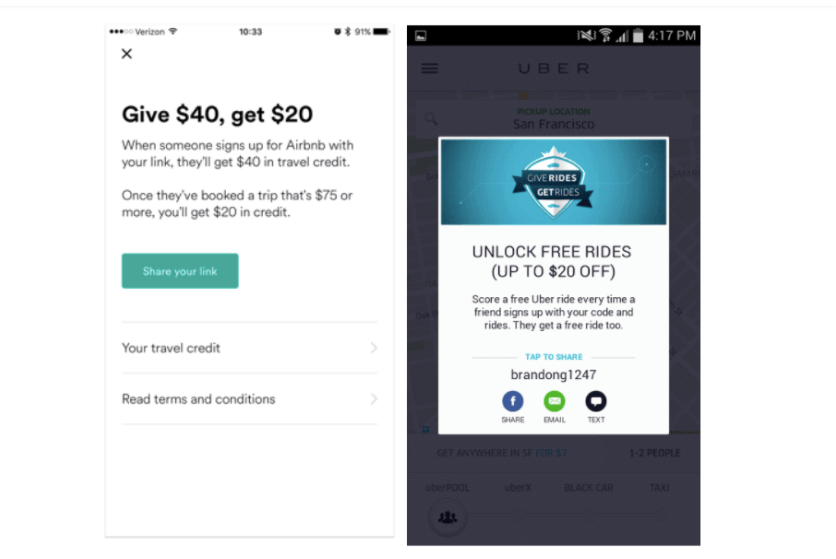
Images: Airbnb, Uber
Effective App Store Optimization. Higher search rankings mean better chances of getting featured, better visibility, and more downloads. Include search keywords in your listing’s main title, spotlight your app’s main features and benefits in the app description, add eye-catching screenshots of the UI, and include the version and date of last update. Users are more likely to download an app that’s actively maintained and adding new features.
If your activation rate is 85% or above, you’re in great shape. Anything lower calls for a deeper analysis to identify and fix activation issues.
Rule out:
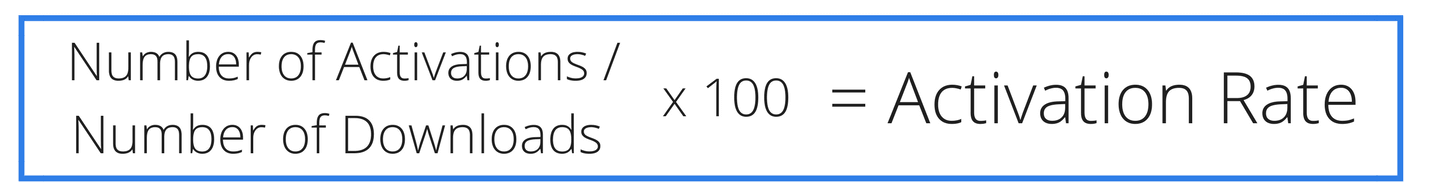
If we had 300 activations and 500 downloads this week, our activation rate would be 60%. Not too shabby, but room for improvement.
Create onboarding materials. Send an email or push notification campaign highlighting your app’s main benefits or key features.
Incentivize activation. To boost its Kindle app user base, Amazon offered existing customers a $5 credit for signing in to the Kindle app.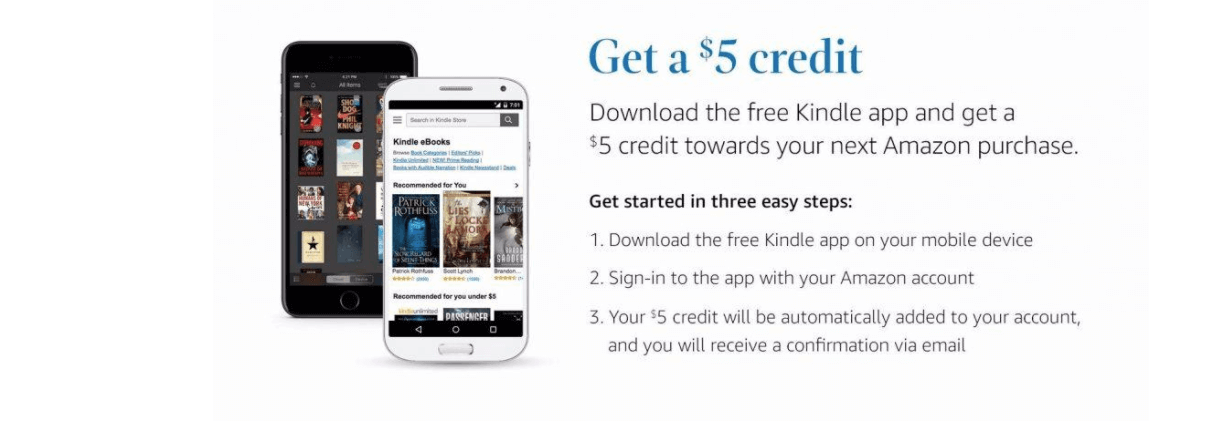
Image: Amazon
Offer in-app exclusives. This could include specialized content or early access to new features and products.
Improving retention rates by 5% can boost your profitability 25 – 95%.2
But keeping mobile app users engaged isn’t easy. The average app loses over 77% of its daily active users (DAUs) within 3 days after install.
So how can you keep users coming back to your app? Get actionable user data by tracking retention cohorts.
Instead of lumping all your users into one bucket, breaking them into cohorts and tracking their behavior over time can give you valuable insights into onboarding flows, user experience, and product/market fit.
Customer Lifetime Value
This is the monetary value a customer has netted you to date. This data can help you build tiered loyalty programs to retain your most valuable customers.
To ensure your app stays profitable, LTV needs to eventually exceed Cost Per Acquisition.
For an easy way to calculate LTV or CLTV, use our Customer Lifetime Value Calculator.
Ask for User Feedback. Requesting feedback is the best way to identify and fix friction points before users ditch your app. Ask for feedback (and include contact information) in your release notes, and feature a feedback button in your app. 1 Second Everyday and Zomato do a great job of this: 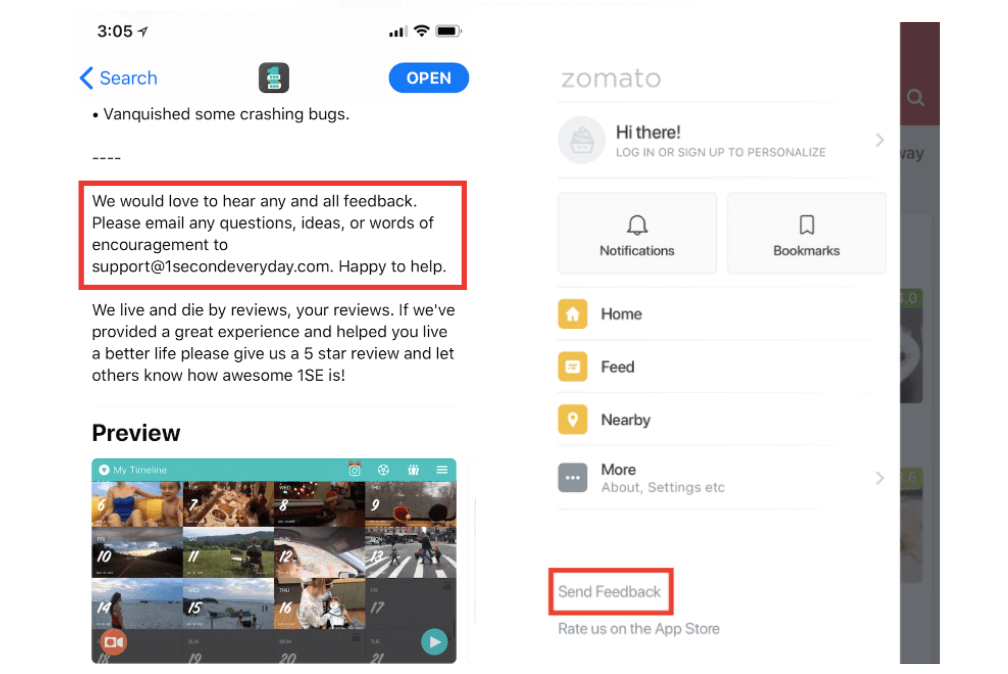
Images: 1 Second Everyday on the App Store, Zomato
Deliver loyalty perks. Reward points, special discounts, and exclusive access give users a reason to keep visiting your app. 
Image: Camp Gladiator on Facebook
Add new features and content. Camp Gladiator’s new CG Fit feature tracks physical changes workouts produce and suggests meal plans.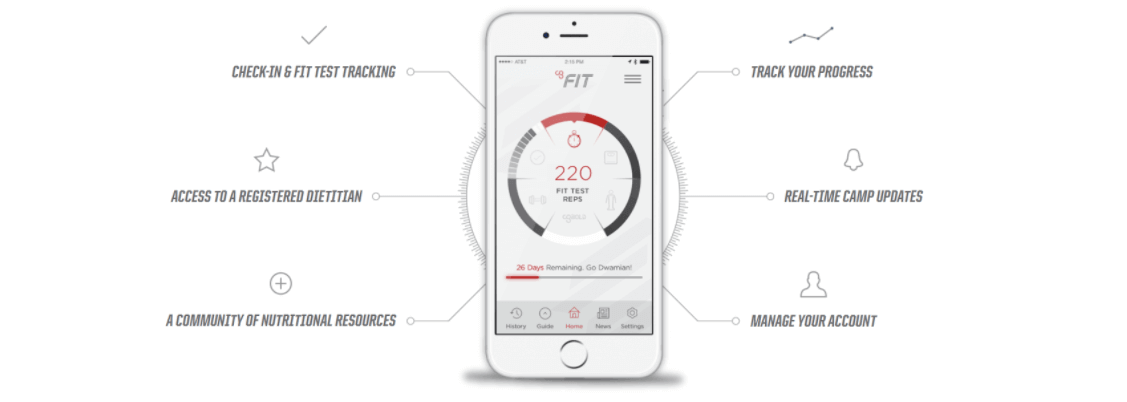
These are just a few ideas to get your retention engine revving. For more, check out this comprehensive Guide to User Retention.
Multiple studies confirm a strong link between engaged users and revenue growth.3 Put simply, engaged users buy more.
Sadly, half of all apps are used just 10 times before they’re abandoned.4
How you track engagement will depend on how frequently users are meant to engage with your app, but here are a few user engagement metrics to consider:
Use this data to calculate your app’s stickiness.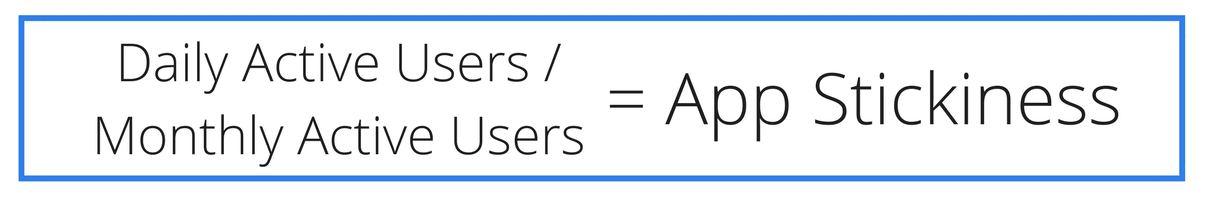
If you have 3,000 DAU and 9,000 MAU in the month of June, your stickiness ratio is 33%.
Send a friendly push notification. A simple abandoned cart reminder5 can improve conversion rates by as much as 29%.6
Retrace your steps. If a cohort has an abnormally low retention rate, follow the data. Where did you lose them, and how did you win them over in the first place?
Something as simple as discount codes, new features, or bug fixes can do the trick. A tool like Flows can show you exactly where people are engaging more with your app or dropping off.
Conversions are the holy grail of marketing. 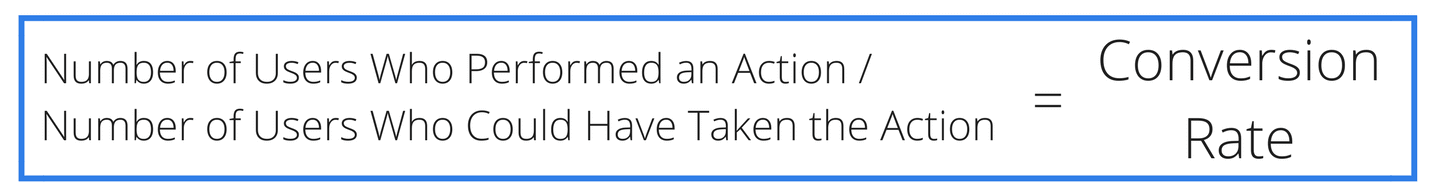
Say you sent a 10% off push notification to 8,000 users. If 400 of them used the discount code, your conversion rate would be 5%.
Tracking conversion rates tells you which messages are moving your sales needle. Once you have a baseline, you can run A/B tests to optimize and find messaging that resonates with your users.
First ask yourself: what types of conversions are important for your business? Purchases? Subscriptions? Ad impressions?
Think like a user. Pretend you’ve launched your app for the first time. What annoys you or slows you down? Make moving through the funnel as easy as possible. Remove unnecessary buttons or links, simplify your registration process, and streamline your UI.
Look for unexpected drop-offs. It’s common to see users drop out of the checkout process when it’s time to enter credit card details. But if you’re seeing an unusual drop off where users add their shipping address, there could be a UI issue or bug that’s causing problems or preventing users from moving to the next step.
Even the best apps don’t retain 100% of their users. Most app owners lose 80% of new users in the first 90 days.7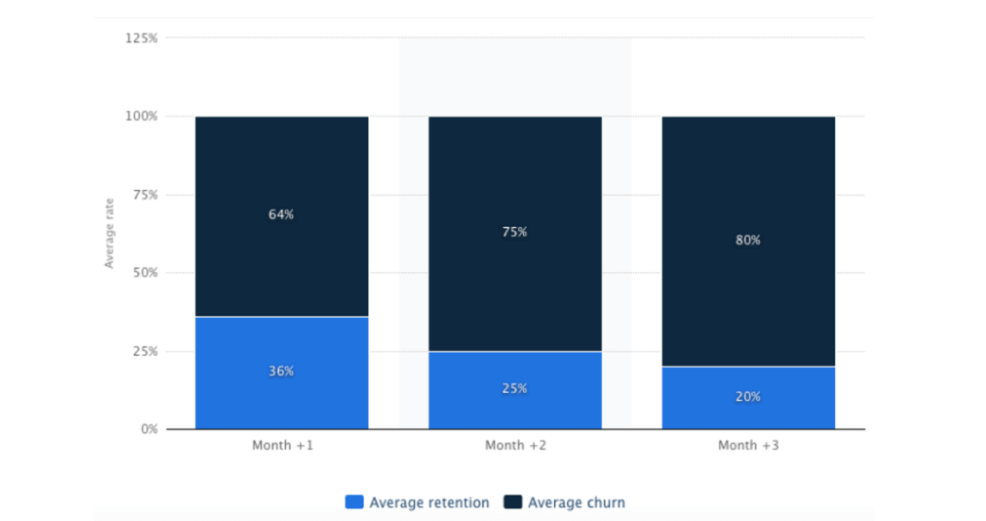
Image: Statista
Tracking Uninstalls
Track daily and weekly churn rate using this formula:
Pro tip: Compare daily uninstalls with the number of daily downloads and daily activations to get a net result of your mobile app growth.
Let’s say roughly 10 users uninstall and 35 new users are activated each day. That represents an uptick of 25 users each day. If those numbers were reversed, you’d have a serious churn problem on your hands.
Performance Issues That Lead to Churn*:
Even more interesting, mobile app users prioritize quality and star ratings over price8 when selecting apps.

How to Spot Your App Uninstalls From a Distance
As the mobile app marketplace continues to expand, marketers must work smarter than ever before to capture and retain user interest.
Luckily, there’s a tool that makes tracking, managing, and applying insights from mobile app analytics easy. See how CleverTap can help grow your mobile app by scheduling a demo with our mobile marketing experts.

See how today’s top brands use CleverTap to drive long-term growth and retention