Think of your business as a bucket. If there are leaks (churn), no matter how much water (users) you pour in, it will never stay full. Fixing those leaks, through better user retention, is what truly powers sustainable growth.
According to a study by Frederick Reichheld of Bain & Company, increasing user retention by just 5% can increase profits by 25% to 95%, making it the most cost-effective growth strategy for marketers.
This guide will cut through the noise to answer what is user retention, how to measure it, and how to improve it with proven strategies. You’ll learn data-driven frameworks to retain users, optimize customer lifetime value, and build loyalty that converts passive users into brand advocates. Let’s dive in.
What is User Retention?
User retention refers to a business’s ability to keep users engaged and returning to its product or service over time. Rather than focusing solely on new user acquisition, user retention measures how effectively your product delivers ongoing value, encourages repeat usage, and builds long-term loyalty.
High user retention signals that users are satisfied and see continued benefit, while low retention often points to unmet needs or a lack of customer engagement. Ultimately, user retention is about minimizing churn and maximizing the number of users who actively interact with your offering throughout their lifecycle.
User Retention vs. Customer Retention
User retention tracks engagement of all users (free or paying), while customer retention focuses on paying customers. They both overlap but differ in purpose.
- User retention measures logins and feature usage, while customer retention prioritizes renewals and repeat purchases.
- Paid services emphasize customer retention; freemium models rely on user retention.
Importance of User Retention
User retention determines whether businesses thrive or merely survive.
- Retaining users costs up to 5 times less than acquiring new ones, freeing resources to improve products rather than chase fleeting leads.
- Loyal users drive predictable revenue. For example, SaaS companies with high retention rates see compounding growth, as retained customers upgrade plans, refer peers, and provide feedback to refine offerings. This creates a self-sustaining growth loop, especially critical in industries like e-commerce where repeat purchases account for 40% or more of revenue.
- Beyond finances, retention builds trust. Users who stay engaged are more likely to forgive missteps and advocate for your brand organically. In e-commerce, user retention supports compliance-first growth by relying on first-party data collected through direct customer interactions, enabling personalized experiences without compromising privacy or depending on third-party trackers.
To harness this potential, you need to know how to measure user retention.
How to Measure User Retention
Measuring user retention involves tracking key metrics that reveal how effectively your product keeps users engaged over time. Here are the primary metrics marketers should monitor:
1. Retention Rate
Retention rate shows the percentage of users who continue using your products over a specific time period. The final percentage can be used to measure retention and can be measured at different times, like Day 1, Day 7, or Day 30, to understand how engagement changes after onboarding or major updates.
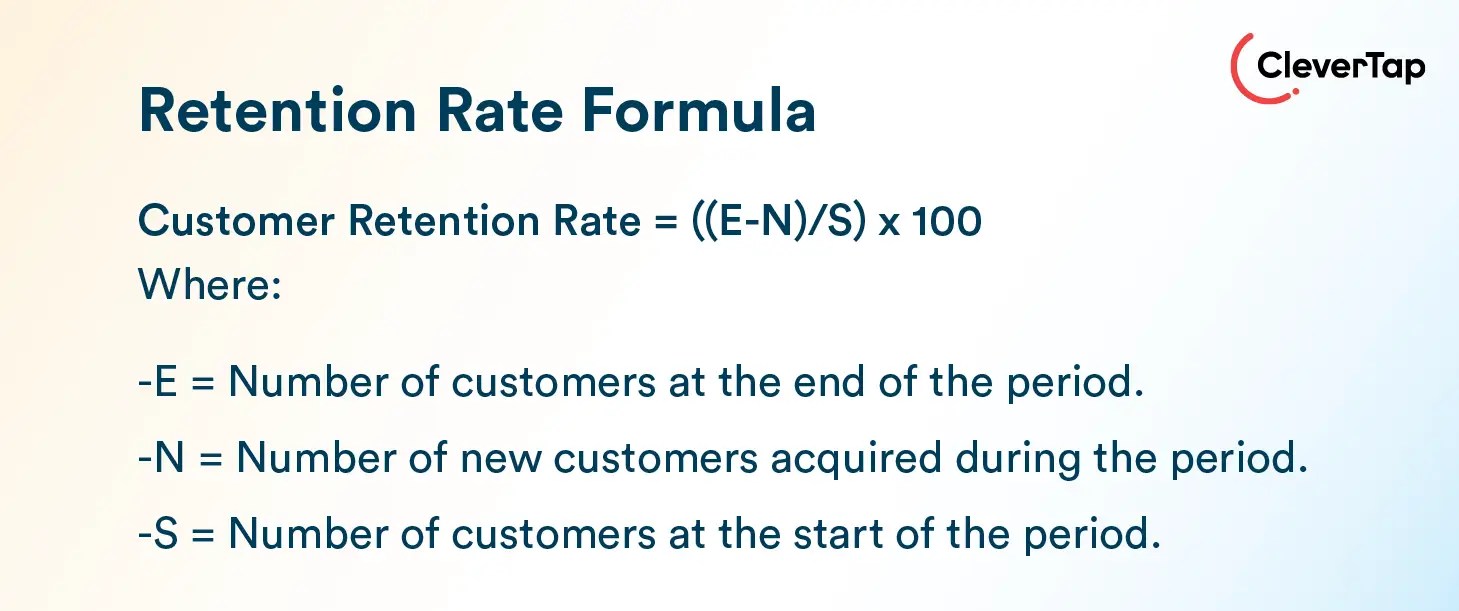
Retention Rate (%) = (Number of Customers at the End of the Period – Number of New Customers Acquired during the Period) ÷ Number of Customers at the Start of the Period × 100
2. Churn Rate
Churn rate is the percentage of users who stop engaging with your product within a set timeframe. A high churn rate signals issues with product value or user experience, and vice versa.
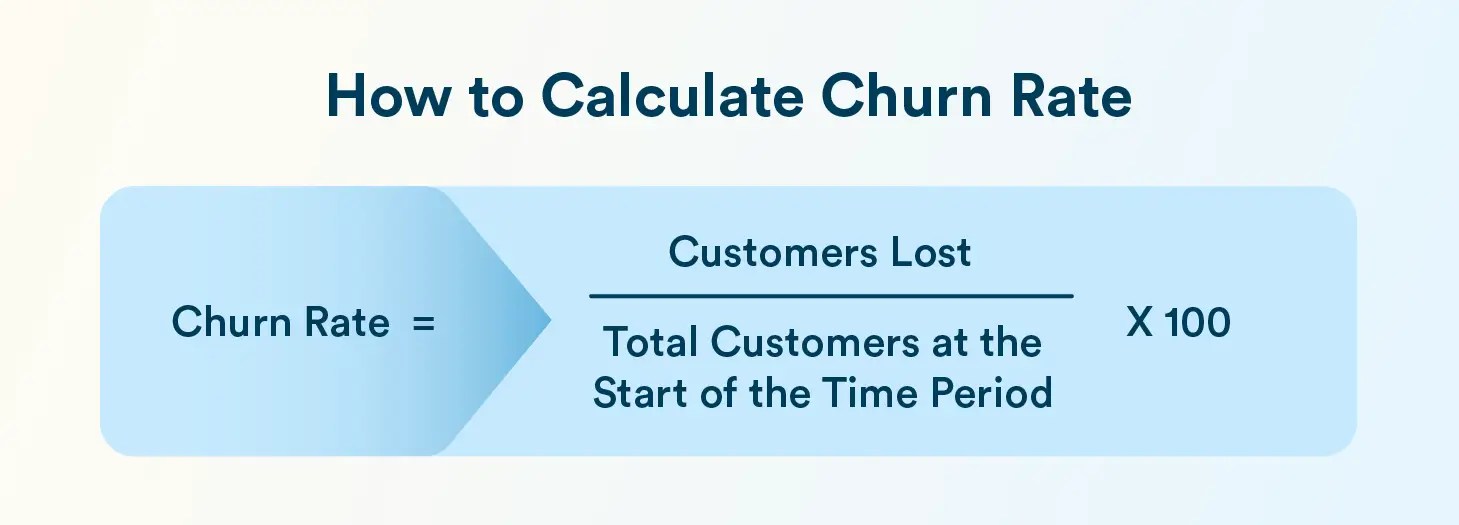
Churn Rate (%) = (Customers Lost ÷ Total Customers at the Start of the Time Period) × 100
3. Daily Active Users (DAU) / Monthly Active Users (MAU)
Daily active users (DAU) and monthly active users (MAU) are signals of user engagement, showing the number of unique users interacting with your product on a daily or monthly basis.
Comparing daily users to monthly users, which is known as stickiness, helps you understand how often users return and how essential your product is to them.
Learn more about DAU and MAU and understand why app stickiness matters.
4. Customer Lifetime Value (CLV)
Customer lifetime value (CLV) helps you predict the net profit a user will generate throughout their relationship with your product. High user retention will increase CLV, making each user more valuable and justifying further investment in retention strategies.
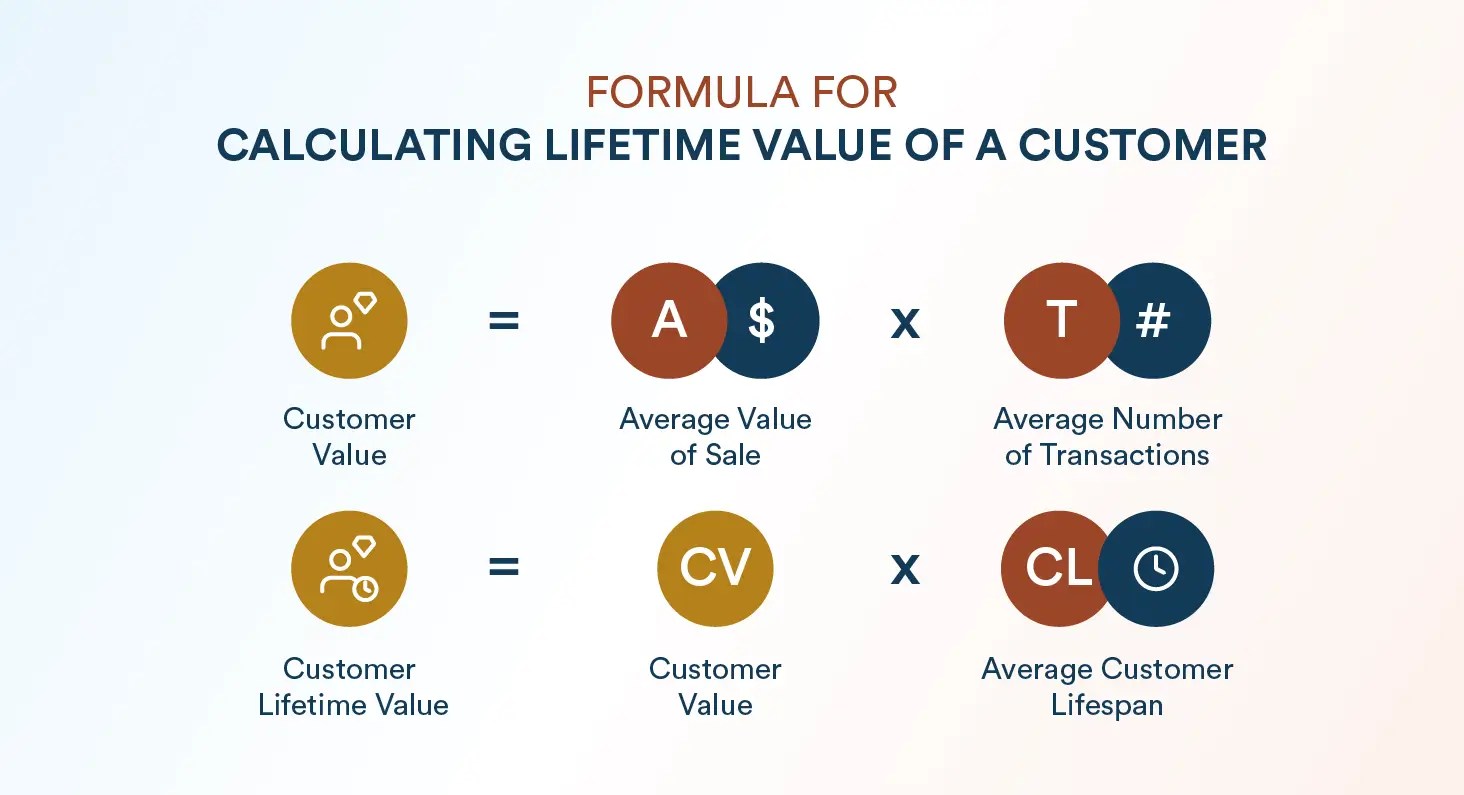
CLV = (Average Value of Sale) × (Average Number of Transactions) × (Average Customer Lifespan)
5. Cohort Analysis
Grouping users based on when they started using your product allows you to track how different cohorts retain over time. This helps you pinpoint the impact of product changes or marketing campaigns on retention.
Learn how to conduct cohort analysis and see how CleverTap can help you.
6. Rolling Retention
This retention metric tracks users who return to your product on a specific day or any day thereafter within your set timeframe. This metric offers a more flexible approach than the standard retention rate, as it is easy to use while letting you view your active daily users the same way as someone who only returns to your product once during the set timeframe.
Rolling Retention (%) = (Number of Users Whose Last Day of Activity is on or after Day N ÷ Number of Users Who Started on Day 0) × 100
You can calculate rolling retention by taking the number of users who have used your product on or after a specific day and dividing it by the number of users who first used your product on Day 0 of your timeframe.
What is a Good User Retention Rate?
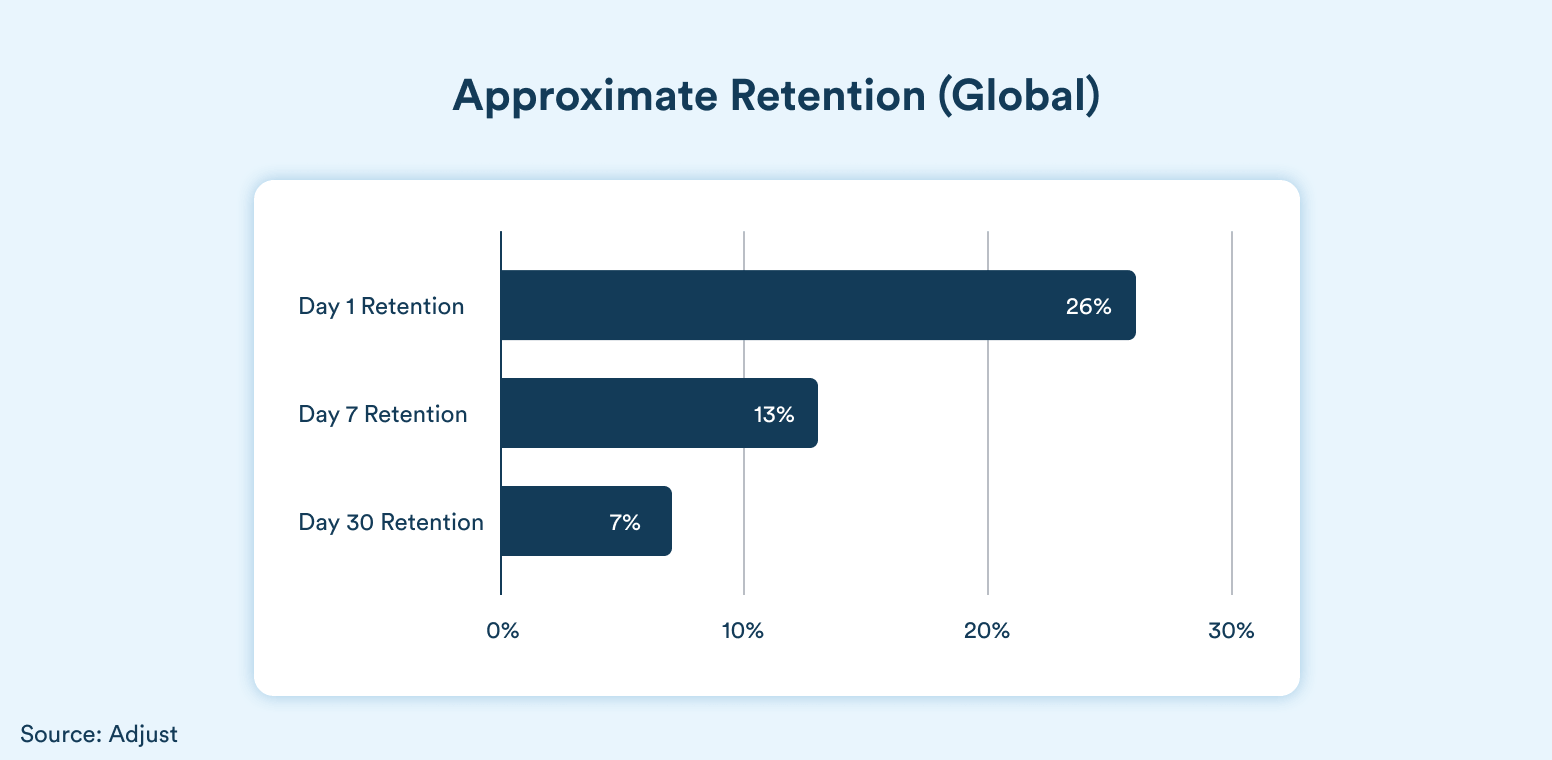
A good retention rate for a mobile app varies based on factors like app category, target region, and platform. According to Adjust’s benchmarks:
Day 1 Retention: Globally, around 26% of users return on the first day after installation. This rate drops to approximately 13% by Day 7 and stabilizes around 7% by Day 30, which is commonly referred to as the 30-day retention rate.
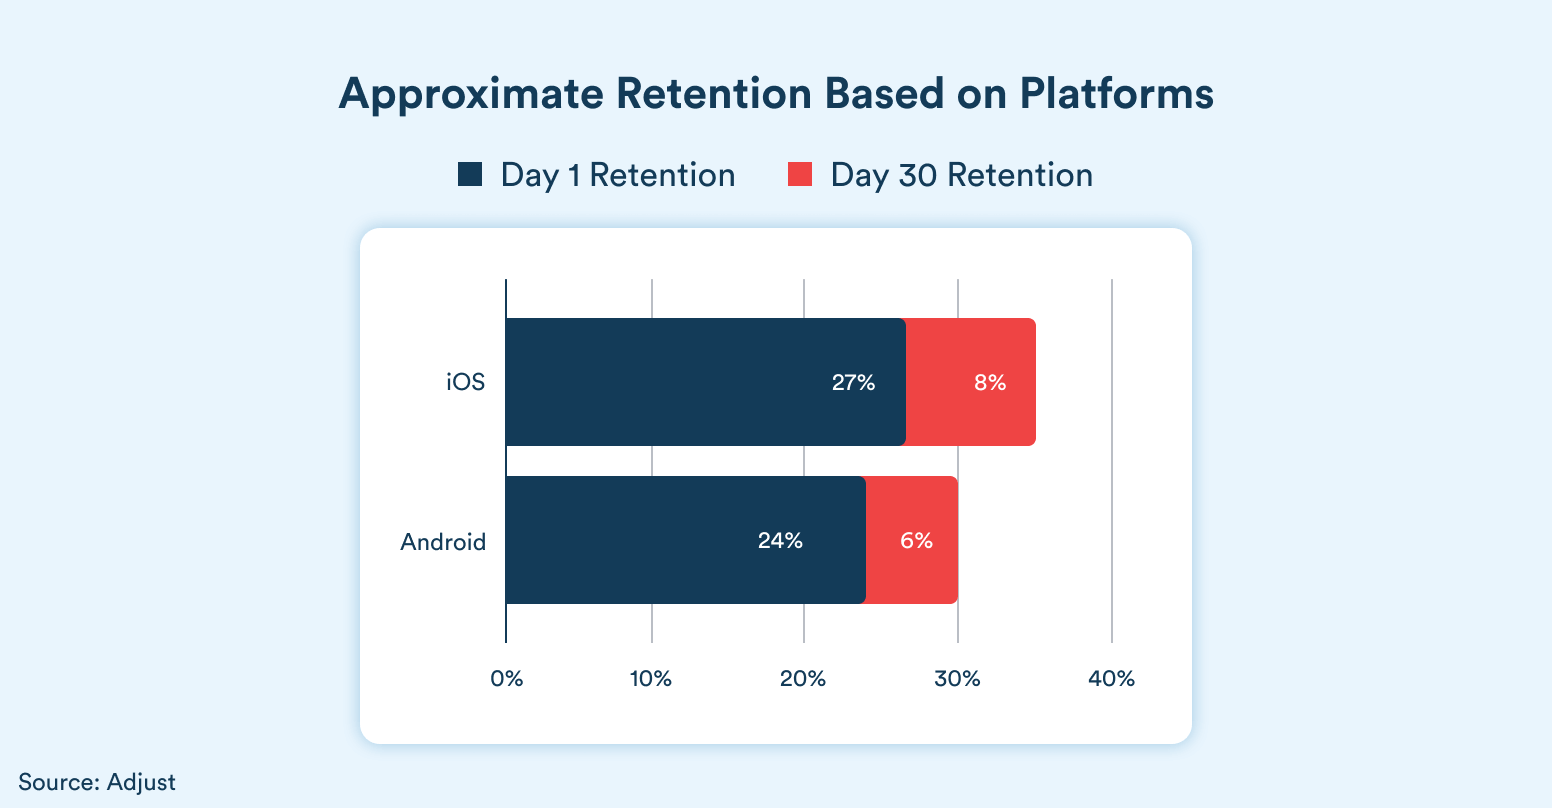
Platform Differences: iOS users tend to have slightly higher rates than Android users. For instance, iOS sees about 27% retention on Day 1, while 30-day retention declines to 8%. Android starts at 24% on Day 1 and drops to 6% by Day 30.
Regional Variations: Retention rates also differ by region. For example, Day 1 retention in APAC and LATAM aligns with the global average of 26%, while Europe and MENA are slightly lower at 24%, and North America is at 23%. 30-day retention rates typically settle between 4% and 6% across these regions.
App Categories: Certain app categories naturally have higher retention rates. Gaming apps, for instance, often see Day 1 retention rates around 28-29%, while fintech and lifestyle apps lead in Day 30 retention, reaching up to 9%.
In summary, a “good” retention rate is relative and should be assessed in the context of your app’s specific category, target audience, and market.
What are the Phases of User Retention?
User retention unfolds across three critical stages, each requiring tailored strategies to keep users engaged and invested in your product over time. Here are the different phases:
User Onboarding
User onboarding is the pivotal stage where new users form their initial perception of your product. The goal is to guide them to recognize your product’s unique value as quickly as possible. The key objectives in this phase include the following:
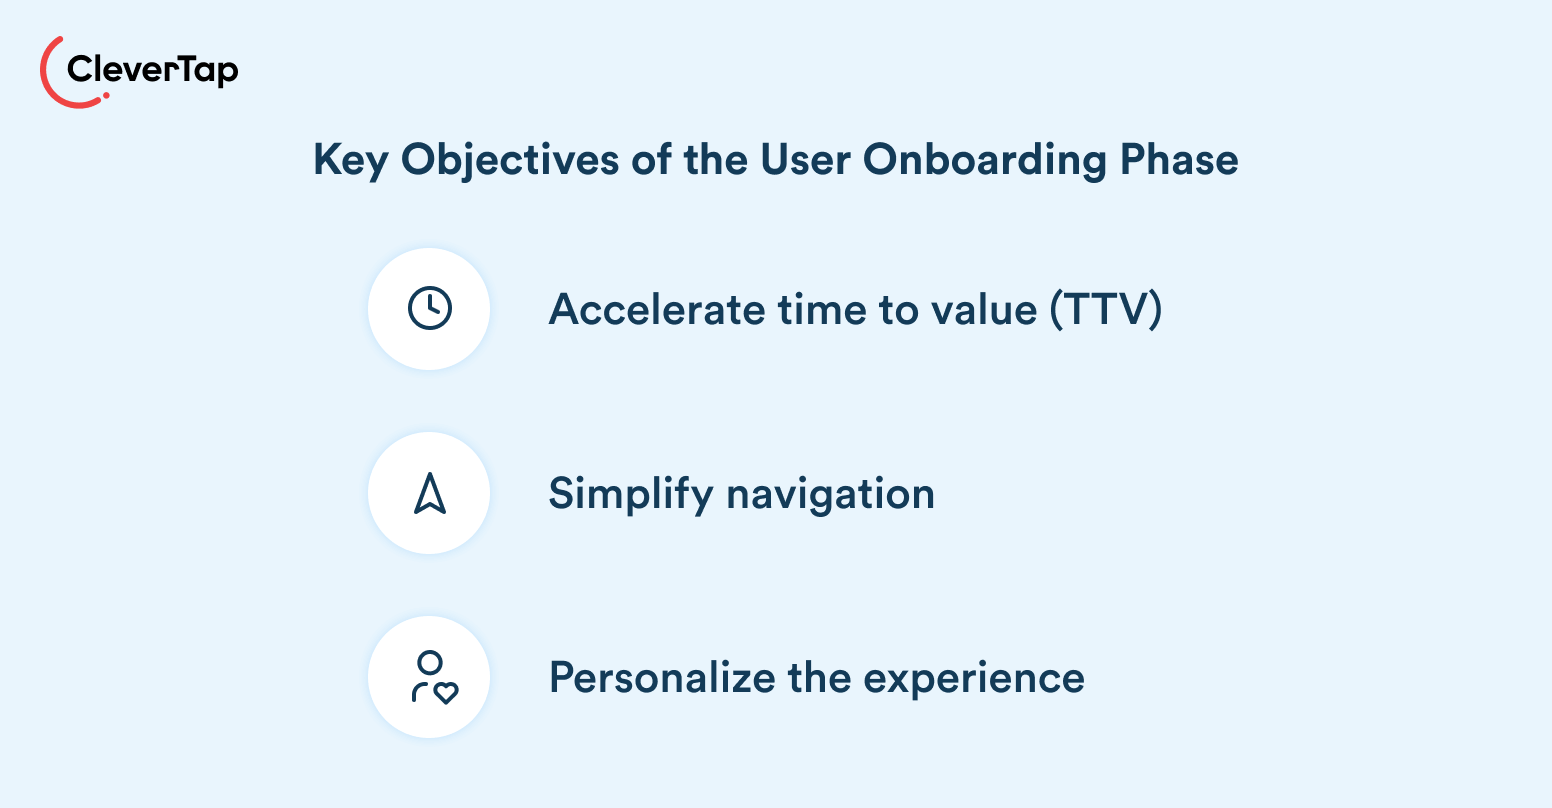
- Accelerate Time To Value (TTV): Help users achieve their first success (e.g., completing a task) within minutes.
- Simplify navigation: Use guided walkthroughs to highlight essential features without overwhelming users.
- Personalize the experience: Tailor onboarding based on user goals (e.g., “Are you here to manage projects or track sales?”).
A smooth and engaging onboarding process reduces early churn and increases user retention, as once the user understands your product and how essential it is to their workflow. The user then moves into the activation phase.
Learn how to conduct app onboarding for your users effectively.
User Activation
After onboarding, users enter the critical adoption phase where initial excitement fades and habit formation begins. This stage determines whether users integrate your product into their routines or abandon it for competitors.
Once users are activated, the focus shifts to habit-building, helping them integrate your product into their daily routines. This phase prevents the common drop-off where users understand the product’s value but fail to adopt it fully. Here are some critical strategies to prevent user dropoff:

1. Advanced Feature Adoption
Introduce power tools via contextual tooltips (e.g., “Automate this task?” when a user repeats an action). Example: A design tool suggests batch-editing features after a user manually adjusts 5+ elements.
2. Behavioral Reinforcement
Send personalized digests (e.g., “You’ve saved 3 hours this week using our templates”). Notify users about underutilized features tied to their goals (e.g., “Enable analytics to track your team’s progress”).
3. Progressive Rewards
Offer tiered perks for consistent use (e.g., “Unlock priority support after 30 days of activity”). You can even gamify exploration (e.g., badges for testing new features like “AI Assistant Explorer”).
Habit Forming
At this stage, users fully integrate your product into their workflows, treating it as an indispensable tool. They’ve moved beyond occasional use to habitual reliance, where your product becomes a non-negotiable part of their routine.
Key characteristics of retained users include habit-driven usage, wherein they interact with your product daily/weekly without reminders, and brand evangelism, where users actively promote your product through reviews, referrals, or case studies. Here are proven methods to help build long-term relationships with your users.
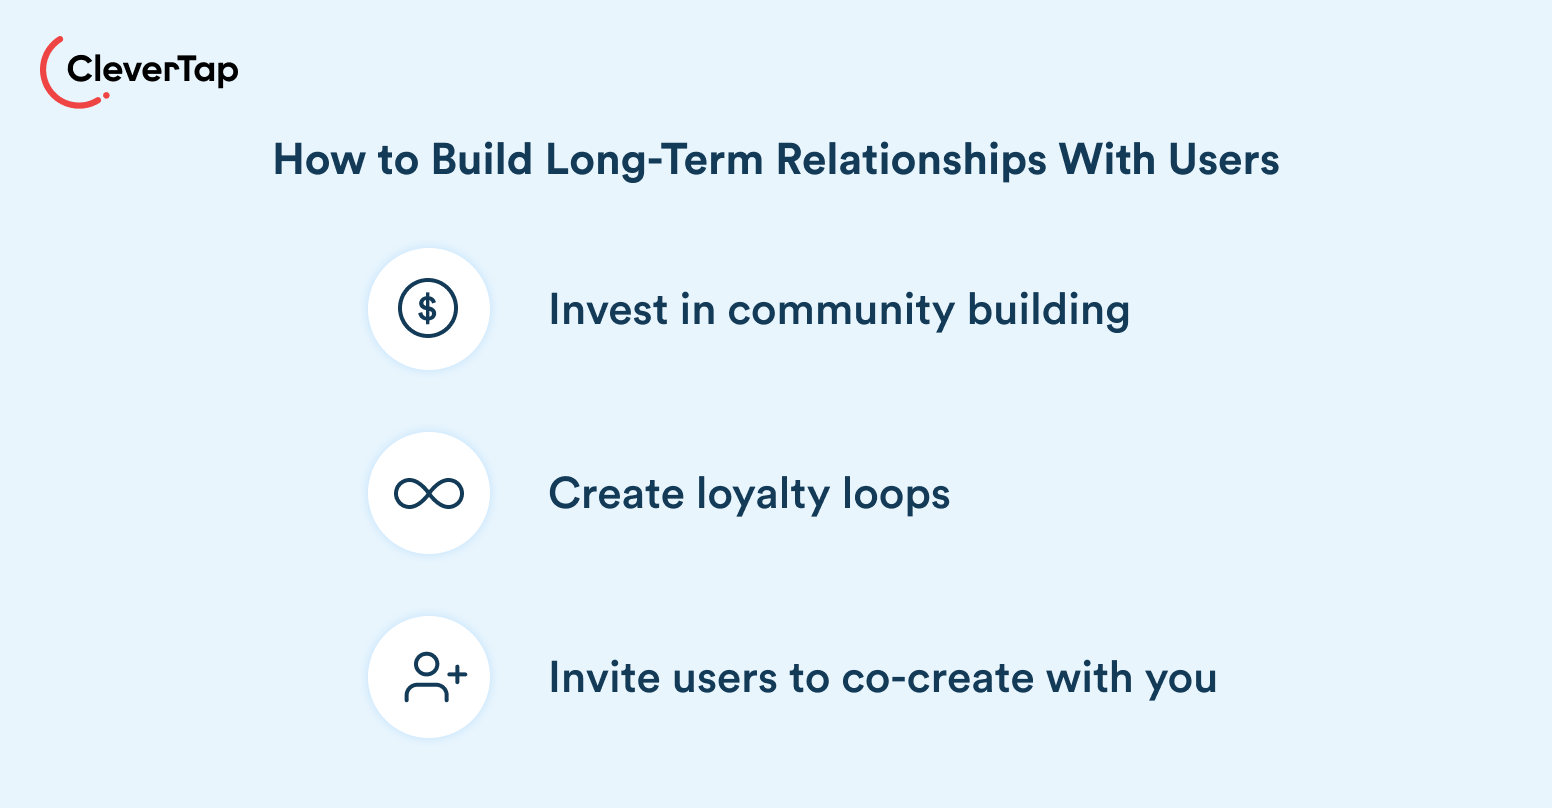
- Community building: Create user groups or ambassador programs (e.g., “Power Users Club” with exclusive webinars).
- Loyalty loops: Offer perks for referrals or content creation (e.g., “Earn credits for sharing case studies”).
- Co-creation: Involve users in beta tests or roadmap decisions (e.g., voting on feature priorities).
Strategies to Improve User Retention
Retaining users is an ongoing process that requires a combination of thoughtful product design, meaningful engagement, and consistent value delivery. Leading brands today rely on a blend of personalization, regular product enhancements, proactive communication, incentives, and community-building to keep users engaged and loyal.
1. Personalized User Experience
Tailoring the customer experience based on individual preferences and behaviors is a proven way to increase user retention.
By analyzing user data, including feature usage, interests, and engagement patterns, businesses can deliver personalized recommendations, dynamic content, and customized interfaces.
Examples include suggesting products based on browsing history, sending hyper-personalized onboarding messages, or displaying dashboards that reflect each user’s goals. This approach makes users feel understood and valued, encouraging them to keep coming back.
2. Regular Updates And Feature Improvements
Consistently updating your product with new features, improvements, and bug fixes shows users that you are committed to evolving their experience. However, it’s equally important to make new features discoverable. Try:
- In-app messaging or spotlight tutorials when new features go live
- Tooltips or “What’s New” modals to guide users
- Feedback loops to collect suggestions for future updates
Communicating improvements through changelogs or personalized nudges shows users their voices matter.
3. Effective Communication Channels
Effective communication channels are essential for retention, but it’s equally important to understand the psychology behind user actions. The Fogg Behavior Model teaches us that motivation, ability, and timely triggers must align to prompt engagement. Enhance user retention by:
- Sending well-timed push notifications or emails based on user behavior
- Offering micro-rewards (e.g., badges, recognition) for key actions
- Using nudges to simplify complex flows and drive completion
Reinforcing these actions with rewards or recognition creates habit loops that turn casual users into loyal customers.
4. Loyalty Programs and Incentives
Rewarding users for their ongoing engagement can significantly boost user retention. Loyalty programs, such as points systems, exclusive discounts, or early access to new features, motivate users to stick around.
Successful examples include Starbucks Rewards, which offer members tangible benefits for continued use. The key is to make rewards meaningful and attainable, so users feel recognized and appreciated for their loyalty.
Get inspired by these customer loyalty program examples from top brands.
5. Community Building
Fostering a sense of community turns users into long-term supporters. Creating forums, user groups, or ambassador programs allows users to share experiences, offer advice, and connect over shared interests.
Hosting webinars, challenges, or user-generated content campaigns further strengthens these connections. A strong community not only increases retention but also encourages organic growth through word-of-mouth recommendations.
6. Easy Onboarding
The initial user experience is critical. A clunky onboarding process is one of the top reasons users drop off. Adaptive onboarding that evolves based on the user’s role, goals, and actions. Best practices include:
- Interactive walkthroughs that reduce friction
- In-app tooltips to guide first-time users
- Progress tracking to encourage task completion
The smoother the onboarding, the more likely users are to return and engage deeply.
7. Proactive Customer Support
Don’t wait for frustration to push users away. Proactively address potential challenges through:
- In-app help widgets or chat support
- AI-based FAQs and guided help journeys
- Contextual support prompts when users encounter friction
Preventative support reassures users and builds trust, ultimately reducing churn.
Real-World Examples of Successful User Retention Strategies
Effective retention strategies blend personalization, proactive engagement, and continuous value delivery. While every industry faces unique challenges, these examples demonstrate how leading brands turn casual users into loyal advocates.
1. Shawarmer Boosted Retention with Data-Driven Segmentation
Shawarmer, one of the leading quick-service restaurant chains in the Middle East, shows how a smart, data-driven approach can deliver results. Facing the challenge of keeping customers engaged in a highly competitive market, Shawarmer turned to CleverTap’s RFM analysis based automated customer segmentation to categorize users into loyal, occasional, and at-risk groups.
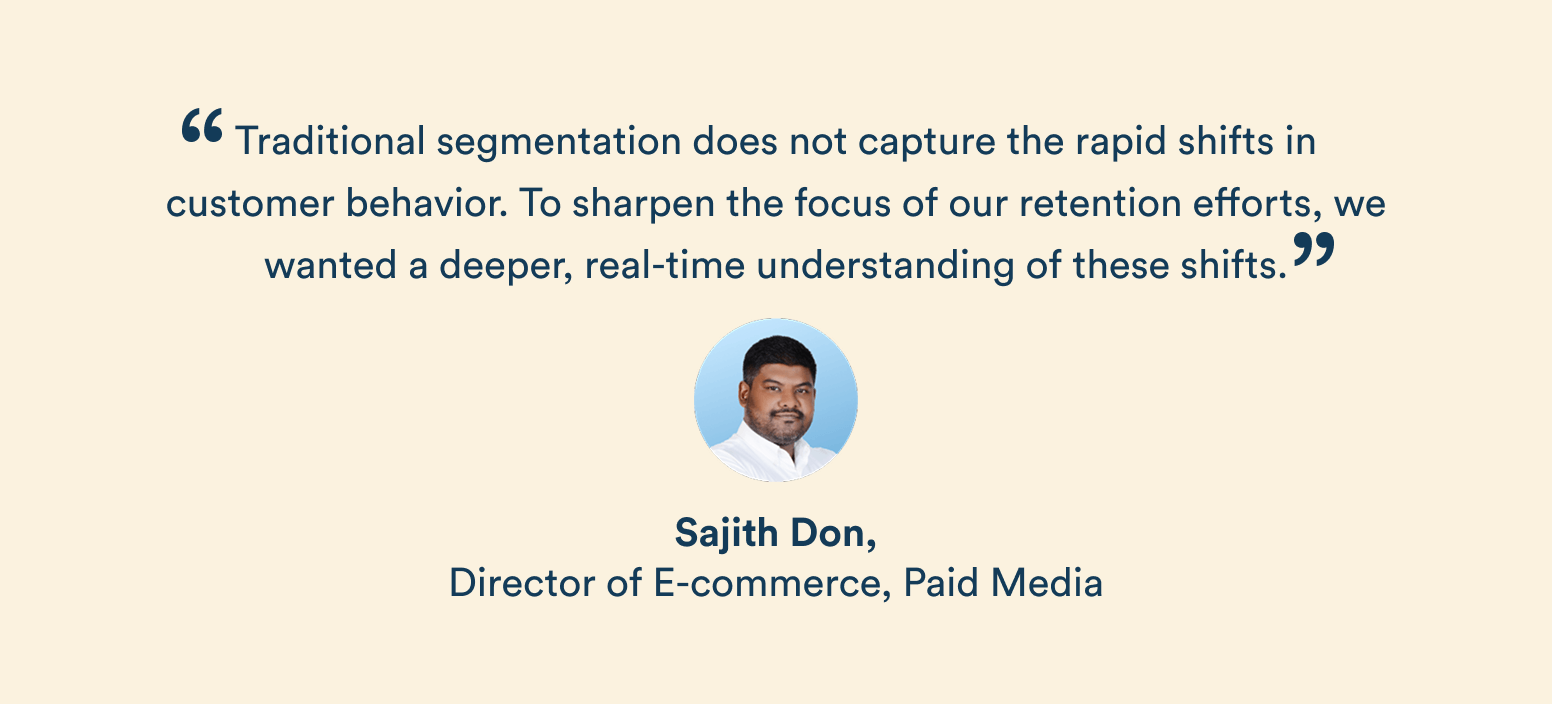
By delivering highly targeted, personalized campaigns, such as exclusive rewards for loyal users and reactivation offers for at-risk customers, Shawarmer saw a 9% increase in overall sales and a 36% reduction in churn.
This case study highlights the critical role of automated segmentation and personalized engagement strategies in boosting user retention and driving sustainable growth. Instead of treating all users the same, Shawarmer’s tailored approach ensured every customer felt valued, increasing both lifetime value and brand loyalty.
Read the full case study here.
2. Akseleran Boosted Month-1 User Retention by 14% Using Actionable Funnels
Fintech brand Akseleran improved early user engagement by leveraging CleverTap’s Funnels and Campaigns to identify key drop-off points and trigger targeted push notifications. By re-engaging users with timely, personalized messages during onboarding, Akseleran saw a 14% increase in Month-1 retention.
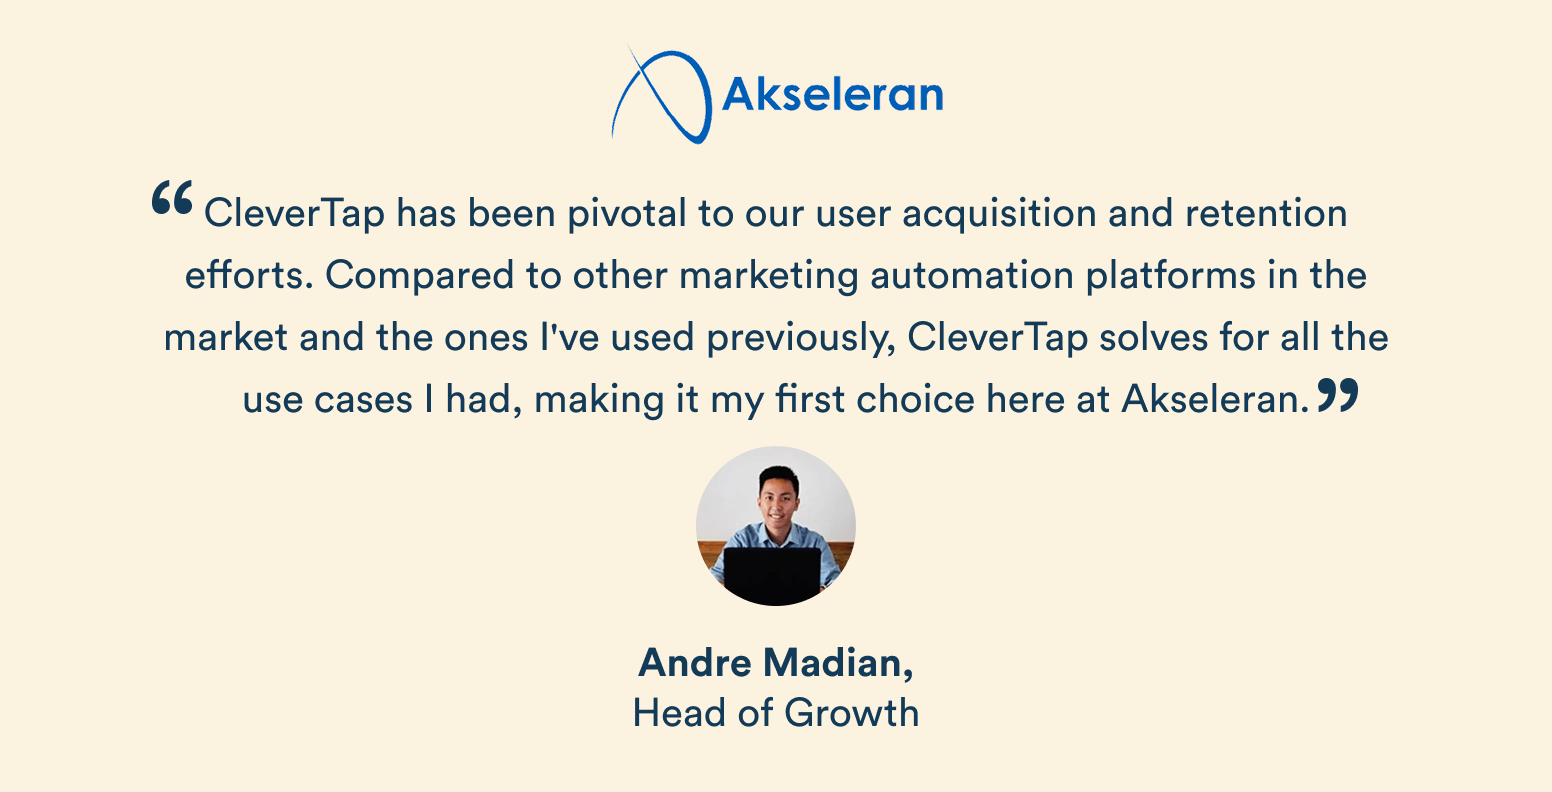
This success highlights how combining behavioral analytics with lifecycle marketing can significantly improve retention in the critical first weeks of the user journey.
Read the full case study here.
3. Starbucks Boosts User Retention Using Loyalty Programs
Starbucks keeps customers coming back with its Rewards program, which combines personalized offers, birthday perks, and tiered rewards. By integrating payment, ordering, and loyalty into a single app, Starbucks creates a seamless experience where users earn points on every purchase and redeem them for free items. This approach turns occasional buyers into habitual users and strengthens emotional connections through seasonal campaigns and exclusive perks.
According to their 2023 fiscal report, Starbucks Rewards had surpassed 34 million active U.S. members by 2023, driving both retention and revenue.
Challenges in User Retention
Retaining users is tougher than ever, with businesses facing several common hurdles:
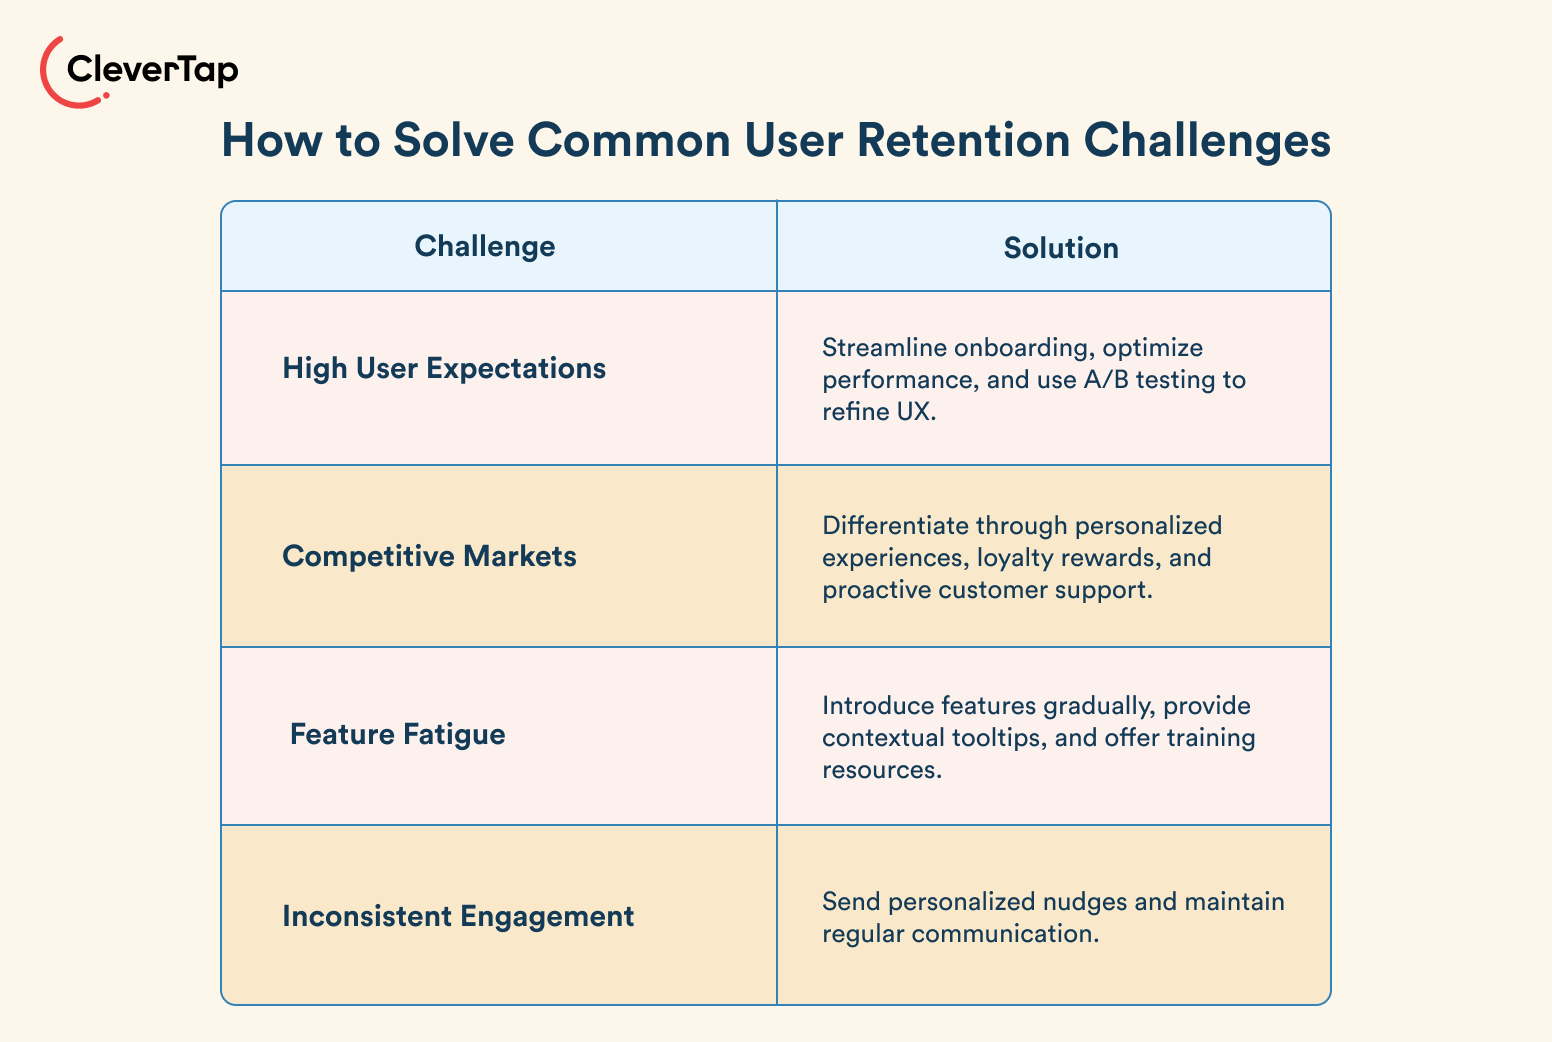
1. High User Expectations
Users demand instant value and seamless experiences. A single friction point (e.g., slow load times or confusing navigation) can drive churn.
Solution: Streamline onboarding, optimize performance, and use A/B testing to refine UX.
2. Competitive Markets
With countless alternatives available, users often switch to competitors offering better features or pricing.
Solution: Differentiate through personalized experiences, loyalty rewards, and proactive customer support.
3. Feature Fatigue
Users may feel overwhelmed by frequent updates or underutilize advanced tools.
Solution: Introduce features gradually, provide contextual tooltips, and offer training resources.
4. Inconsistent Engagement
Users lose interest without regular value reinforcement.
Solution: Send personalized nudges (e.g., milestone celebrations or re-engagement offers) and maintain regular communication.
Adapting to Changing User Needs
Staying aligned with evolving user preferences and market dynamics is critical for long-term relevance. Businesses must proactively track behavior patterns and industry shifts through data analytics and direct feedback. To remain agile, prioritize rapid experimentation, iterative updates, and adaptable strategies that respond to real-time insights.
Let CleverTap help you boost user retention.
Shivkumar M 
Head Product Launches, Adoption, & Evangelism.Expert in cross channel marketing strategies & platforms.
Free Customer Engagement Guides
Join our newsletter for actionable tips and proven strategies to grow your business and engage your customers.


