


Table of Contents
Categories
Most Popular


We’re in the middle of an undeniable period of transformation. COVID-19 has fundamentally changed how mobile brands operate and connect with their customers. With major cultural and economic shifts, evolving user expectations, and new channels and technologies, the marketing playbook of yesterday is obsolete.
It’s one reason why we’re constantly digging into real-time data to find out what’s working for mobile brands right now — and to discover how emerging trends are shaping the industry landscape for tomorrow.
Our latest benchmark report spans the entire first half of 2020 and examines data from approximately 250 unique apps, plus data collected by AppsFlyer. It identifies trends across customer acquisition, app revenue, user engagement, marketing campaign performance, and retention rates to help marketers understand what kind of growth to expect in the context of COVID-19.
Key Findings:
- Apps increased their install ad spend by 20% by early May.
- In-app revenue remains strong: consumer spend in non-gaming apps has grown nearly 50% since mid-March, and gaming revenue jumped 42% by early May.
- Some app industries have seen a surge in user engagement — some as high as a 177% average increase in daily active users (DAUs).
- For struggling industries, app launches fell as much as 60-80%.
- Marketers in thriving industries responded by ramping up campaign activity, in some cases by more than 60%. Meanwhile, struggling industries showed a significant drop in campaign volume as marketers refocused strategies and determined next steps.
- In general, marketers who reduced campaign volume saw a corresponding dip in CTRs, while industries that increased campaign activity were rewarded with higher engagement — suggesting users remain responsive to marketing activity.
- For some industries, Day 7 retention jumped almost 70%. Other verticals are struggling to retain customers after seeing up to 68% higher churn in March and April.
Data Report: How COVID-19 Has Affected Mobile Brands
App Installs: COVID-19’s Effect on User Acquisition
Note on Methodology: Data was normalized by dividing the weekly share of installs/sessions/spend/revenue by the overall number of installs/sessions/spend/revenue throughout the entire examined time frame.
According to AppsFlyer data, apps increased their spend by 20% by early May to meet heightened demand. Since then, spend has dropped by 12% but remains almost 5% higher than pre-lockdown days.
Cost per install is currently 40% higher in gaming and 30% higher in non-gaming compared to mid-March. Because many of the brands that reduced their spend early on have started spending again, prices are now being driven up — leaving advertisers with fewer users to acquire with the same budget.
After the early spike in app installs (+25% in organic, +35% non-organic by early April), the demand has naturally decreased leading to a 16% drop in organic installs since mid-March. Lower demand and especially rising media costs have also led to a larger 30% drop in marketing activity during the same time frame.
Mobile Business Revenue: A Shifting Economy’s Influence on Monetization
In spite of fears of a sharp decline in consumer spend, AppsFlyer data shows that revenue has remained high following the 45% jump during lockdown. Consumer spend in non-gaming apps is particularly impressive, growing almost every week and nearly 50% since mid-March. Gaming revenue surged 42% by early May.
In-app purchases remain 20% higher than pre-lockdown days, and 50% of app categories have experienced positive month over month revenue growth in the past month.
Consumer spend in Shopping apps has increased 50% since the start of lockdown and a further 8% in the past month as demand for online shopping is rising. Fintech revenue surged 75% since lockdown started, and Lifestyle apps almost doubled revenue generation since mid-March, growing a further 35% in the past month.
DAUs: Understanding The Impact on App Engagement
Given widespread shelter-in-place orders, it’s no surprise that users are turning to apps that keep them either entertained or connected to essential services. And industries that require consumers to travel or gather in numbers are naturally among the hardest hit. 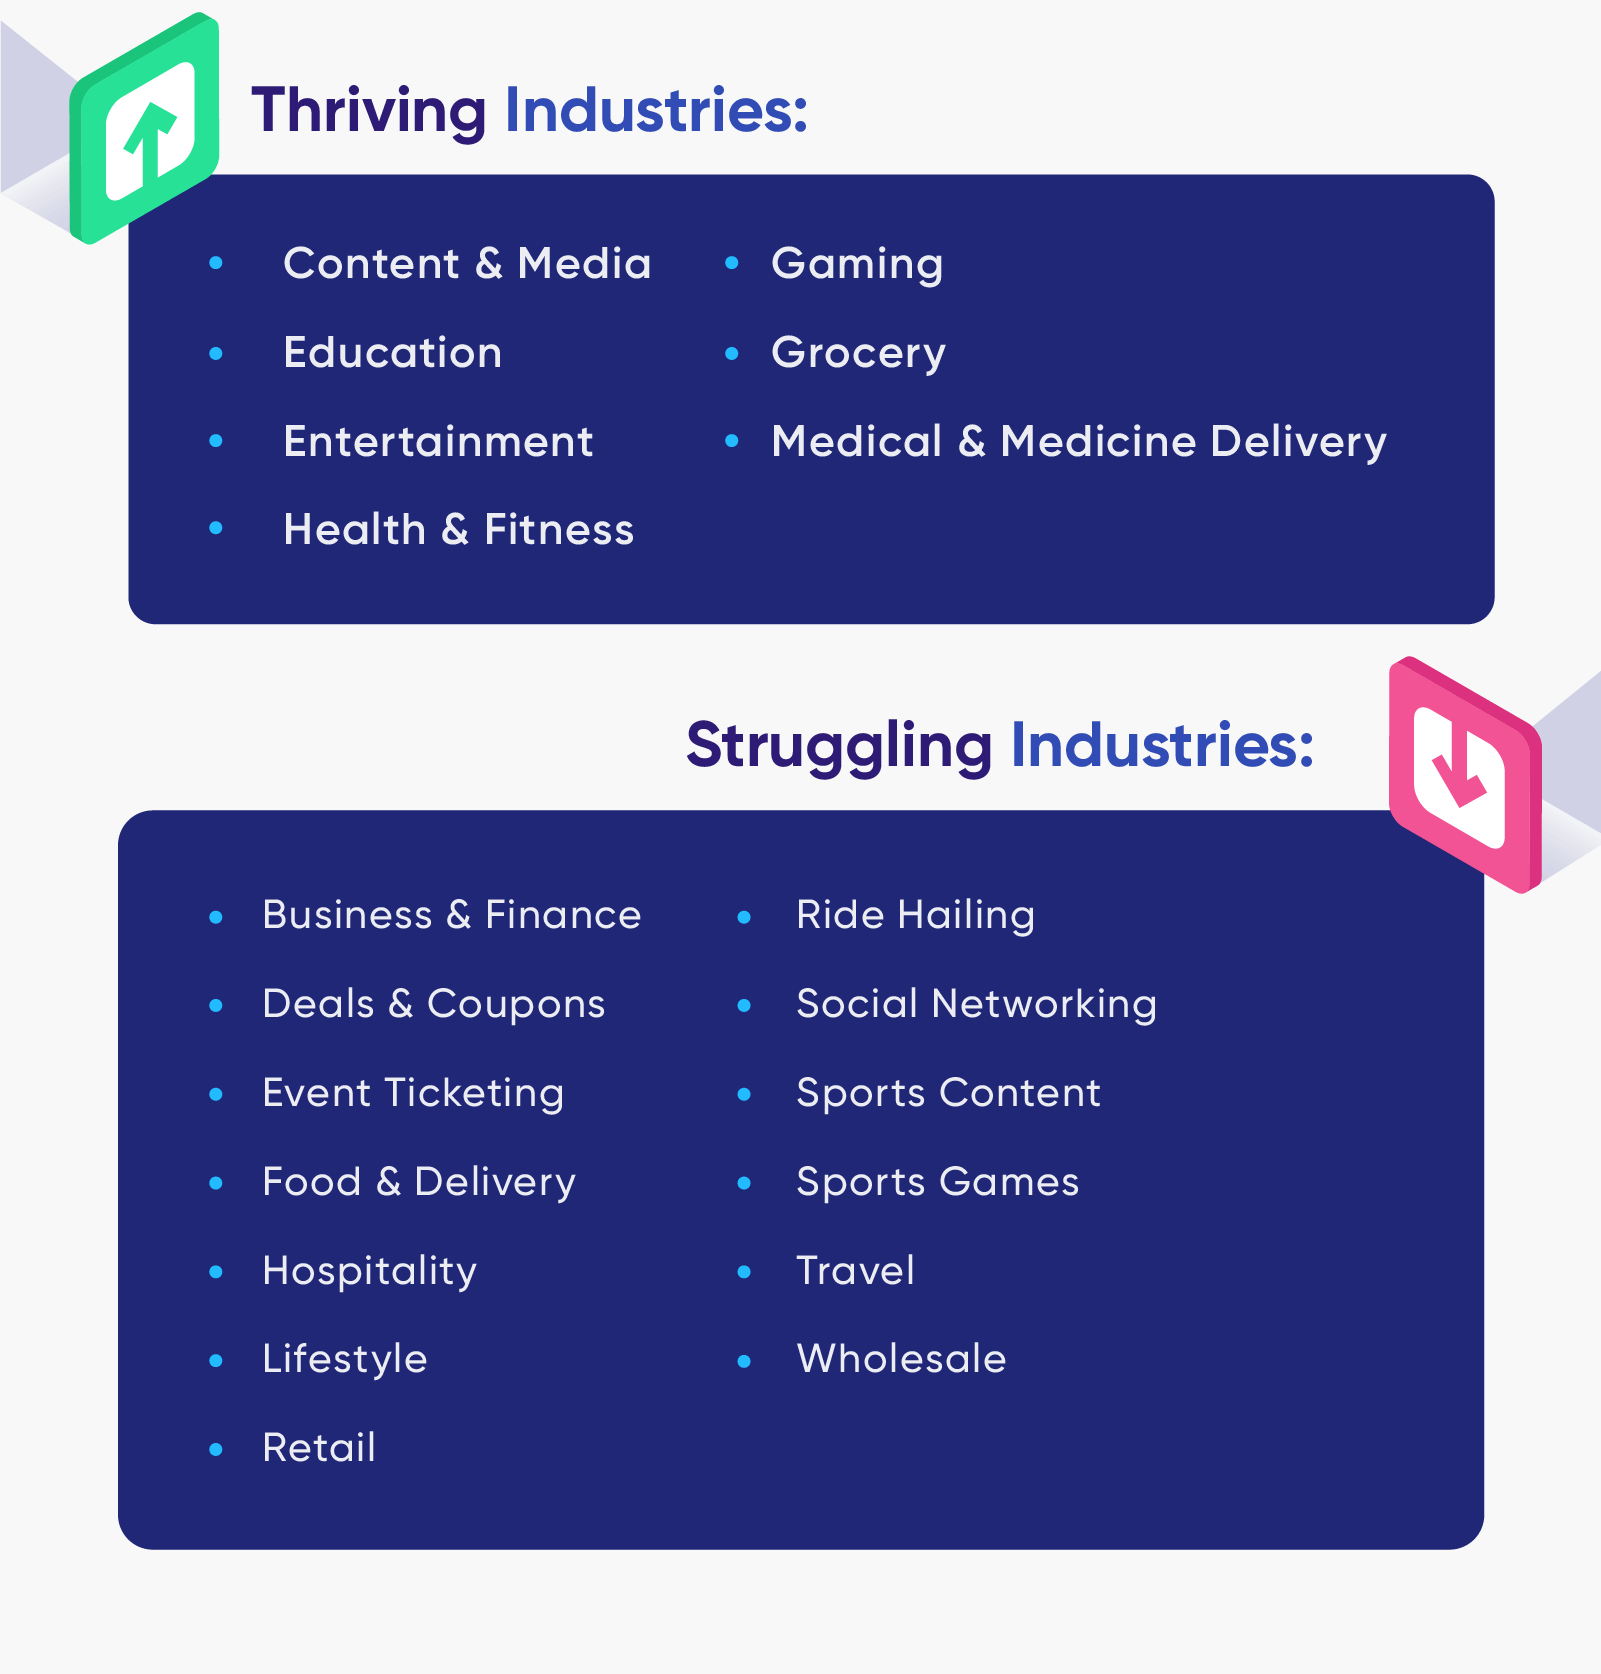
Grocery apps saw a dramatic increase in DAUs during the month of March as governments around the world issued lockdown orders. App launches were up 177% on March 24 as consumers scrambled to secure supplies and prepared to shelter in place.
Content & Media apps saw a 40% increase in DAUs beginning in early March, Entertainment apps saw a 20% increase, and Gaming apps saw a similarly constant increase in app launches throughout the month of March.
Meanwhile, given widespread bans on public gatherings and severe restrictions that have brought nearly all travel to a standstill, it’s no surprise that Event Ticketing, Travel, and Hospitality apps have been especially hard hit as this pandemic stretches on. Ride Hailing apps, for example, suffered a nearly 60% decrease in app launches by the end of March.
Campaign Activity & CTRs: Analyzing Marketing Performance
Marketers in thriving industries are capitalizing on this surge in user interest by sending more campaigns — and they’re being rewarded with higher CTRs. One example is Education: after increasing campaign activity by 20%, these apps have seen a more than 3% jump in CTRs.
On the other end of the spectrum, struggling industries have either sent fewer campaigns overall or temporarily paused marketing activity in order to regroup and restrategize. In spite of these efforts, CTRs for struggling industries are generally down or flat.
Customer Retention Rates: Examining 2020 App Growth
Sustainable business growth means more than app launches and campaign engagement. It means attracting loyal customers who stay engaged with your app, purchase frequently, and tell others about your service.
So how has the pandemic and subsequent global shutdown affected the metric that matters most for mobile brands: user retention?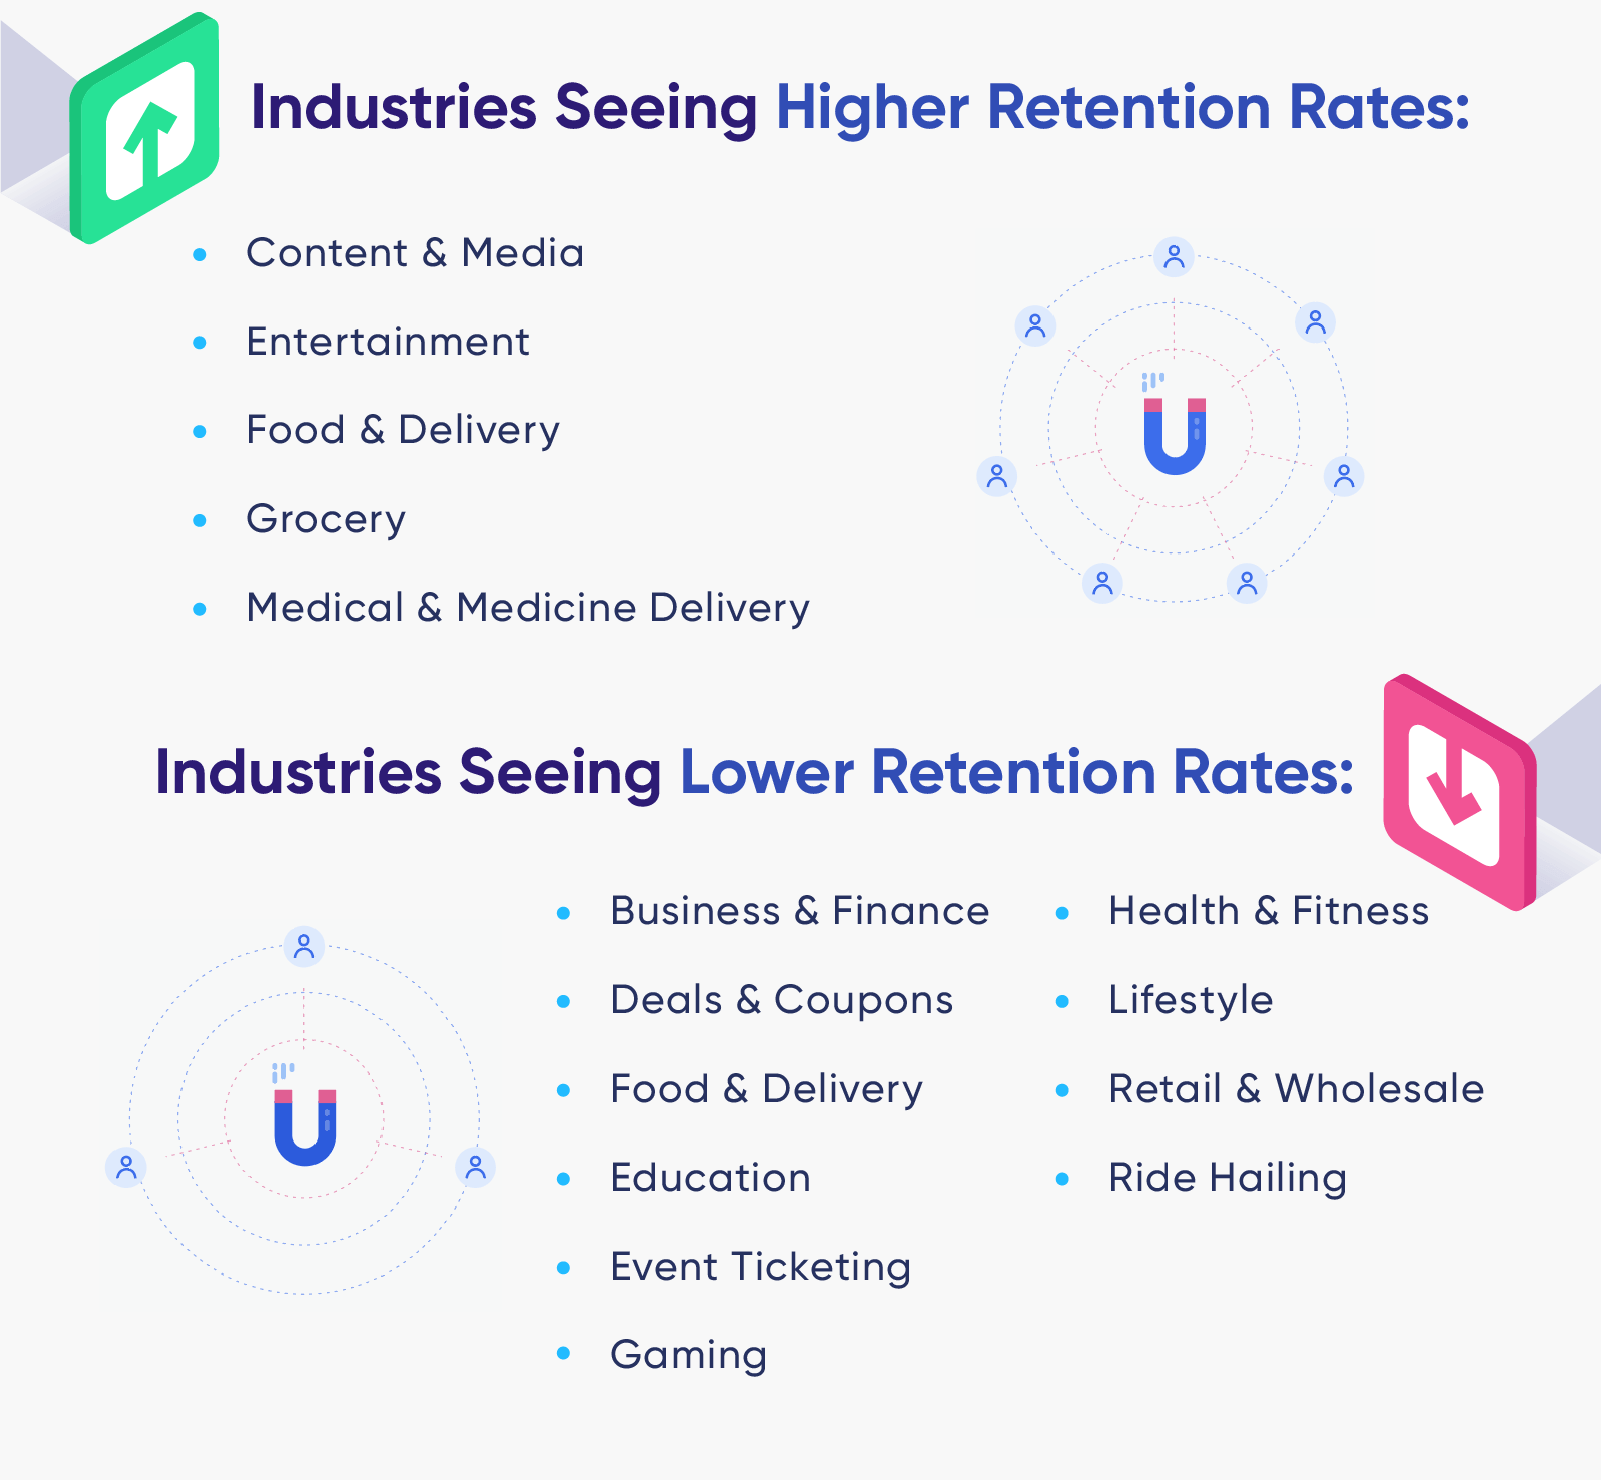
Content & Media apps are enjoying a tremendous surge in user retention: Day 1 retention rates are up 37%, and Day 7 retention jumped up almost 70% over Q1. And while Food & Delivery apps saw a drop in DAUs, retention rates are up in April after a slight dip in March.
As with DAUs, industries seeing the steepest drops in user retention are those involving travel and crowds. Event ticketing apps are seeing a more than 68% drop in Day 1 retention rates, and Day 1 retention for Ride Hailing apps is down 44%.
Interestingly, while Gaming apps are seeing a rise in DAUs, Day 7 retention rates in April are down by 50% compared to February, suggesting users are churning through games quickly and moving on to new content.
Get the Full Report for More Insights
This is just the tip of the iceberg — find a detailed look at KPIs for 17 different mobile industries including Food & Delivery, Gaming, Travel, Retail, and Entertainment/Streaming, plus more must-have benchmarks in the complete data report. And check out our real-time dashboard for interactive graphs and live updates as the year progresses.
Shivkumar M 
Head Product Launches, Adoption, & Evangelism.Expert in cross channel marketing strategies & platforms.
Free Customer Engagement Guides
Join our newsletter for actionable tips and proven strategies to grow your business and engage your customers.
