


Table of Contents
Categories
Most Popular


Net promoter score (NPS) is a customer experience metric used to measure customer loyalty and satisfaction.
In this blog, we’ll define NPS and discuss how to calculate, interpret, and analyze the data. We will also explore strategies to improve your net promoter score and integrate it into the overarching customer experience program to drive customer lifetime value.
Introduced by Fred Reichheld in the 1990s and popularized in a 2003 Harvard Business Review article, NPS quickly gained traction with Bain & Company and Satmetrix. Today, it’s a key business metric tied to growth, with high-NPS companies growing over twice as fast as competitors, making it a “north star” for customer experience strategy.
However, for organizations and brands, the real value NPS drives is when, as a customer satisfaction metric, it is deeply integrated with customer experience design, orchestration, and most importantly, personalization.
– Subharun Mukherjee, VP, Marketing – CleverTap
What is Net Promoter Score (NPS)?
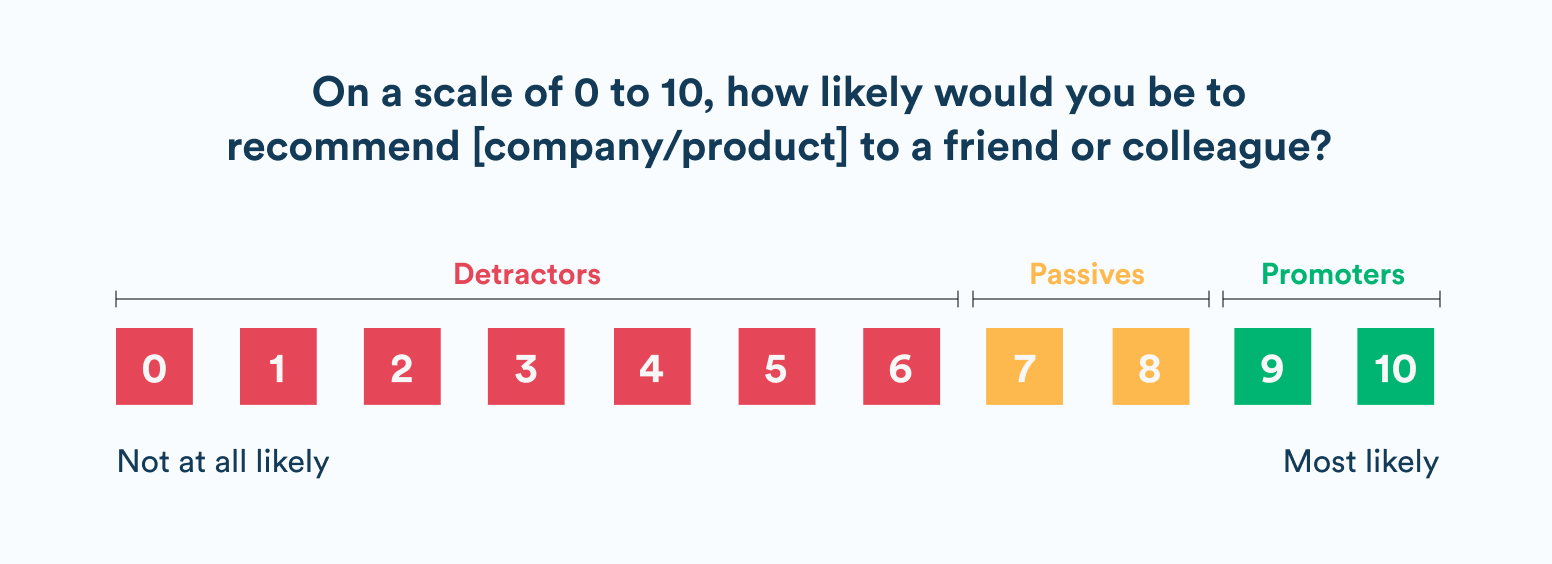
Net promoter score is derived from customers’ responses to a simple question:
“On a scale of 0 to 10, how likely would you be to recommend [company/product] to a friend or colleague?”
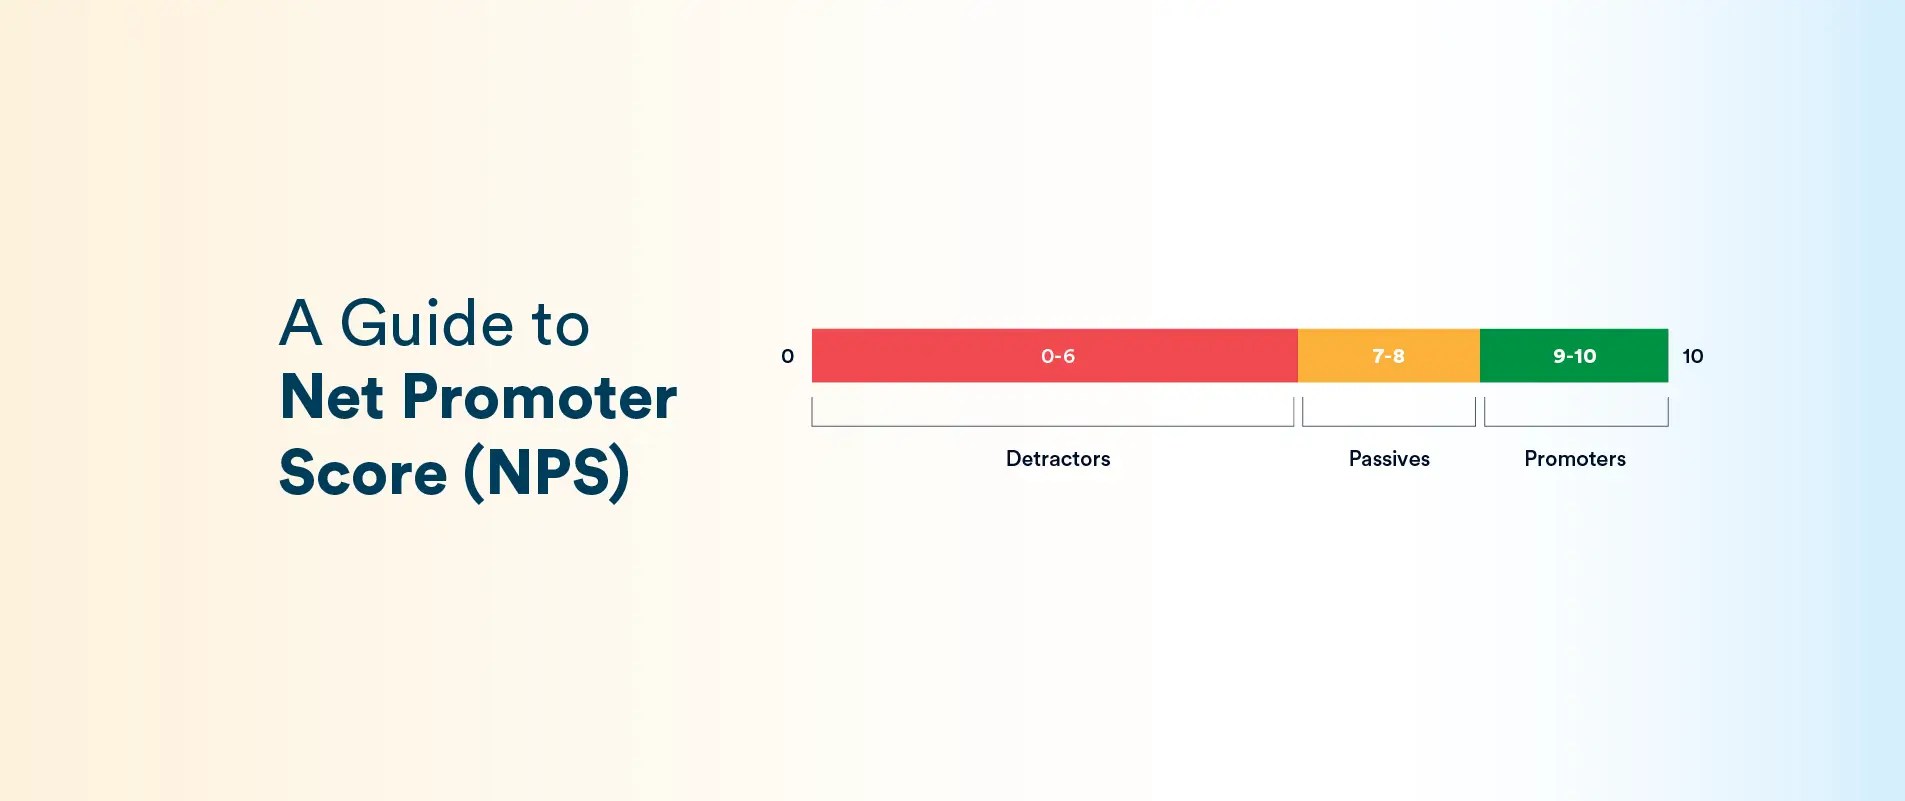
Respondents answer on an eleven-point scale from 0 (Not at all likely) to 10 (Extremely likely). Based on their rating, customers are categorized into three groups:
- Promoters (9-10): Enthusiastic loyalists who love your brand.
They are highly likely to recommend your product or service and are the source of the majority of referrals. These customers have a strong positive relationship with your company and tend to stay longer and contribute more revenue through repeat business or word-of-mouth influence.
- Passives (7-8): Satisfied but unenthusiastic customers who are neutral toward your brand.
They’re generally content but could be swayed by competitive offerings. Passives won’t actively promote your company, and while they aren’t detractors, their lack of strong loyalty means they remain at risk of defection if a better deal comes along.
- Detractors (0-6): Unhappy customers who had a poor experience.
Detractors are unlikely to purchase again and may warn others away from your business. They find fault with your product or service and can damage your brand through negative word-of-mouth. Turning around the experience of detractors is critical, as they have a high propensity to churn and negatively affect your reputation if left unaddressed.
By segmenting respondents into these groups, NPS provides a clear view of customer sentiment distribution. At a glance, a business can gauge how well the customer base is inclined to recommend the brand, which is a strong proxy for customer loyalty and brand advocacy.
Organizational Net Promoter Score (NPS) Calculation
NPS score calculation at the organizational level is simple. Use this formula with the definition of promoters and detractors from above:
NPS = (% of Promoters) – (% of Detractors)
Passives don’t count in the formula, but they influence the overall response base.
Example: If 70% of respondents are Promoters and 10% are Detractors, NPS = 70 – 10 = 60.
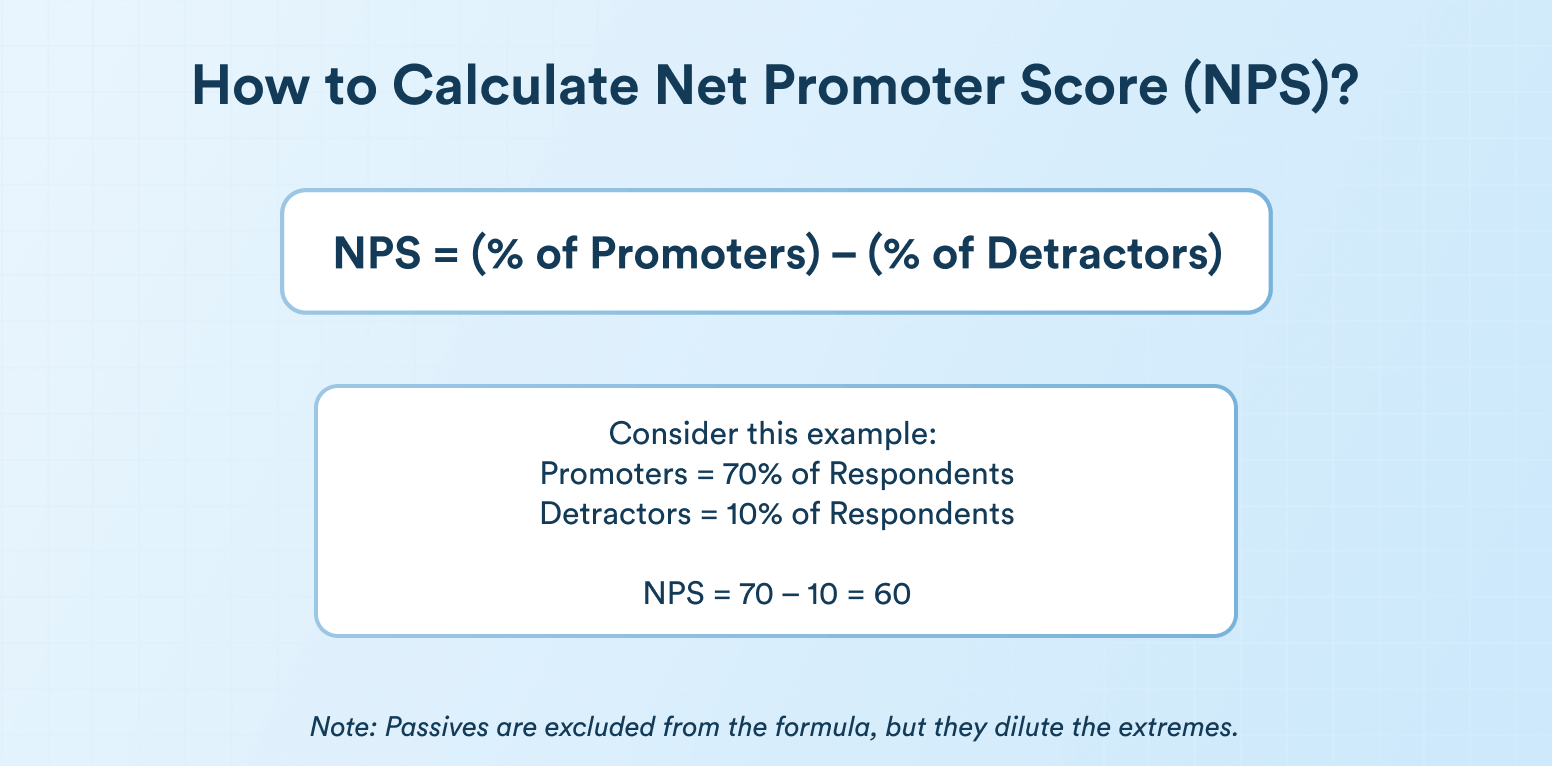
Passives, while excluded from the formula, dilute extremes and pull the score toward neutral. For instance, if Detractors become Passives, your NPS may improve even if Promoters don’t increase.
NPS is widely valued for its simplicity—it turns customer sentiment into a single, actionable number.
The distribution of net promoter scores across customer segments offers a powerful visual representation of satisfaction levels—one that helps growth marketing, product, and customer service teams design more personalized interactions and refine customer experience strategies.
What is a Good Net Promoter Score (NPS)?
What qualifies as a “good” NPS also depends heavily on your industry.
This report from Bain & Company breaks down NPS performance across a wide array of sectors.
| Industry | Benchmark NPS Range | Key Observations |
| Financial Services | Approximately +20 to +40 | Wide variation seen—leaders scoring in the high 30s to 40s, with underperformers in single digits. |
| Retail & Consumer Goods | Approximately +25 to +45 | Top performers often exceed +50; overall, score variation reflects differences in service channels and product quality. |
| Telecommunications | Approximately –10 to +10 | Generally low scores, indicating challenges in customer satisfaction and service delivery. |
| Healthcare | Approximately +20 to +30 | Moderately positive scores that underline the importance of service reliability and trust. |
| Technology & Software | Approximately +40 to +60 | Tend to enjoy high customer loyalty, with many companies scoring well above the industry average. |
Note: These ranges represent the typical spreads observed in the data. See detailed benchmark tables for sub-sector and region-specific nuances.
Key Takeaways
Across industries, companies in the top quartile tend to outperform the industry median by 30–40 points. Higher NPS benchmarks are consistently associated with higher revenue growth, suggesting that even a modest improvement in customer loyalty can yield a strong competitive advantage.
Industries such as technology and software naturally command higher scores, while sectors like telecommunications face systemic challenges that depress overall NPS levels.
By comparing your scores with these industry benchmarks, you can identify performance gaps, set realistic improvement targets, and monitor the impact of customer experience initiatives. The spread in scores demonstrates that investments in service quality, employee engagement, and process improvement can drive substantial gains in customer loyalty.
Transactional vs. Relational Net Promoter Score (NPS)
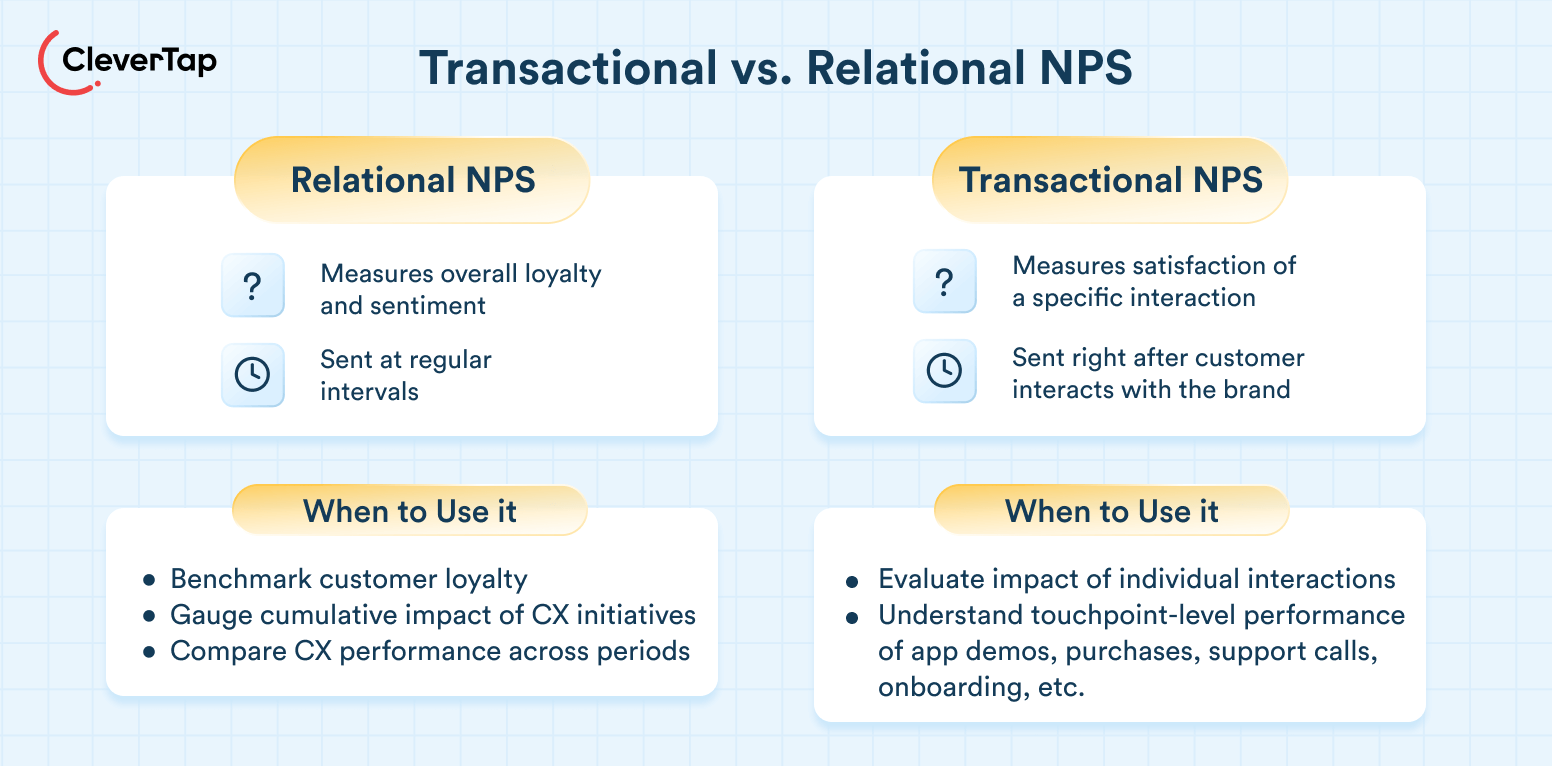
NPS surveys come in two main forms: relational and transactional, each serving a different purpose.
Relational NPS
Relational NPS measures a customer’s overall loyalty and sentiment toward your brand. It’s not tied to any specific interaction but reflects the entire customer relationship. Typically sent at regular intervals (e.g., quarterly or annually), it helps track long-term brand health and customer experience trends.
When to Use It:
Use relational NPS to benchmark customer loyalty over time, gauge the cumulative impact of CX initiatives, or compare performance across periods. It’s ideal for getting a “big picture” view of how customers feel about your company. Avoid sending it immediately after a major event to prevent skewed results.
Transactional NPS
Transactional NPS collects feedback right after a specific customer interaction, like a purchase, support call, or onboarding. It measures the customer’s satisfaction with that particular moment, providing granular insight into touchpoint-level performance.
When to Use It:
Use transactional NPS to evaluate how individual interactions impact customer perception. For example, send it after a product delivery, app demo, or help desk ticket closure. This allows teams to identify and fix issues at key journey stages quickly.
Using Relational and Transactional NPS
Each approach has unique benefits. Relational NPS provides a macro view of brand perception, while transactional NPS offers micro-level insights into the customer journey.
Smart organizations use both: relational NPS to monitor overall loyalty, and transactional NPS to diagnose and optimize specific experiences. Together, they offer a complete picture of customer satisfaction and areas for improvement. They also provide the ability to build actionable insights into segments and microsegments of customers to improve their overall customer lifetime value.
Go Beyond the Score: Personalize Based on the Distribution Across Segments and Microsegments
Once you’ve calculated your NPS, the next step is understanding what the number actually means.
NPS scores range from -100 to +100. Any score above 0 means you have more promoters than detractors—a generally “good” result. Negative scores mean your Detractors outweigh Promoters—something to address quickly.
- 20+ = Favorable
- 50+ = Excellent
- 80+ = World-class
Reaching 80 or more is rare and typically seen in companies with exceptionally loyal customer bases.
Don’t just look at the number—analyze the distribution.
An NPS of +10 could reflect a polarized base (e.g., 40% promoters, 30% detractors) or mostly passive customers. Knowing the mix is critical because each customer base—promoters, detractors, and passives—represents a specific segment of customers.
These segments can be further enhanced and enriched by combining responses from relational and transaction NPS, further creating microsegments that can provide invaluable actionable insights for designing personalized experiences.
What exactly is micro-segmentation? Learn how to use it in marketing.
To get to these actionable insights, there are a number of critical steps, as outlined below.
Step 1 – Implementing Net Promoter Score (NPS) Surveys
Implementing effective NPS surveys requires strategic planning around design, timing, sampling, and distribution. Here are the best practices to follow:
- Keep the NPS Survey Simple and Focused: NPS surveys work best when they’re short and focused—typically one rating question and an optional open-text follow-up. Avoid adding extra questions that can lead to survey fatigue. A concise format yields higher response rates and more reliable data.
- Build Trust: Trust is a critical factor in getting customers to provide any information, even if it is not Personally Identifiable Information (PII). Therefore, provide clear and transparent information about why the information is being collected and why this information will not impact customers in any way. This almost zero-party data collection approach will improve participation.
- Use Neutral Wording: Stick to the standard NPS question. Avoid leading language or suggesting desired responses, which can bias your results.
- Optimize Timing and Frequency: For relational NPS, send surveys at regular intervals when major events don’t skew customer sentiment. For transactional NPS, trigger surveys shortly after specific interactions, such as post-purchase or after a support call, while the experience is still fresh.
- Ensure a Representative Sample: Avoid skewed feedback by surveying a broad cross-section of customers. Use random sampling and multiple channels to reach beyond the most vocal respondents. A higher volume improves statistical confidence. Aim for enough responses to minimize the margin of error.
- Avoid Score-Based Incentives: Encourage participation, but don’t tie rewards to high scores. This distorts data and undermines trust. Instead, focus on framing the ask around honest feedback.
- Use Multi-Channel Immersive Distribution: Reach customers via email, SMS, in-app, or web—whatever fits their preferences. Ensure that the NPS survey is an “immersive” part of the in-flow customer experience by designing and deploying NPS surveys directly within their apps, enabling real-time feedback collection.
Read more about multichannel marketing in our guide.
Step 2 – Analyzing Net Promoter Score (NPS) Feedback
NPS tells you what customers feel—analysis uncovers why they feel that way. This analysis provides actionable insights into the nature and content of the personalization at the segment level.
- Analyze Verbatims: Open-ended responses offer rich qualitative insights. Group comments into categories (e.g., product, service, pricing) to identify recurring themes. For example, promoters may praise usability, while detractors flag support delays. Use text analysis tools to automate coding for larger datasets.
- Identify Drivers of Loyalty and Frustration: Promoters highlight strengths (e.g., great UX, fast delivery), while detractors expose friction points (e.g., bugs, high costs). Passives offer clues on what’s missing. This helps connect NPS scores with real experiences.
- Quantify Key Themes: Assign numbers to recurring issues. For instance, “30% of detractors mentioned pricing.” This adds weight and prioritization to common problems, especially when themes correlate with low scores.
- Segment the Data: Break down NPS by customer type, product, location, or tenure. This is critical when it comes to building microsegments for actioning experiences. You may find new users give lower scores or one region underperforms, revealing where targeted action is needed.
- Cross-Reference Operational Data: Compare NPS with customer behavior. Do detractors churn faster or log more support tickets? Do promoters spend more? Correlating NPS with business KPIs helps prove its value and guide improvement efforts.
- Monitor Trends: Track NPS and feedback themes over time. This shows whether changes you’ve implemented are improving customer sentiment or if new issues are emerging.
- Follow Up Personally: Reach out to detractors to understand their concerns and resolve them—this can prevent churn. Engage promoters to build advocacy. These individual touchpoints can transform sentiment and deepen loyalty.
Step 3 – Build Strategies to Leverage Net Promoter Score (NPS) and Improve the Customer Experience
Once you’ve identified key insights from your NPS data, here are five strategies to turn feedback into measurable improvements.
1. Act on Detractor Feedback
Start with the pain points raised by detractors. Leverage advanced segmentation capabilities to ensure that experiences are designed to address the lapses and these reach the detractors at optimal times, increasing response rates and data relevance. If issues like slow support or buggy features come up often, fix them quickly. Reach out to detractors, acknowledge their concerns, and share what you’re doing to improve. A simple follow-up and resolution, like an apology and a discount—can rebuild trust.
2. Engage and Mobilize Promoters
Promoters already love your brand—turn them into advocates by microsegmenting based on features, offers, or regions. Reward them with perks, invite referrals or testimonials, and make it easy to share reviews. Keep their loyalty strong through continued great service.
3. Convert Passives into Promoters
Passives are neutral but persuadable. Use their feedback to uncover what’s missing, then take targeted action—send incentives, offer extra help, or deliver standout experiences that build enthusiasm. Even small gestures like personal outreach or proactive support can turn a Passive into a Promoter.
4. Improve the Overall Customer Experience
Many NPS improvements come from solving systemic CX issues. Use NPS feedback to inform cross-functional initiatives across growth marketers, product managers, and customer experience teams—better onboarding, streamlined UX, clearer pricing, etc. Share NPS data and verbatims across teams to promote a customer-first culture. Train employees to deliver consistent, excellent service at every touchpoint.
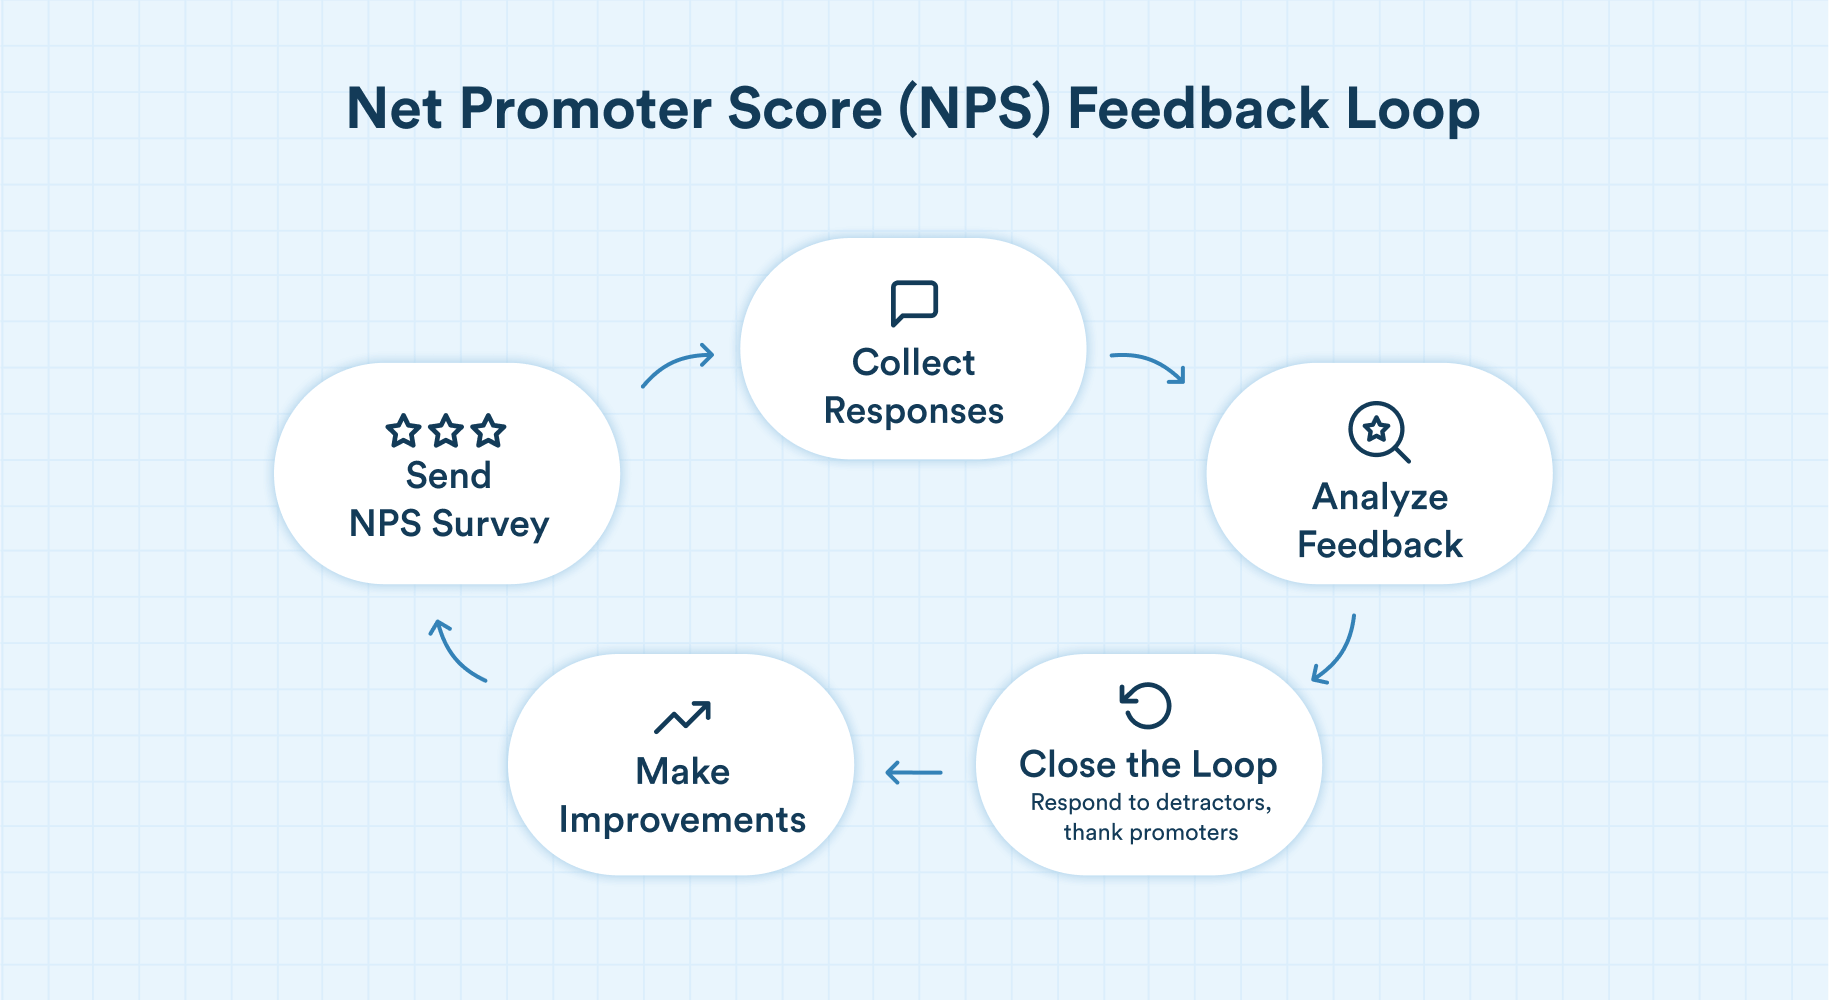
5. Close the Loop and Measure Impact
Follow up after taking action. These actionable insights are critical to design follow-through campaigns that will drive personalized engagement. Track whether your improvements lead to higher NPS in future surveys or lower churn among detractors. Closing the loop—both with customers and internal teams—reinforces accountability and demonstrates that feedback drives change.
Ultimately, NPS improvement is a continuous process. Make it a shared KPI across departments, ensure leadership support, and build a feedback loop that drives retention, advocacy, and sustainable growth.
Limitations and Criticisms of Net Promoter Score (NPS)
While NPS is a widely used metric, it’s not without its flaws. Marketing professionals should know its limitations and avoid treating it as a one-size-fits-all indicator.
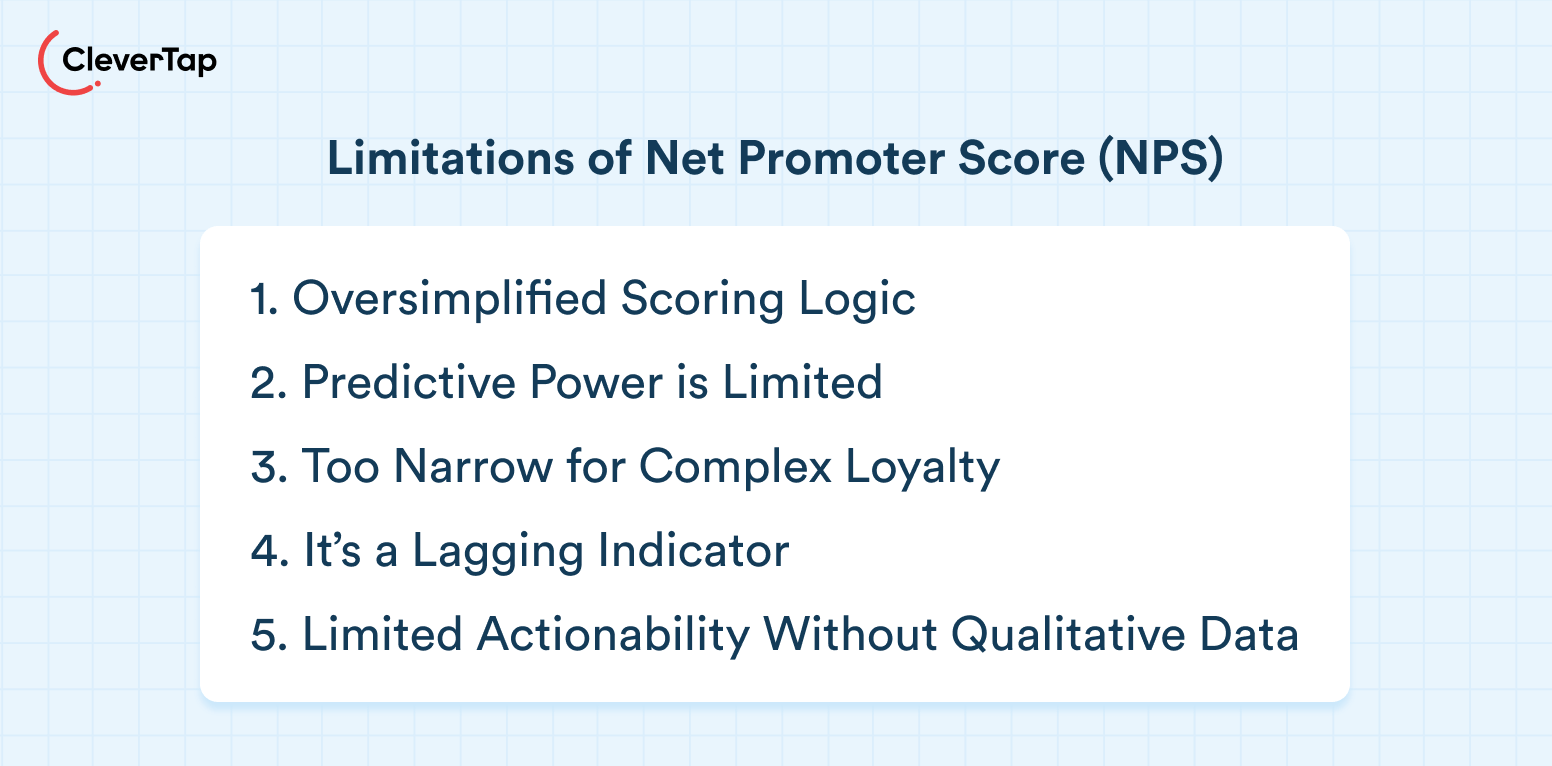
1. Oversimplified Scoring Logic
The 0–10 scale may feel arbitrary, and the way responses are categorized can mask meaningful shifts. For example, moving from a 4 to a 6 feels like improvement, but NPS still classifies both as detractors.
Passives are excluded entirely from the formula, making it insensitive to moderate sentiment changes. Experts suggest using NPS alongside metrics like average satisfaction or top-2-box scores for a fuller picture.
2. Predictive Power is Limited
NPS measures stated sentiment (“likelihood to recommend”), not actual future behavior. A happy customer may still churn, while a passive customer might stay due to a lack of alternatives.
Metrics like retention rate, referral activity, or RFM (Recency, Frequency, Monetary) are often better predictors of loyalty and should be used in conjunction with NPS. Combining NPS with RFM scores can provide deeper insights into customer satisfaction.
3. Too Narrow for Complex Loyalty
Loyalty is multifaceted. It oversimplifies customer sentiment. NPS doesn’t reveal why a customer is loyal or dissatisfied. Adding supplementary questions (e.g., satisfaction, ease of use, repurchase intent) provides more actionable context and helps diagnose issues more effectively.
4. It’s a Lagging Indicator
NPS reflects past experiences, not real-time issues, hence, it is a lagging indicator. Feedback often comes too late to prevent churn. To counter this, companies must combine NPS with real-time tools like customer support trends, behavioral analytics, or session tracking to flag emerging problems earlier.
5. Limited Actionability Without Qualitative Data
The NPS number alone doesn’t guide improvement. Without open-ended responses, it’s hard to know what to fix. Teams that focus only on the score may treat it as a vanity metric. Worse, if tied to bonuses, it can be gamed (e.g., pressuring for 10s or avoiding surveying unhappy customers). NPS should be used as a learning tool, paired with verbatim analysis to drive action.
NPS is valuable as a high-level loyalty metric, but it has real shortcomings. Don’t over-rely on it—use it alongside other KPIs and qualitative insights for a complete customer experience strategy.
Integrating Net Promoter Score (NPS) with Other Customer Experience Metrics
To understand the complete customer experience, it’s essential to integrate NPS with other key metrics like customer satisfaction (CSAT) and customer effort score (CES).
NPS vs. CSAT
CSAT measures satisfaction with a specific interaction (e.g., “How satisfied were you with your recent support call?”). It’s transactional and focused on recent events. NPS, by contrast, measures overall loyalty—how likely a customer is to recommend your brand based on cumulative experiences.
For example, a customer might report high CSAT after a resolved issue, but still give a low NPS if the product overall has caused recurring problems. Used together, CSAT helps identify immediate service gaps while NPS tracks long-term brand sentiment.
NPS vs. CES
CES gauges how easy it was for a customer to complete a task—like getting help or making a return. A high CES (meaning low effort) is closely tied to loyalty.
For example, a customer might love your product (NPS) but still be frustrated if support is hard to access (low CES). Using CES alongside NPS helps diagnose friction points that could eventually hurt loyalty.
Why Combine Them
Together, NPS, CSAT, and CES create a more comprehensive CX strategy. NPS tracks advocacy and loyalty, CSAT pinpoints satisfaction with specific touchpoints, and CES highlights friction in the customer journey. You can better prioritize improvements by comparing scores and analyzing shared feedback themes.
For instance, low CES and NPS scores around returns might signal an opportunity to streamline that process.
Ultimately, no single metric tells the full story. Used in tandem, NPS, CSAT, and CES help marketers identify both quick wins and long-term CX opportunities.
How CleverTap Helps You Execute and Track Net Promoter Score (NPS) Surveys
CleverTap offers a comprehensive solution for executing and tracking net promoter score (NPS) surveys directly within its platform, streamlining the process of gathering and acting on customer feedback.
Key Features of CleverTap’s NPS Survey Capabilities:
Integrated NPS Templates: CleverTap provides customizable NPS survey templates within its in-app messaging, web pop-up, and other channels. These templates allow you to tailor the surveys and their content to align with your brand’s guidelines, including modifying the rating scale, labels, and overall design.
Seamless Campaign Creation: Setting up a net promoter score campaign is straightforward. For instance, you can trigger an NPS survey after a user completes a purchase by selecting the appropriate event (e.g., “Order Confirmation Viewed”) as the trigger and choosing the ‘NPS Ratings’ template. This ensures that feedback is collected contextually, enhancing the relevance and accuracy of responses. Therefore, it provides the capability to drive transactional NPS in addition to relational NPS.
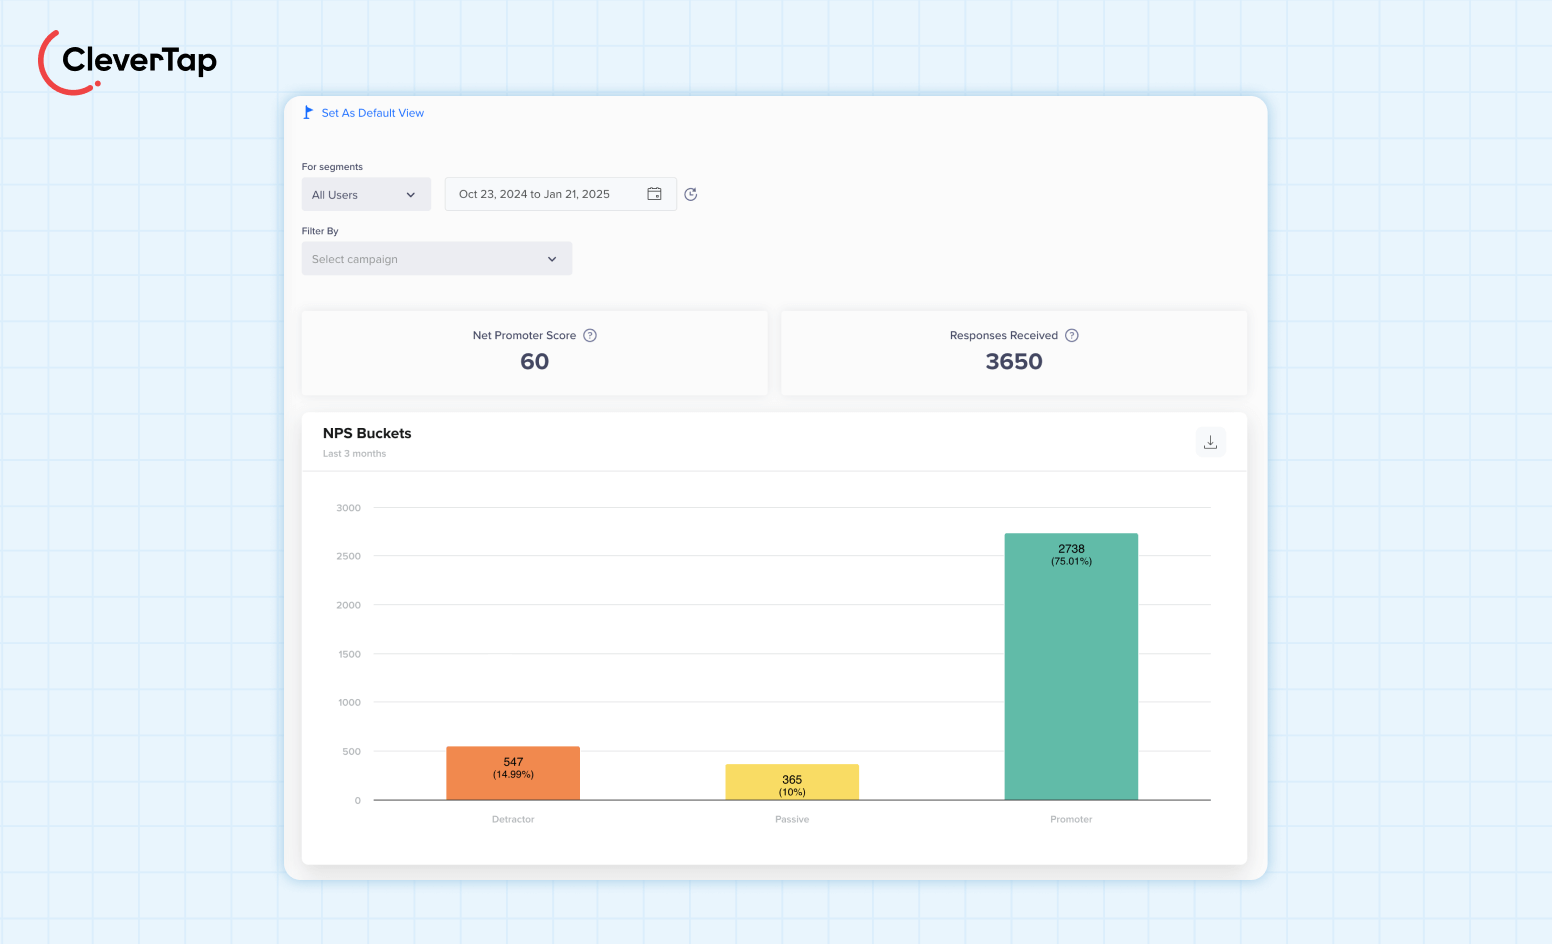
Real-Time Analytics and NPS Board: CleverTap’s NPS Board offers a detailed view of collected feedback, displaying overall net promoter scores, total responses, and trends over time. This real-time analytics capability enables you to monitor customer sentiment continuously and make data-driven decisions to enhance customer satisfaction.
Closing the Feedback Loop: Beyond collecting NPS data, CleverTap empowers you to act on the feedback by segmenting users based on their scores (Promoters, Passives, Detractors) and engaging them with personalized campaigns across multiple channels. This approach helps nurture promoters, address detractors’ concerns, and ultimately improve customer loyalty.
Integrating NPS surveys within CleverTap’s platform eliminates the need for external survey tools, ensuring a more efficient and cohesive approach to customer feedback management. This integration facilitates immediate action on insights gained, fostering a culture of continuous improvement and customer-centricity.
Discover how CleverTap makes it easy for you to track NPS surveys.
How Parco Used Customer Segmentation Insights to Boost Net Promoter Score (NPS)
Parco, a mobility app focused on urban parking, faced a key challenge: understanding how users felt about their experience and identifying friction points in the user journey. Without clear feedback mechanisms, the team lacked actionable insights to improve retention and loyalty.
To solve this, Parco integrated CleverTap’s NPS surveys into its user engagement strategy. By deploying in-app NPS prompts, the team gathered direct user sentiment in real time. CleverTap’s segmentation tools allowed them to group users by NPS score and deliver tailored messaging to each group. Promoters were nurtured for advocacy, while Detractors received targeted support to resolve issues and win back trust.
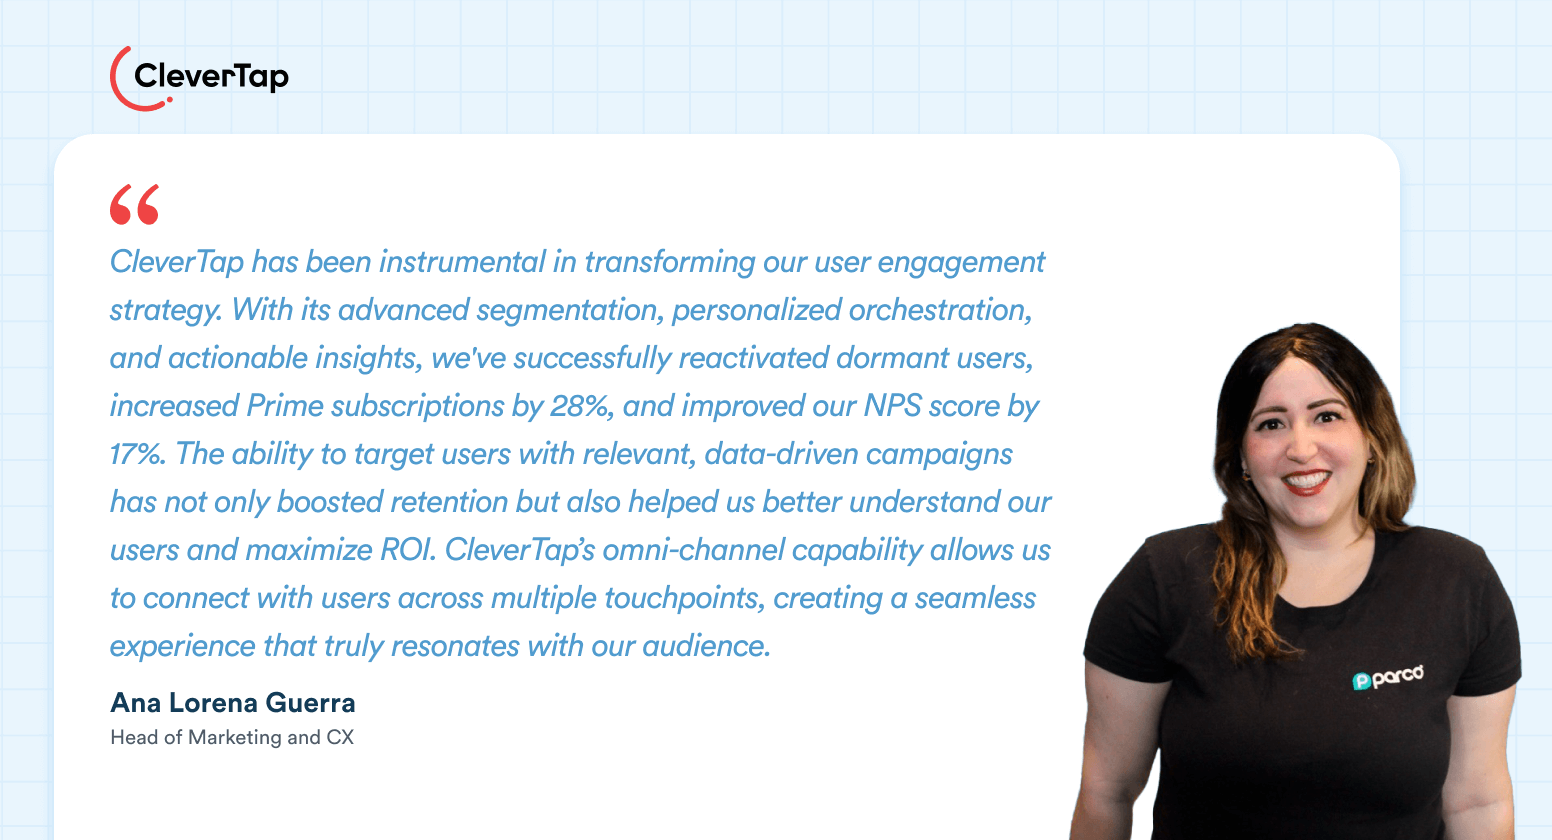
Results: +17% NPS Increase and Higher Retention
The insights from NPS surveys helped Parco fine-tune its app experience and communication strategy. Within months, Parco achieved a 17% increase in net promoter score, signaling improved customer satisfaction. With CleverTap’s automation and personalization, they also enhanced retention and reduced user churn, turning sentiment data into a powerful driver of growth.
Download the full case study here.
Net Promoter Score (NPS) is a Feedback Mechanism
NPS, when used as a feedback mechanism, can be used to generate actionable insights and drive empathatic personalization in customer experience design. When paired with deeper insights, it helps marketers identify issues, enhance experiences, and turn feedback into action, ultimately improving retention, satisfaction, and advocacy across the entire customer journey.
Shivkumar M 
Head Product Launches, Adoption, & Evangelism.Expert in cross channel marketing strategies & platforms.
Free Customer Engagement Guides
Join our newsletter for actionable tips and proven strategies to grow your business and engage your customers.
