As mobile marketers, we make decisions every day based on data. These decisions lead users to keep using our apps or uninstall them. Which is why we have to think clearly when facing data and watch out when seeing possible correlation vs causation issues.
There’s been a steady move in the past decade for organizations to favor data-driven decisions. It’s the thinking that, without evidence, there’s no real basis for a decision. This makes it even more critical to use statistics as a tool that gives insight into the relationships between factors in a given analysis. Statistics helps you differentiate the correlations from the causations.
Correlation vs Causation Example
My mother-in-law recently complained to me: “Whenever I try to text message, my phone freezes.” A quick look at her smartphone confirmed my suspicion: she had five game apps open at the same time plus Facebook and YouTube. The act of trying to send a text message wasn’t causing the freeze, the lack of RAM was. But she immediately connected it with the last action she was doing before the freeze.
She was implying a causation where there was only a correlation.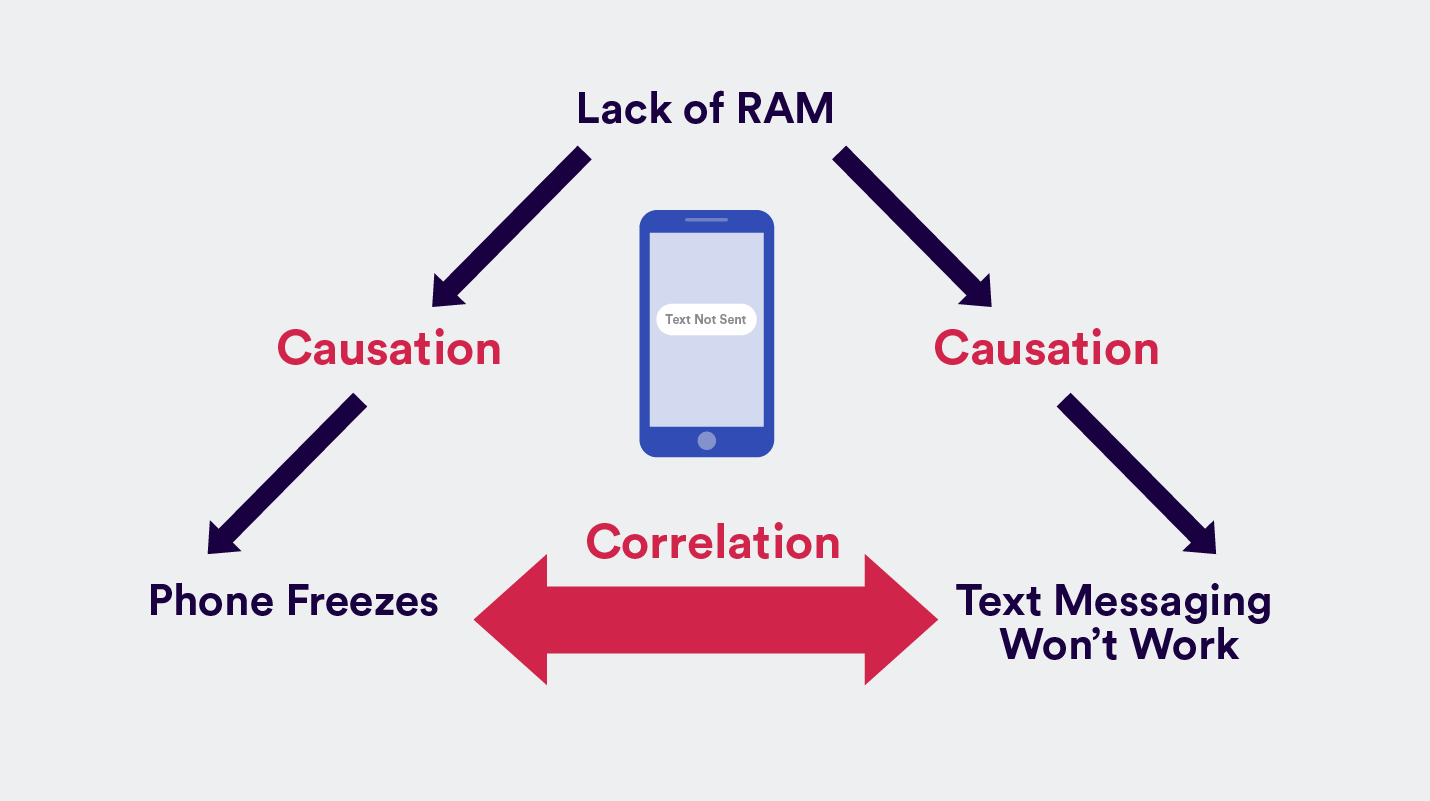
Correlation and Causation Examples in Mobile Marketing
Correlations are everywhere. As conspiracy theory debunkers like to say: “If you look long enough, you’ll see patterns.”
In the same way, if you look long enough, you may begin to see cause-and-effect relationships in your mobile marketing data where there is only correlation. We try to find a reason why A and B occur at the same time.
See if you can spot which is which in these correlation and causation examples below:
- New web design implemented >> Web page traffic increased
Was the traffic increase because of the new design (causality)? Or was traffic simply up organically at the time when the new design was released (correlation)? - Uploaded new app store images >> Downloads increased by 2X
Did downloads increase because of the new images in your app stores? Or did they just happen to occur at the same time? - Push notification sent every Friday >> Uninstalls increase every Friday
Are people uninstalling your app because of your weekly push notifications? Or is some other factor at play? - Increase in links to your website >> Higher ranking in search engine results
Does the increase in links directly cause the better search ranking? Or are they merely correlated?
To better understand correlation vs causation, let’s begin by defining terms.
The Art of Onboarding Mobile App Users
What is Correlation?
Correlation is a term in statistics that refers to the degree of association between two random variables. So the correlation between two data sets is the amount to which they resemble one another.
If A and B tend to be observed at the same time, you’re pointing out a correlation between A and B. You’re not implying A causes B or vice versa. You’re simply saying when A is observed, B is observed. They move together or show up at the same time.
There are three types of correlations that we can identify:
- Positive correlation is when you observe A increasing and B increases as well. Or if A decreases, B correspondingly decreases. Example: the more purchases made in your app, the more time is spent using your app.
- Negative correlation is when an increase in A leads to a decrease in B or vice versa.
- No correlation is when two variables are completely unrelated and a change in A leads to no changes in B, or vice versa.
Just remember: correlation doesn’t imply causation. It can sometimes be a coincidence. And if you don’t believe me, there is a humorous website full of such coincidences called Spurious Correlations.1 Here’s an example: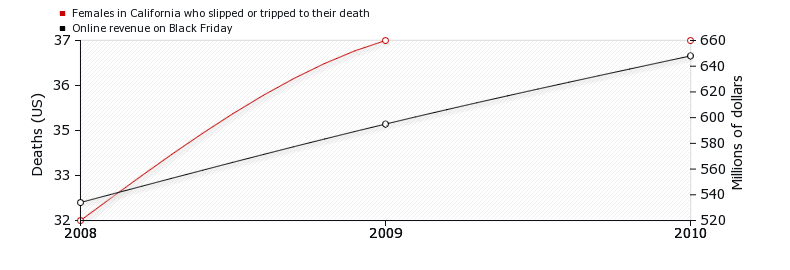
What is Causation?
Causation is implying that A and B have a cause-and-effect relationship with one another. You’re saying A causes B.
Causation is also known as causality.
- Firstly, causation means that two events appear at the same time or one after the other.
- And secondly, it means these two variables not only appear together, the existence of one causes the other to manifest.
Correlation vs. Causation: Why The Difference Matters
Knowing the difference between correlation and causation can make a huge difference – especially when you’re basing a decision on something that may be erroneous.
Say, you’re wondering whether the last month’s increase in monthly active users has been caused by the recent App Store optimization efforts, it makes sense to test this in order to say for sure whether it’s a correlation or a causation.
Correlation vs Causation: How to Tell if Something’s a Coincidence or a Causality
So how do you test your data so you can make bulletproof claims about causation? There are five ways to go about this – technically they are called design of experiments.** We list them from the most robust method to the weakest:
1. Randomized and Experimental Study
Say you want to test the new shopping cart in your ecommerce app. Your hypothesis is that there are too many steps before a user can actually check out and pay for their item, and that this difficulty is the friction point that blocks them from buying more often. So you’ve rebuilt the shopping cart in your app and want to see if this will increase the chances of users buying stuff.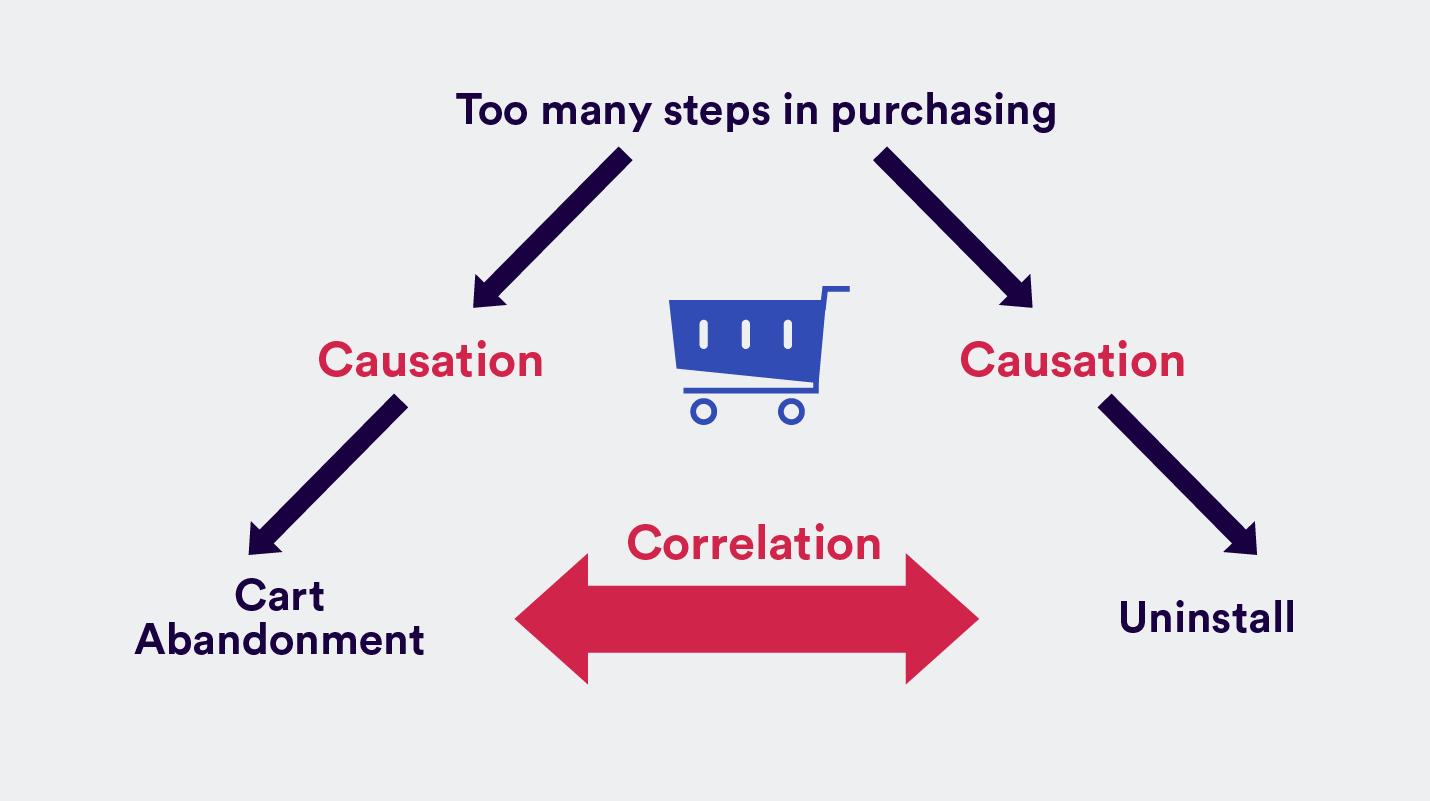
The best way to prove causation is to set up a randomized experiment. This is where you randomly assign people to test the experimental group.
In experimental design, there is a control group and an experimental group, both with identical conditions but with one independent variable being tested. By assigning people randomly to test the experimental group, you avoid experimental bias, where certain outcomes are favored over others.
In our example, you would randomly assign users to test the new shopping cart you’ve prototyped in your app, while the control group would be assigned to use the current (old) shopping cart.
After the testing period, look at the data and see if the new cart leads to more purchases. If it does, you can claim a true causal relationship: your old cart was hindering users from making a purchase. The results will have the most validity to both internal stakeholders and other people outside your organization whom you choose to share it with, precisely because of the randomization.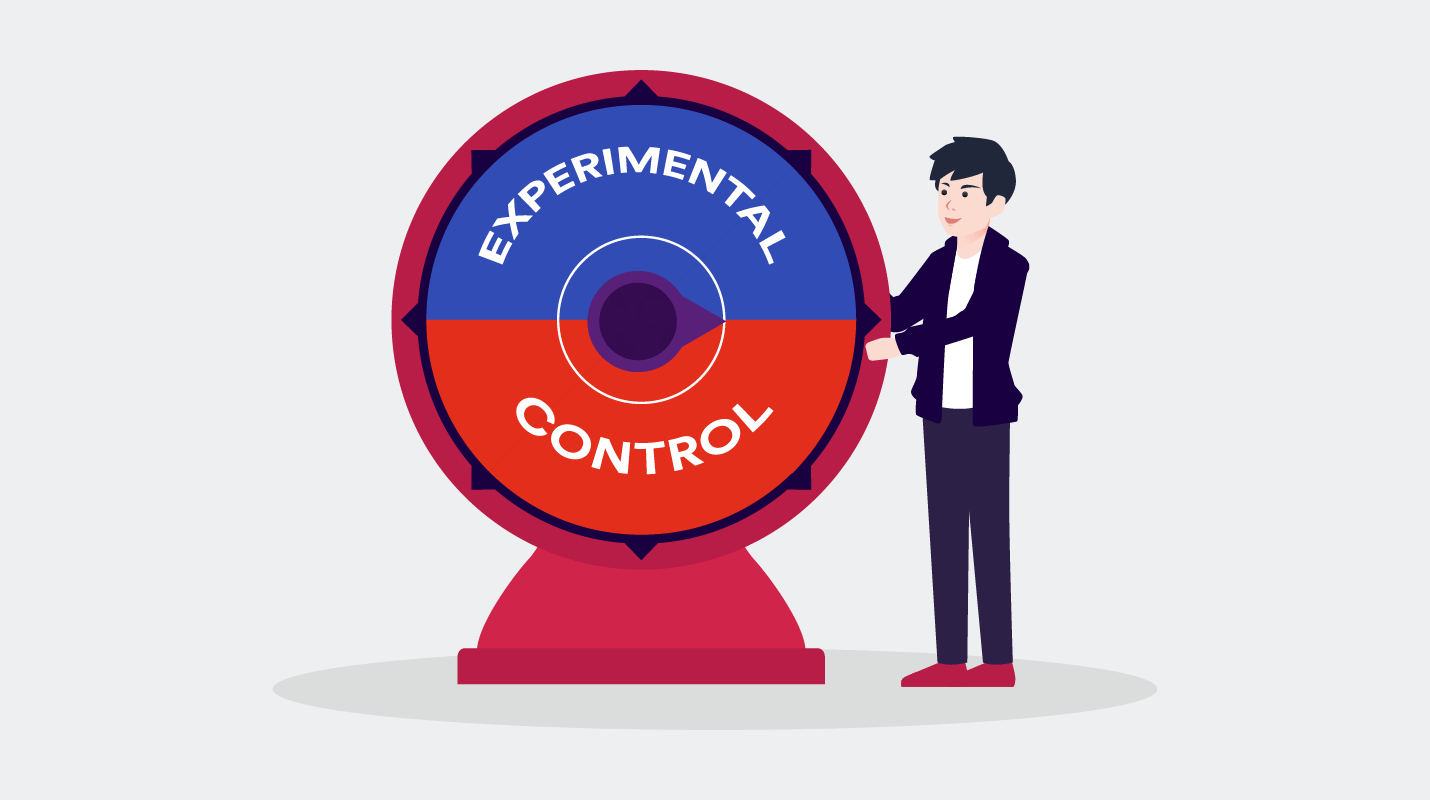
2. Quasi-Experimental Study
But what happens when you can’t randomize the process of selecting users to take the study? This is a quasi-experimental design. There are six types of quasi-experimental designs, each with various applications. 2
The problem with this method is, without randomization, statistical tests become meaningless. You cannot be totally sure the results are due to the variable or to nuisance variables brought about by the absence of randomization.
Quasi-experimental studies will typically require more advanced statistical procedures to get the necessary insight. Researchers may use surveys, interviews, and observational notes as well – all complicating the data analysis process.
Let’s say you’re testing whether the user experience in your latest app version is less confusing than the old UX. And you’re specifically using your closed group of app beta testers. The beta test group wasn’t randomly selected since they all raised their hand to gain access to the latest features. So, proving correlation vs causation – or in this example, UX causing confusion – isn’t as straightforward as when using a random experimental study.
While scientists may shun the results from these studies as unreliable, the data you gather may still give you useful insight (think trends).
3. Correlational Study
A correlational study is when you try to determine whether two variables are correlated or not. If A increases and B correspondingly increases, that is a correlation. Just remember that correlation doesn’t imply causation and you’ll be alright.
For example, you decide you want to test whether a smoother UX has a strong positive correlation with better app store ratings. And after observation, you see that when one increases, the other does too. You’re not saying A (smooth UX) causes B (better ratings), you’re saying A is strongly associated with B. And perhaps might even predict it. That’s a correlation.
4. Single-Subject Study
Single-subject design is more often used in psychology and education, as it is concerned with an individual subject. Instead of a control and experimental group, the subject serves as his or her own control. The researcher is concerned about attempting to change the individual’s behavior or thinking.
In mobile marketing, a single-subject study might take the form of asking one specific user to test the usability of a new app feature. You can have them do one action several times on the current app, then have them try the same action on the new app version. Collect the data and see if the action is done faster on the old or new app.
Obviously, this design is using data from one user. His or her experience cannot be generalized to all your users no matter how perfect a fit to your ideal customer persona. That’s one reason why this type of study is rarely used in marketing.
5. Stories
Anecdotes, sadly, are sometimes all the proof we have to establish causation. You might come across:
- Support staff: “Customers think the new user interface is tough to use. That’s why they’re uninstalling.”
- Customer X on Twitter: “We tried to buy a product on your app and it’s making my phone crash!”
The problem here is: while they could have a valid pain point and might make it in a convincing (and highly emotional) manner, these stories do not prove without a doubt that A causes B. They’re really just stories at this point, and carry less weight than the other options above.
Correlation vs Causation in Mobile Analytics
So what have we learned from all these correlation and causation examples? There are ways to test whether two variables cause one another or are simply correlated to one another.
If you’re serious about establishing a causal relationship, then you’ve got to use the testing method that gives your data and results the most validity. Start with the random experimental design and work your way downwards. And always watch how you think or even verbalize your predictions.
There’s a Latin phrase that goes: “Post hoc, ergo propter hoc,” which means: “After this, therefore because of this.” The idea is that by communicating one statement before the other, you imply that the previous caused the latter to happen. (“He rated my app zero stars. No one has downloaded my app.”) The reality is it could just be a correlation or a pure coincidence.

See how today’s top brands use CleverTap to drive long-term growth and retention
Shivkumar M 
Head Product Launches, Adoption, & Evangelism.Expert in cross channel marketing strategies & platforms.
Free Customer Engagement Guides
Join our newsletter for actionable tips and proven strategies to grow your business and engage your customers.


