


Table of Contents
Categories
Most Popular


Scientists have a method to their madness, conveniently known as the scientific method. Any experimenter worth their salt will metaphorically season their experiment with what we in the business call a control group.
So, what is a control group, scientifically speaking?
A control group is a statistically significant portion of participants in an experiment that are shielded from exposure to variables. In a pharmaceutical drug study, for example, the control group receives a placebo, which has no effect on the body.1
Since there is a lot of room for error within the scientific method, having a control group present is vital for accurate analysis. One common source of error within experimentation is confirmation bias.
Confirmation bias is the tendency for experimenters to give their expected outcome too much weight when measuring results, leading to inaccurate findings.
This may lead you to wonder, how are control groups used in fields other than the physical sciences? And, how does a control group help combat biases?
Learn more about what a control group is or jump to our infographic for a visual guide to use control groups in A/B testing.
Control Group Example

Let’s say, for example’s sake, a mobile marketing executive believed that push notifications were intrusive and detrimental to the company’s goals (blasphemy!). The executive decides to run an experiment to prove that push notifications do not increase engagement. Currently, users receive three push notifications every day on average.
The test is established to send half of the app’s users a push notification every hour on the hour. The other half of users will not receive any push notifications at all.
After the test runs for 30 days, the executive analyzes the results and notices that there was no statistically significant improvement on engagement from the users who received push notifications. The data seems to confirm his hypothesis that push notifications are not accomplishing the company’s goals.
This executive failed to implement a control group—in addition to running the risk of confirmation bias. A control group would have been a segment of users that would experience neither an increase in push notifications or the complete suspension of push notifications.
The control group would have continued to receive push notifications at the average rate of three per day. Comparing test results to this constant would have highlighted the true impact of halting a push notification campaign.
Control Groups in A/B Testing
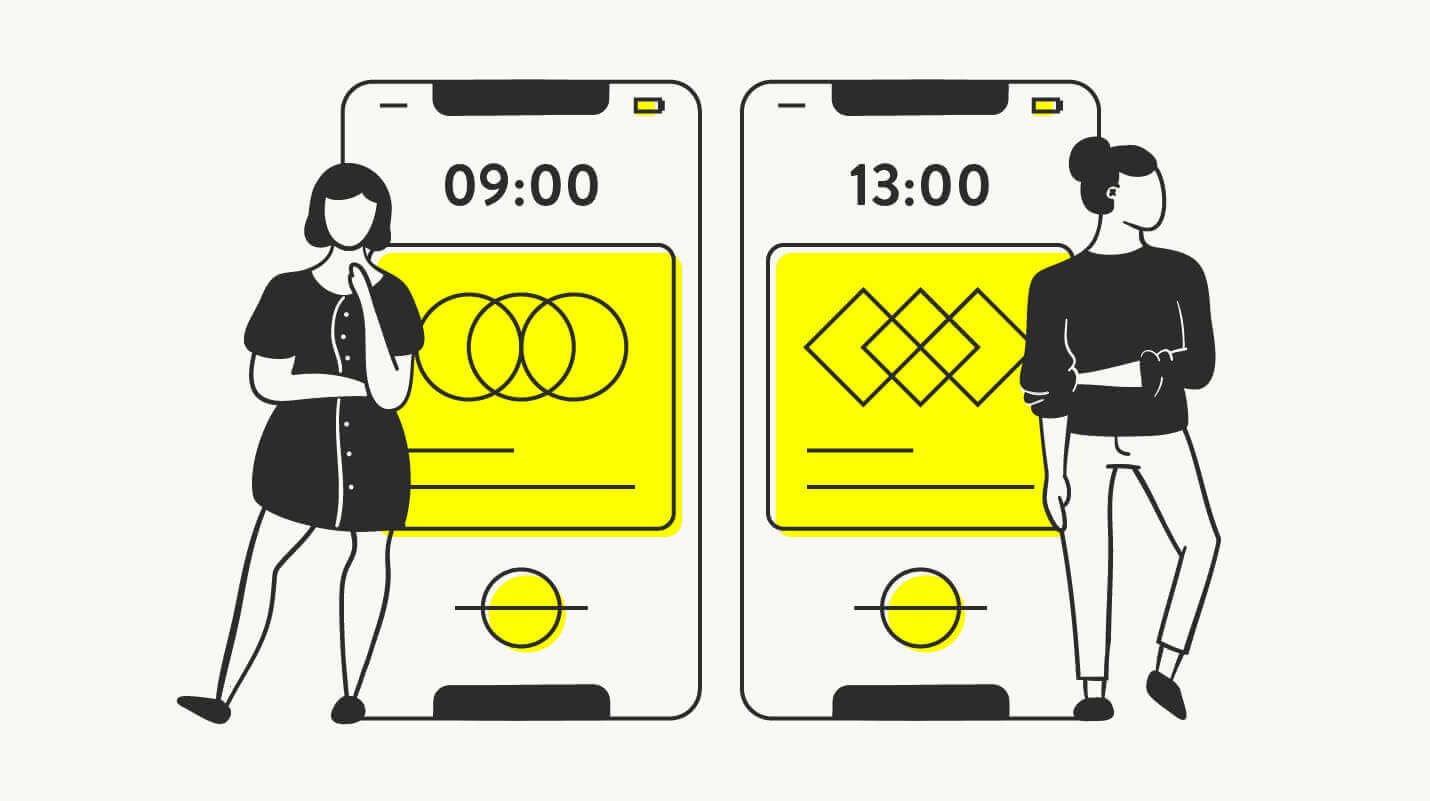
Usually, an A/B test compares two variations of an advertisement, feature, message, or other user experience. A control group is one aspect of A/B testing that is often overlooked. It’s almost as if A/B testing should really have been called A/B/C testing, the “C” standing for the control group.
Any software business seeking the winning solution for a new implementation should use A/B testing, absolutely. But where businesses fail in this process is to measure against a benchmark.
In the case of software testing, a control group would be that benchmark. Almost a precursor to the axiom, “if it ain’t broke, don’t fix it,” a control group will determine if it indeed “ain’t broken.”
Control Groups in Multivariate Tests
It’s great when an A/B test reveals a better performing call to action, but what if you want to test multiple variables to determine the best performing combination?
For the sake of identifying which variable may have caused a boost in success, isolating different variables across many variations is a higher level of A/B testing, which is where multivariate testing comes in.
When implementing multivariate testing, multiple variables are analyzed within many combinations, or variations, of the experiment in question.
For example, a mobile media company wants to test the best-converting rich push notification, considering the image, text, and time of day. If they were testing 2 variations of images, 2 variations of copy, and 2 delivery times, running a multivariate test could analyze the best-converting combination. The test would send each segment of users a push notification with only one variable being different.
In this example, the first segment would get image 1, copy 1, and delivery time 1. The second segment would get image 1, copy 1, and delivery time 2. The third segment would get image 1, copy 2, delivery time 1, and so on until all possible combinations have been tested.
Multivariate tests are effective for narrowing in on the best possible combination of variables, but only under the right conditions. To ensure that the results are statistically significant, the population size must be large enough for each combination tested to reach a reliable number of users.2 Another concern is the length of experimentation, as you cannot expect to run a multivariate test for just one day and get actionable data.
Why Use a Control Group? (Hint: It’s Important)
If you’ve never used a control group within your mobile marketing tests, you might not understand its importance. Running an A/B test is easy and the immediate gratification in discovering one variation outperforming another feels rewarding, but what benchmark are you measuring this performance against? 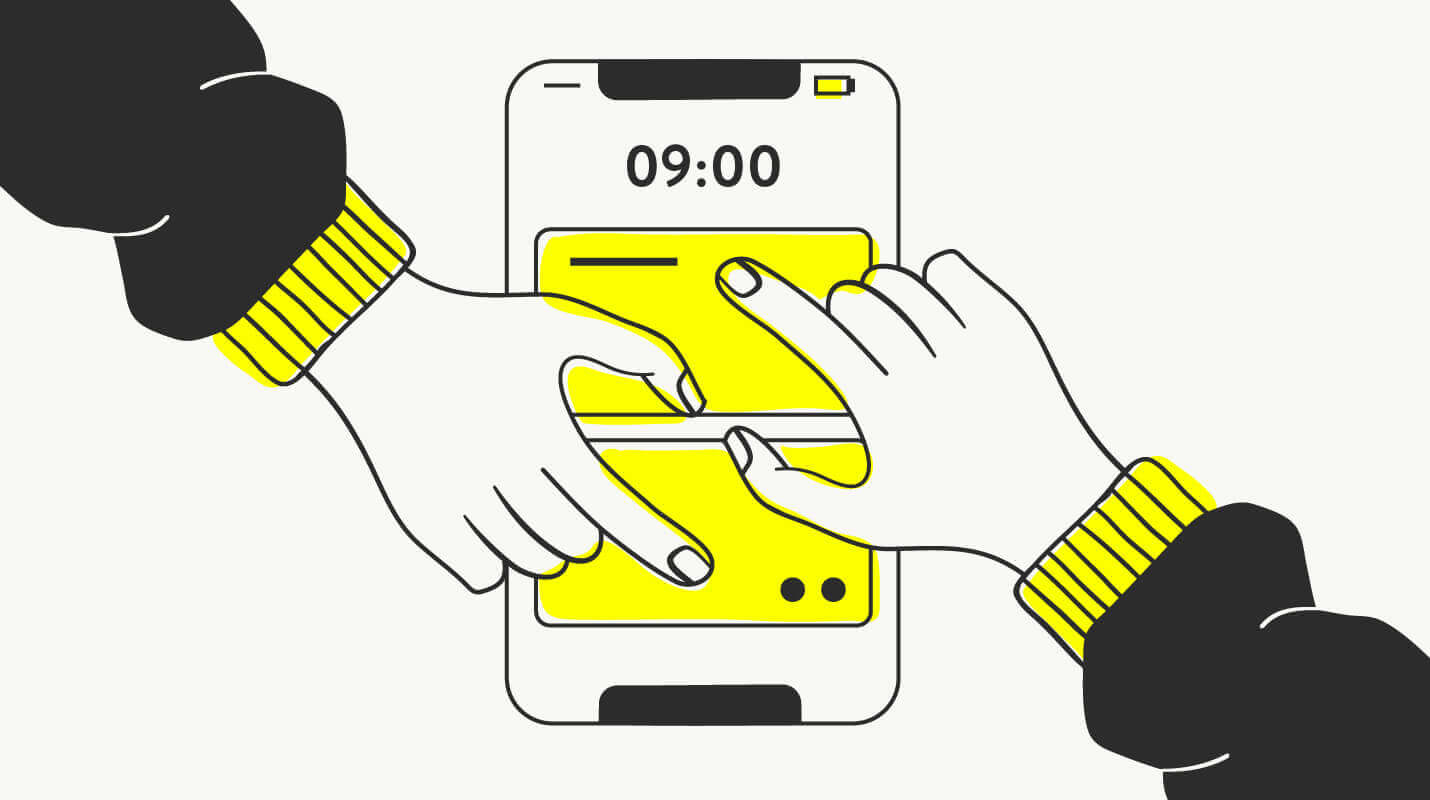
Not implementing a control group in marketing is analogous to not tracking portfolio performance compared to the broader market index when investing. A control group highlights what works as much as what doesn’t.
Control Group vs. Control Variable
When testing marketing campaigns, it’s not uncommon for people to confuse a control group with a control variable.
As you now know, a control group is a segment of participants (users) who are not exposed to any variables being tested. A control variable, on the other hand, is the aspect of the actual experiment that does not change.3
As an easy example of a control variable, let us assume researchers on the marketing team are interested in finding the best call to action copy for their exit intent popup message.
Best practice for testing variables is to keep all other variables constant, otherwise known as controlled variables. Images, colors, and buttons would all remain the same while each copy variation is tested, increasing the accuracy of results.
Control Group Segmentation

How big should a control group be?
The tradeoff between confidence levels in the results and opportunity cost of implementing a more successful variation should not be taken lightly.
The size of the control group, or any test group for that matter, depends on the size of the total population. If the experiment is run on a population size of only 100 participants, a 5% control group would be only 5 individuals, which would certainly diminish the significance of the results.
If the desired confidence level for the test is 95% and the minimum acceptable margin of error is 5%, the control group will need to be larger, about 20% for the 100 participant example above.
Some people would argue the control group should be equal to the other segments being tested. For example, if two variations were to be tested against a control, each variation would be tested on 33% of the total population of participants.
With any experiment, there will be a margin for error. Therefore no test results will ever garner 100% confidence levels. The size of your control group will depend on your willingness to accept a certain margin of error and the minimum viable confidence level for your testing.
Measuring Control Group Effectiveness
Measuring the success of experiments in mobile marketing and having confidence in the results depends on a number of factors. As we discussed, the size of your test groups will indicate the statistical significance and the margin of error, or room for misleading results, you can expect in your outcomes.
An important factor when measuring the effectiveness of a control group is the uniformity of samples. Ensuring the control group is both random and representative of the entire population will lead to more dependable results.
A chi-squared statistic can reveal differences between the observed results and the results you would expect if there was no relationship in the data.4 A simple example of this would be the expectation of variations to have zero impact on conversion rate, all tested variables would result in the exact same conversion rate, and chi-square would also be zero.
A chi-square test determines whether variations are statistically different from the data, in other words, is there a relationship between the variable and the results? A low chi-square value means there exists a high correlation between the data, conversely, a high chi-square value signals low correlation.
Before testing for chi-square values, you must understand the desired alpha level. The alpha level refers to the probability of a positive result falls outside of the population parameter. In other words, what is the likelihood a positive signal is viewed as a negative signal?
Including a control group in experimentation is not just recommended for mobile marketing tests, it is essential for statistical significance. As you move forward, challenge your marketing team to run more sophisticated tests and measure the results against a control group.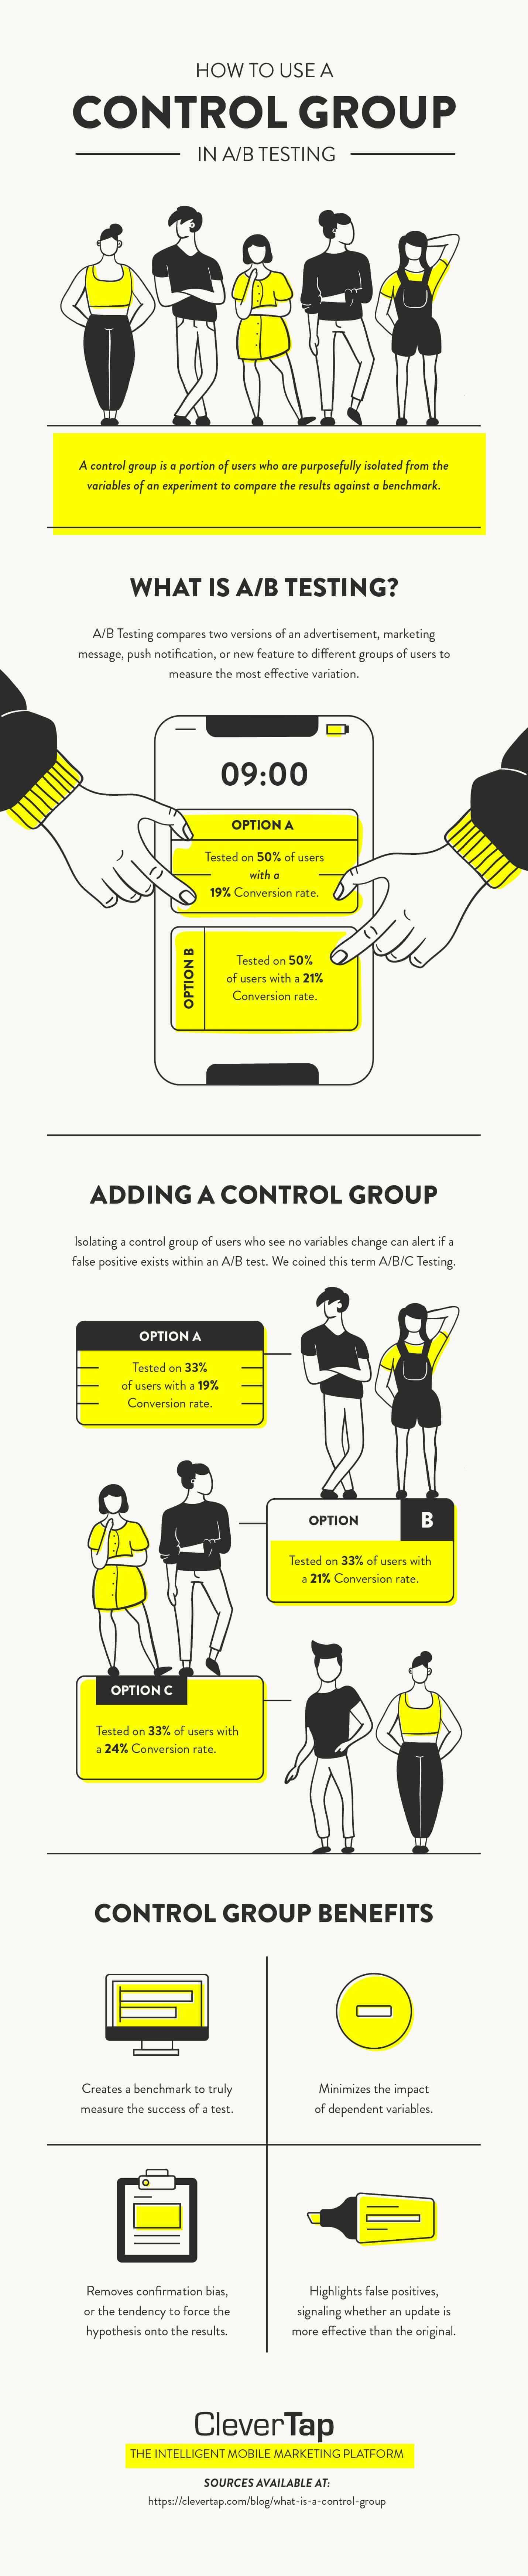

See how today’s top brands use CleverTap to drive long-term growth and retention
Subharun Mukherjee 
Heads Cross-Functional Marketing.Expert in SaaS Product Marketing, CX & GTM strategies.
Free Customer Engagement Guides
Join our newsletter for actionable tips and proven strategies to grow your business and engage your customers.
