


Table of Contents
Categories
Most Popular


As a mobile marketing platform, our goal is to give marketers precise insights into where they should focus their attention so they can do what they do best: craft an amazing user experience.
Automatically segment your audience and monitor the health of your user base with our latest feature: RFM Analysis.
RFM Analysis (aka Recency, Frequency, Monetary Analysis) breaks your user base down into segments based on how frequently and recently they’ve launched the app, from champions to hibernating users, and provides engagement strategies tailored for each segment.
How RFM Analysis Works
Choose the event that signifies activity for your application, and set the date range you want to analyze. An ecommerce app might track purchases, while a media app might monitor content viewed or rated.
For every user who has performed the defined event, the Analysis will calculate:
- How many times the event has occurred
- The last time a user performed the event
View a complete analysis of your user base on a Recency and Frequency Grid, broken down into segments. 
Recency and Frequency Grid
A low recency and frequency score (bottom left) represents hibernating users who haven’t been active recently or frequently. A high recency and frequency score (top right) represents users who have been active recently and frequently, indicating your app’s champions.
Users are then ranked in order of percentile. For example, a user who has performed the activity most recently would constitute the 100th percentile. Users are then ranked by a score of 1 through 5, based on their percentile, with 5 being the highest.
The Recency and Frequency Grid breaks your user base down into:
- Champions [R(4 – 5), F(4 – 5)]
- Loyal Customers [R(3 – 4), F(4 – 5)]
- Potential Loyalists [R(4 – 5), F(2 – 3)]
- Promising [R(3 – 4), F(0 – 1)]
- Can’t Lose Them [R(1 – 2), F(4 – 5)]
- At Risk [R(1 – 2), F(3 – 4)]
- About to Sleep [R(2 – 3), F(1-2)]
- Hibernating [R(1 – 2), F(1 – 2)]
- New Customers R [(4 – 5), F(0 – 1)]
- Need Attention R [(2 – 3), F(2 – 3)]
Recency Histogram

View a distribution of users and recency. See how many users performed the activity on each day of your date range.
Frequency Histogram

View a distribution of users and frequency. See how many users performed the activity once, twice, three times, etc. over your defined time period.

A Quick Start Guide to Automated Customer Segmentation with RFM Analysis
Using RFM Analysis to Improve Your Engagement
Click ‘View details’ from the Recency and Frequency Grid to go straight into the segmentation engine and create a new segment based on your query parameters. 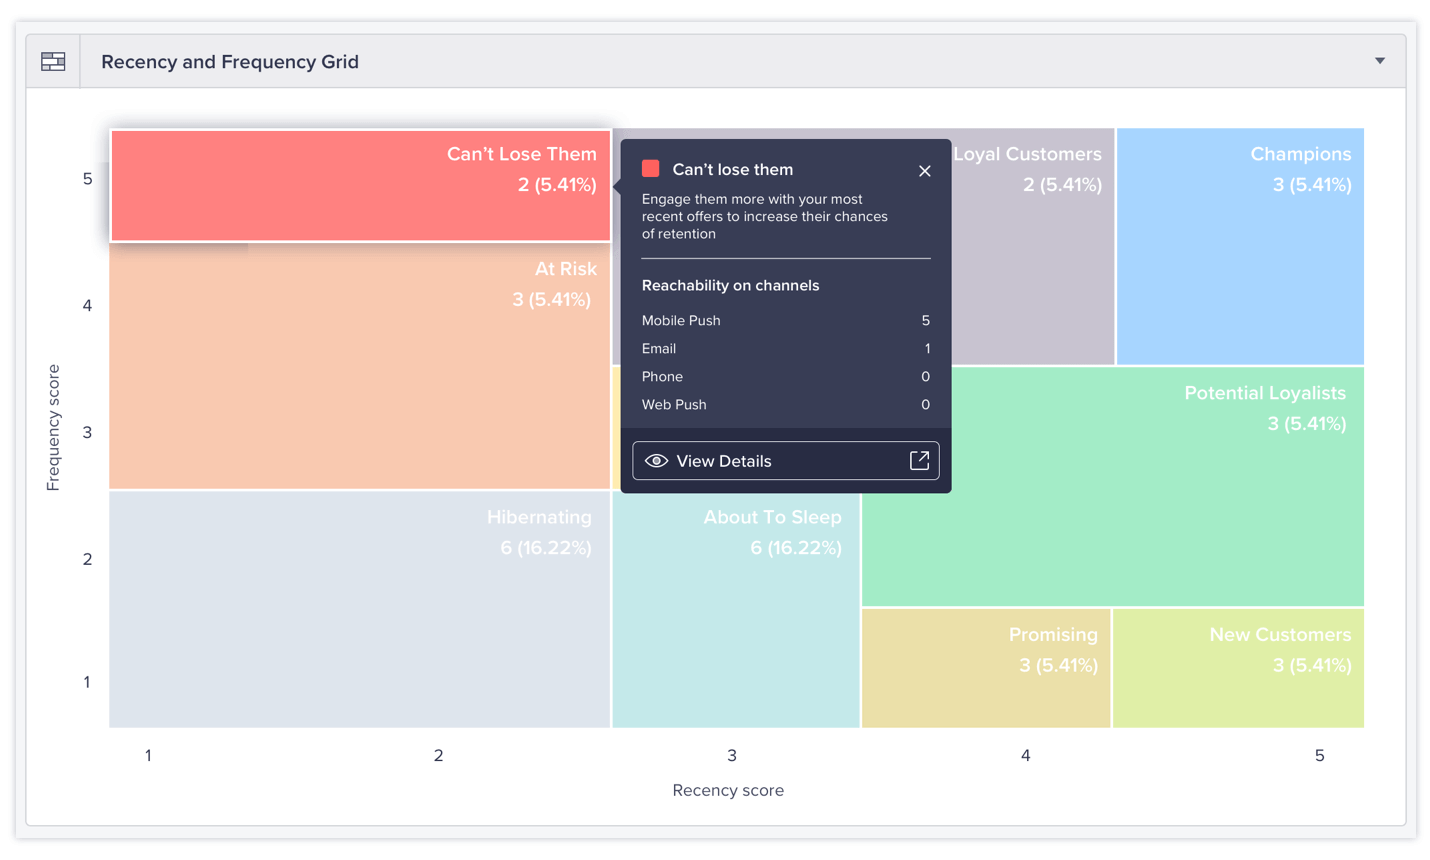
Quickly filter dashboards, send engagement campaigns, and watch for trends for that specific user group. For example, create a new segment and send a win-back email campaign to re-engage your Can’t Lose users.
Get Insights Into Reachability
Find out which users are primed for engagement campaigns and view the most popular engagement channels for each segment.
Analyze Conversion Funnels for Specific User Segments
Learn how each user group is moving through your funnels, and identify opportunities to improve conversion rates.
Track Ratios for Insights Into Marketing Performance
Calculate your ratio of hibernating customers to champions, or at risk users to loyal users, etc., then track those ratios to understand how your engagement campaigns are performing. Are more Potential Loyalists becoming Loyal Customers? Are more About to Sleep users becoming reengaged?
Read more: Learn how RFM analysis helps e-commerce businesses personalize marketing strategies.
Get Started with RFM Analysis
Click RFM in your CleverTap Dashboard, then select your activity event. When viewing the Recency and Frequency Grid, click on a segment for further analytics, or to quickly create engagement campaigns for those users.
RFM Analysis is currently available in beta to all users, so give it a try and let us know what you think!
The Intelligent Mobile Marketing Platform
Subharun Mukherjee 
Heads Cross-Functional Marketing.Expert in SaaS Product Marketing, CX & GTM strategies.
Free Customer Engagement Guides
Join our newsletter for actionable tips and proven strategies to grow your business and engage your customers.
