Learn how you can Unlock Limitless Customer Lifetime Value with CleverTap’s All-in-One Customer Engagement Platform.

Almost every app owner I meet starts the conversation by asking, “What are the most important mobile app metrics to track for my app?”
DAU/MAU, CPA, LTV, APRU, ARPPU… formulas and acronyms get confusing fast. What’s the best way to track your app’s performance? And how do you know if your numbers are awesome or abysmal?
Mobile app analytics don’t have to be complicated. It all boils down to monitoring the proper mobile application usage metrics.
In this post, I’ll cover 7 of the most critical mobile app engagement metrics you should track to measure adoption, retention, and growth, along with some industry benchmarks to help you gauge success. If your app metrics tracking dashboard does not contain these 7 KPIs, then you’ve got some work ahead of you.
Read on for the details, or jump to our infographic.
Where are your users coming from? This becomes critically important if you are running ads or spending money to acquire new users. App marketing metrics show the number of times your app has been downloaded. Among the many app usage metrics you should be tracking, number of daily downloads gives you clearer insights into the impact of your marketing campaigns.
Additionally, knowing exactly where your users are coming from tells you where to invest your marketing resources to ramp up new user growth.
Metric Range: If your activation rate is 85% or above, you’re doing well. Anything lower calls for a deeper analysis to understand and fix this issue.
Metric Range: For most growing mobile apps, the ratio of first time app launch to total app launches over a rolling 30-day period is between 5% and 15%.
You may be surprised by how many users download your app but never launch it.
Many seemingly trivial factors can influence decline, from UI typos to lengthy user registrations, but this is the first drop off point you should examine.
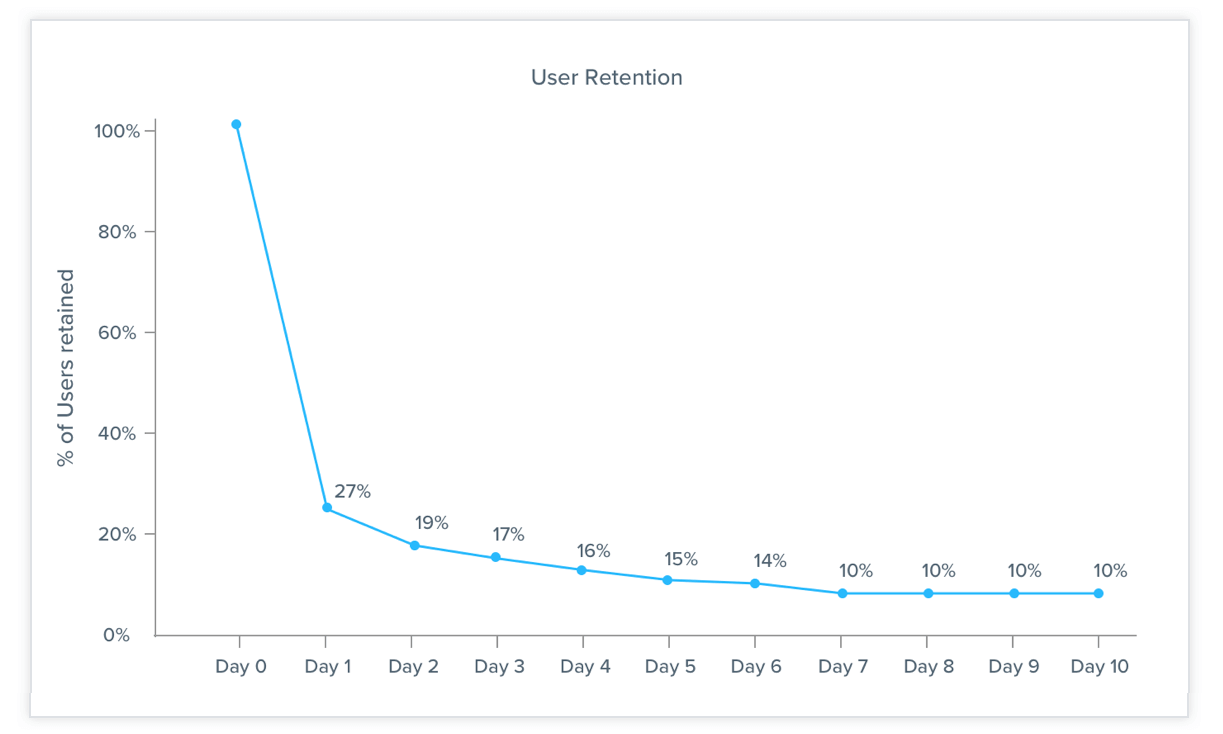
Simply put, retention = revenue. The longer you keep users, the more valuable they are to your business.
Here’s the problem: the average person has between 60 and 90 apps installed on their phone, but only use 10% of them on a daily basis.*
With so many other apps competing for your user’s time and attention, how do you get your app into that 10%?
By tracking app engagement metrics such as user retention and identifying exactly where in the user journey people are dropping off.
Metric Range: 24% of apps are uninstalled (or not used again) after just one launch.*

Use first time app launch to create acquisition cohorts. You can then track how long each cohort stays active in your app and find out which in-app behaviors have a positive or negative effect on retention.
How frequently are users coming back to your app, and how much time do they spend on it?
Not all apps are meant to be used daily, so you’ll need to define exactly what an “active user” means for your app. Is it launching the app, logging in, or completing a key action?
These app metrics can help you understand the effectiveness of your engagement campaigns — and more importantly, the quality of your user experience.
Compare daily uninstalls with the number of daily downloads and daily activations to get a net result of your mobile app growth.
If you find you have a major churn problem on your hands, look at your app’s performance to rule out bugs, crashes, or latency issues. 80% of users ditch buggy or slow-loading apps after just a few uses.*
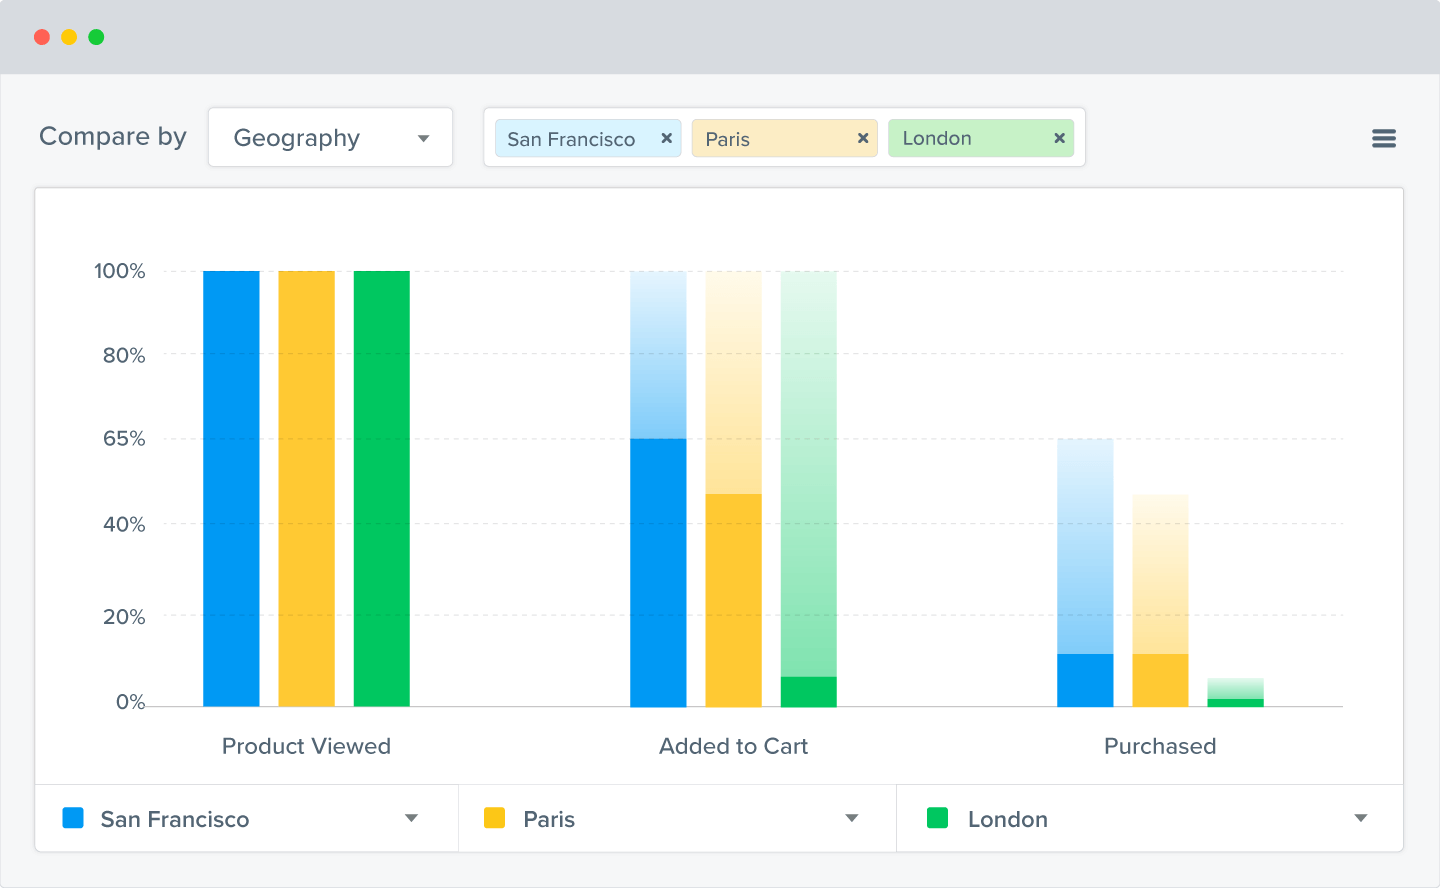
You need to know if users are performing key activities within your app — and how frequently. An ecommerce app, for example, would want to track these two user-engagement paths:
 Conversion Funnel Analysis in CleverTap
Ideally, you want to identify 1 to 3 key flows within your mobile app that you want your users to take.
Then use simple conversion funnels to track those flows over time, discover the drop off points, and zero in on areas that will have the greatest impact on growth.
CAC-to-Conversion
There is, however, one more KPI you should be tracking if you want to more accurately measure the growth of your mobile app. This is the CAC-to-Conversion rate. We devoted an entire post to explain what the KPI is and why you should be tracking it. But in a nutshell it is this: CAC-to-conversion measures the cost of acquiring a paying customer. If you’re only measuring mobile app conversion rates, you may not be getting a complete picture of your growth.
But when you support that KPI with CAC-to-Conversion, you can measure how much it’s costing you to acquire new users who actually pay money for your product or service. Plus, it’s a metric that you can directly improve. By lowering this rate you get better ROI. And because conversion doesn’t stop when a user installs your app, you can continue to upsell, cross-sell, and encourage users to make repeat purchases or renew subscriptions.
Your ability to connect with users via different channels is an important mobile app metric to track over time.
Are your users opting out of push notifications? How many of your mobile app users do you have email addresses for?
Monitoring reachability per channel over time, and comparing those trends to your daily app installs and activations, is critical to be able to engage your users and create sticky experiences.
Tracking these key app metrics for your mobile app will give you a clearer picture of your growth and marketing ROI. And they’ll help you identify exactly where you can improve the user experience to create an app users love and launch every day.
At CleverTap, we make mobile metrics, app analytics, and user engagement easier. Sign up for a demo and let our mobile growth experts show you new ways to take your mobile marketing game to the next level.
