


Table of Contents
Categories
Most Popular


The average mobile shopping app loses 86% of its users within four weeks of download. Of the few who stick around, only 8% make a repeat purchase. Yet that small group contributes up to 40% of all sales.
This gap between acquisition and repeat behavior makes your repeat customer rate a critical metric in a business. It tells you, in plain terms, what percentage of customers came back and bought again.
This guide breaks down what repeat customer rate means, how to measure it, what good looks like, and how to improve it with strategies that compound over time.
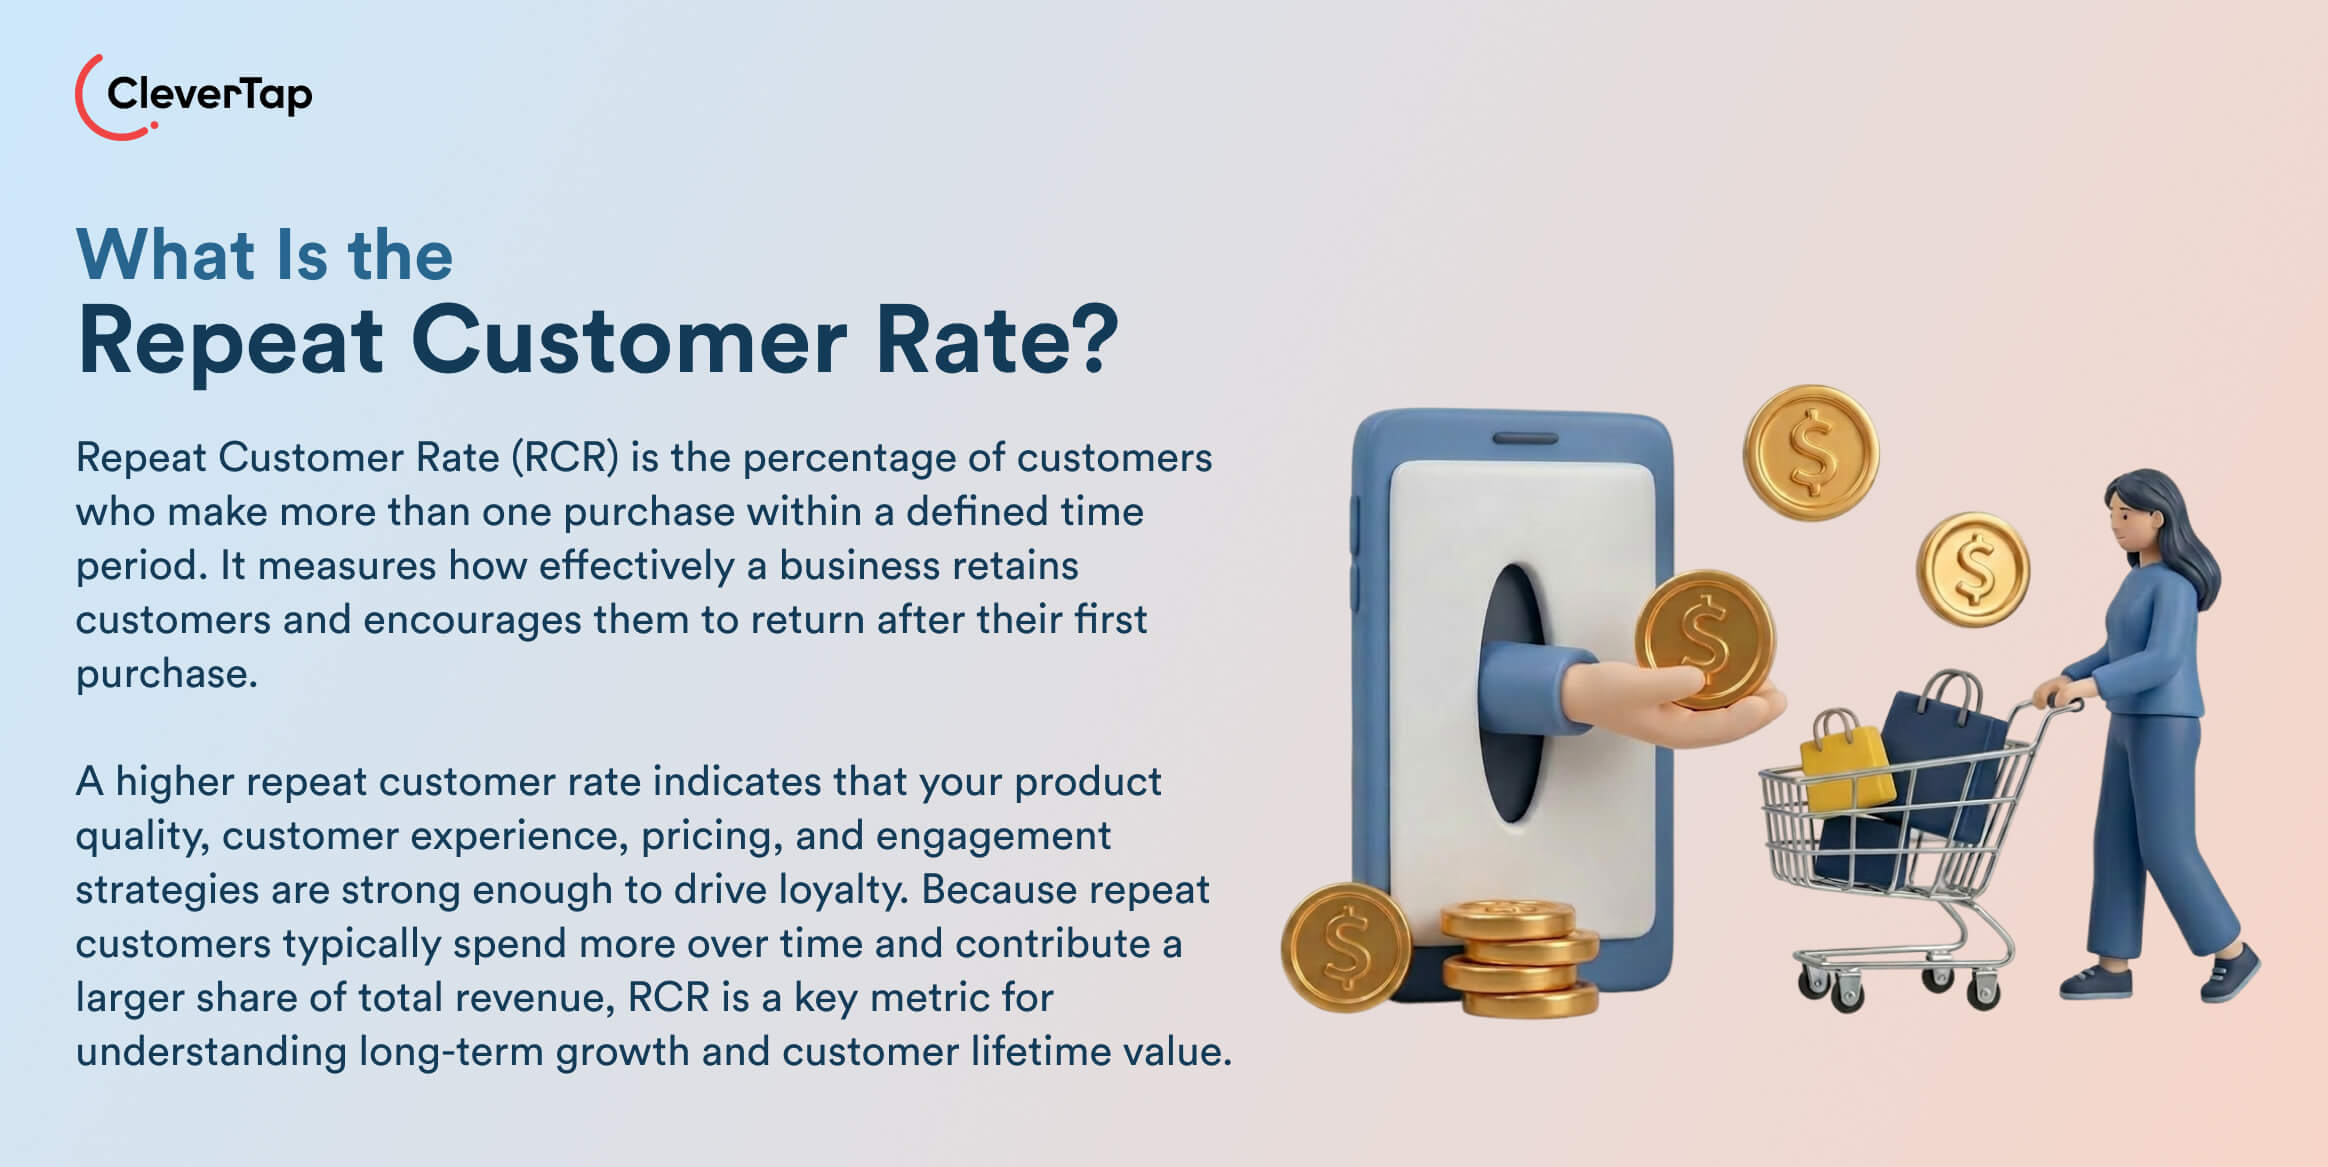
What Is the Repeat Customer Rate?
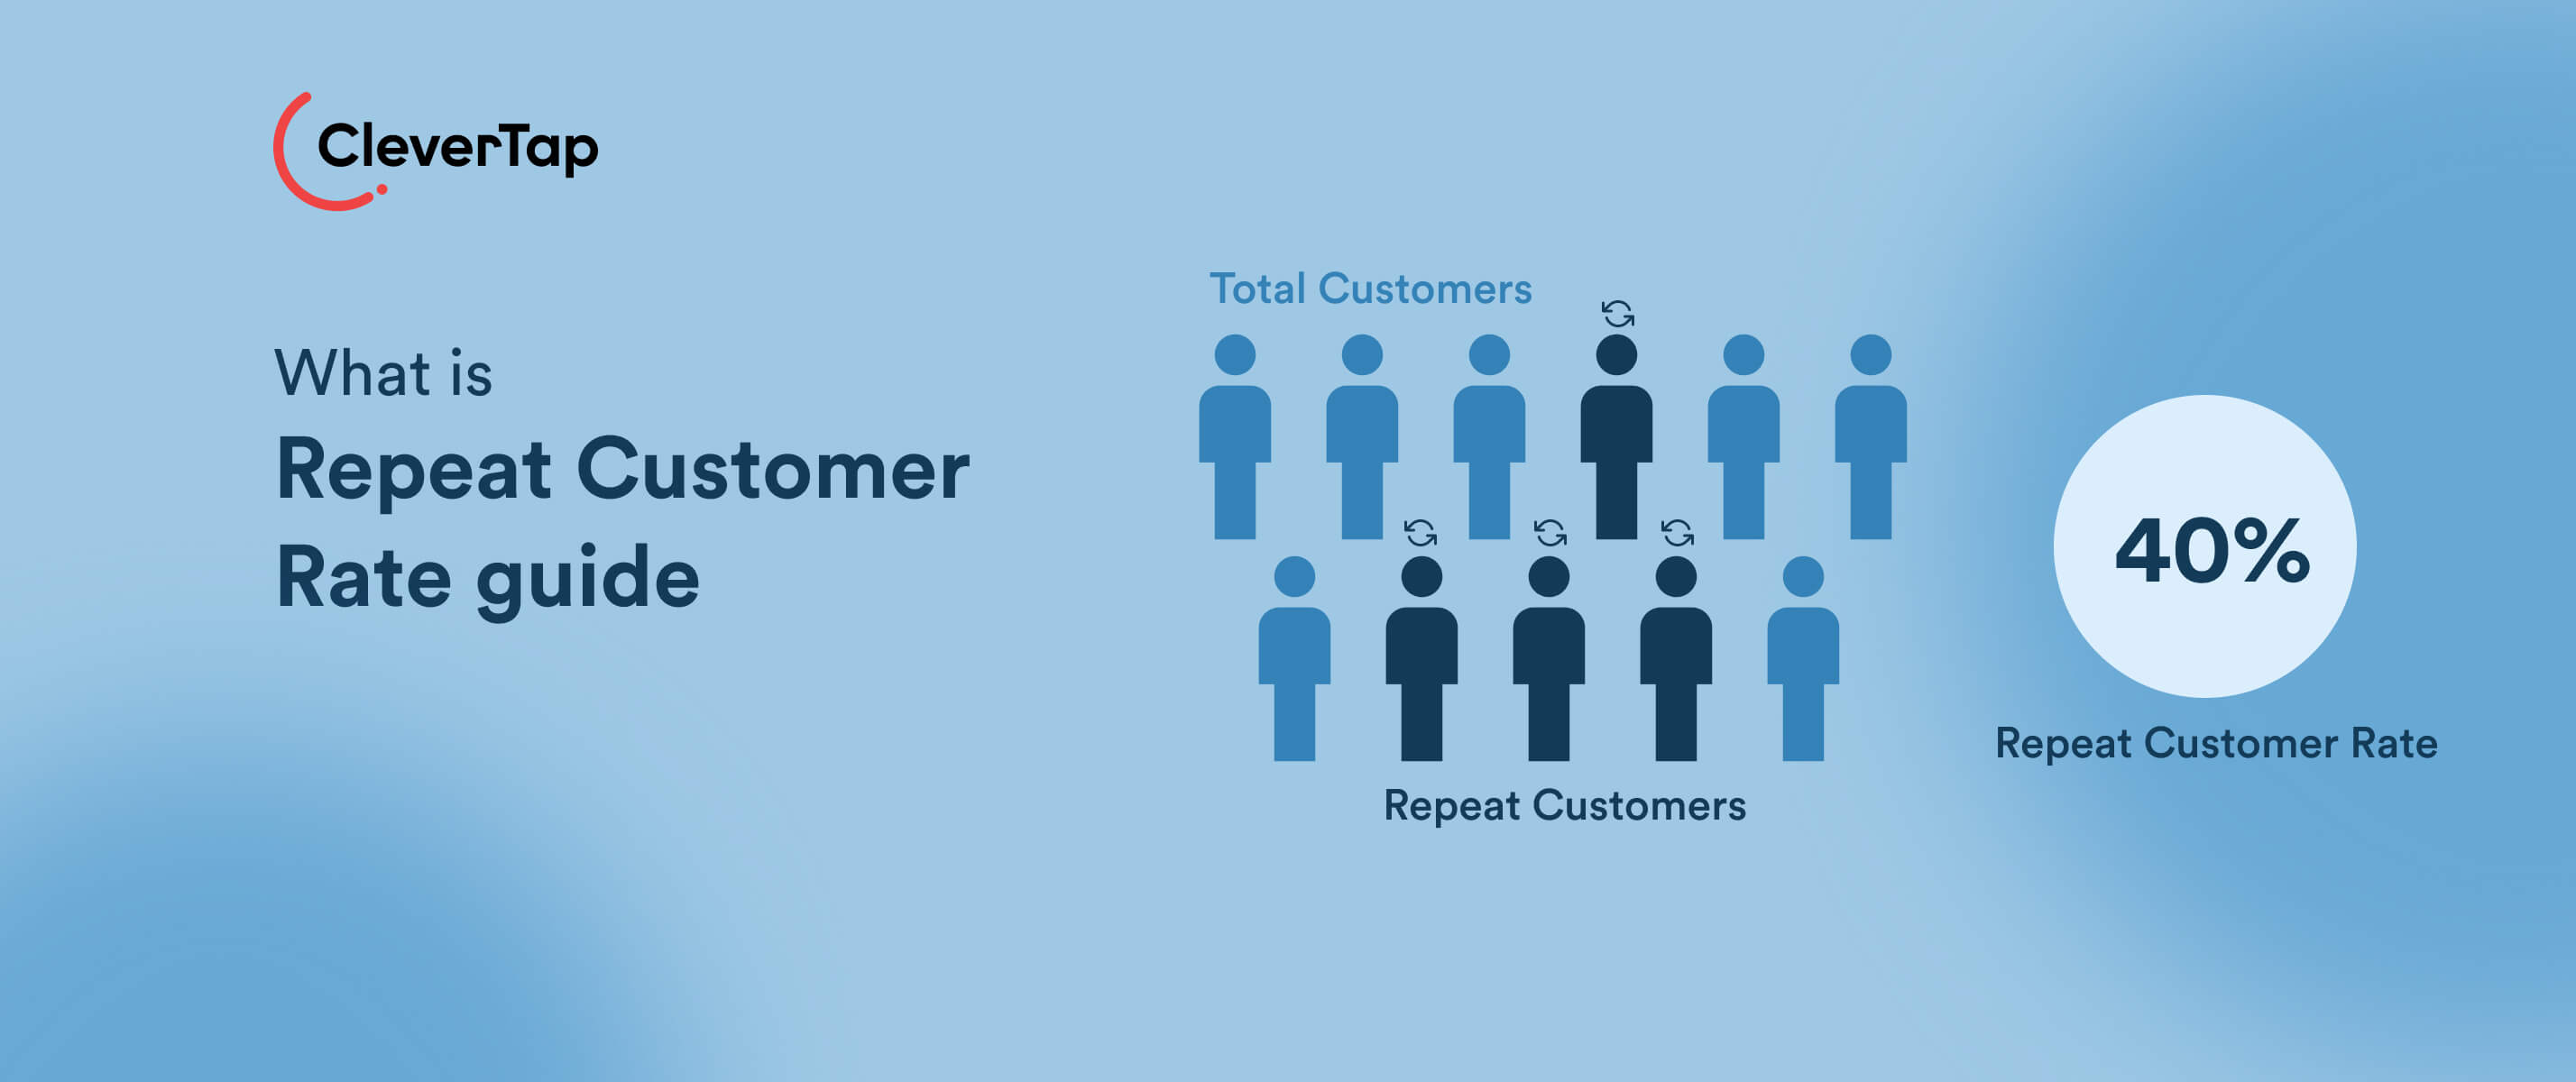
Repeat customer rate (RCR) measures the percentage of customers who make more than one purchase within a defined time period. If 1,000 people bought from you this quarter and 280 of them had made at least one prior purchase within or before that period, your repeat customer rate is 28%.
It’s one of the clearest signals of whether your product, experience, and engagement are strong enough to bring people back. A study analyzing data from over 10,000 merchants found that repeat customers make up just 21% of a brand’s total customer base, yet they generate 44% of total revenue and 46% of total orders.
When a fifth of your customers produce nearly half your revenue, each repeat buyer carries roughly four times the revenue weight of a new one. For growth teams, this changes how you model acquisition budgets. It means the true value of an acquisition channel isn’t the number of customers it brings in, but how many of those customers come back. A channel that delivers 1,000 one-time buyers is less valuable than one that delivers 500 buyers with a 35% repeat rate.
This is also where confusion tends to creep in.
Is the repeat customer rate the same as the customer retention rate?
Repeat customer rate isn’t the same as customer retention rate, and it isn’t a loyalty score. It doesn’t measure app opens, session length, or how long someone stays subscribed. It tracks one binary event: within a defined time frame: did this customer make more than one purchase? The simplicity is its strength.
There’s no room for ambiguity, and no way to inflate the number through engagement activities that don’t generate revenue.
Why Does Repeat Customer Rate Matter for Sustainable Growth?
Acquisition gets the headlines. Retention pays the bills.
Repeat customers spend 67% more per order than new customers after shopping with a brand for over 30 months, according to a Bain & Company study. They already trust you. They already know what to expect. And they convert at a fraction of the cost because you aren’t paying to earn their attention from scratch.
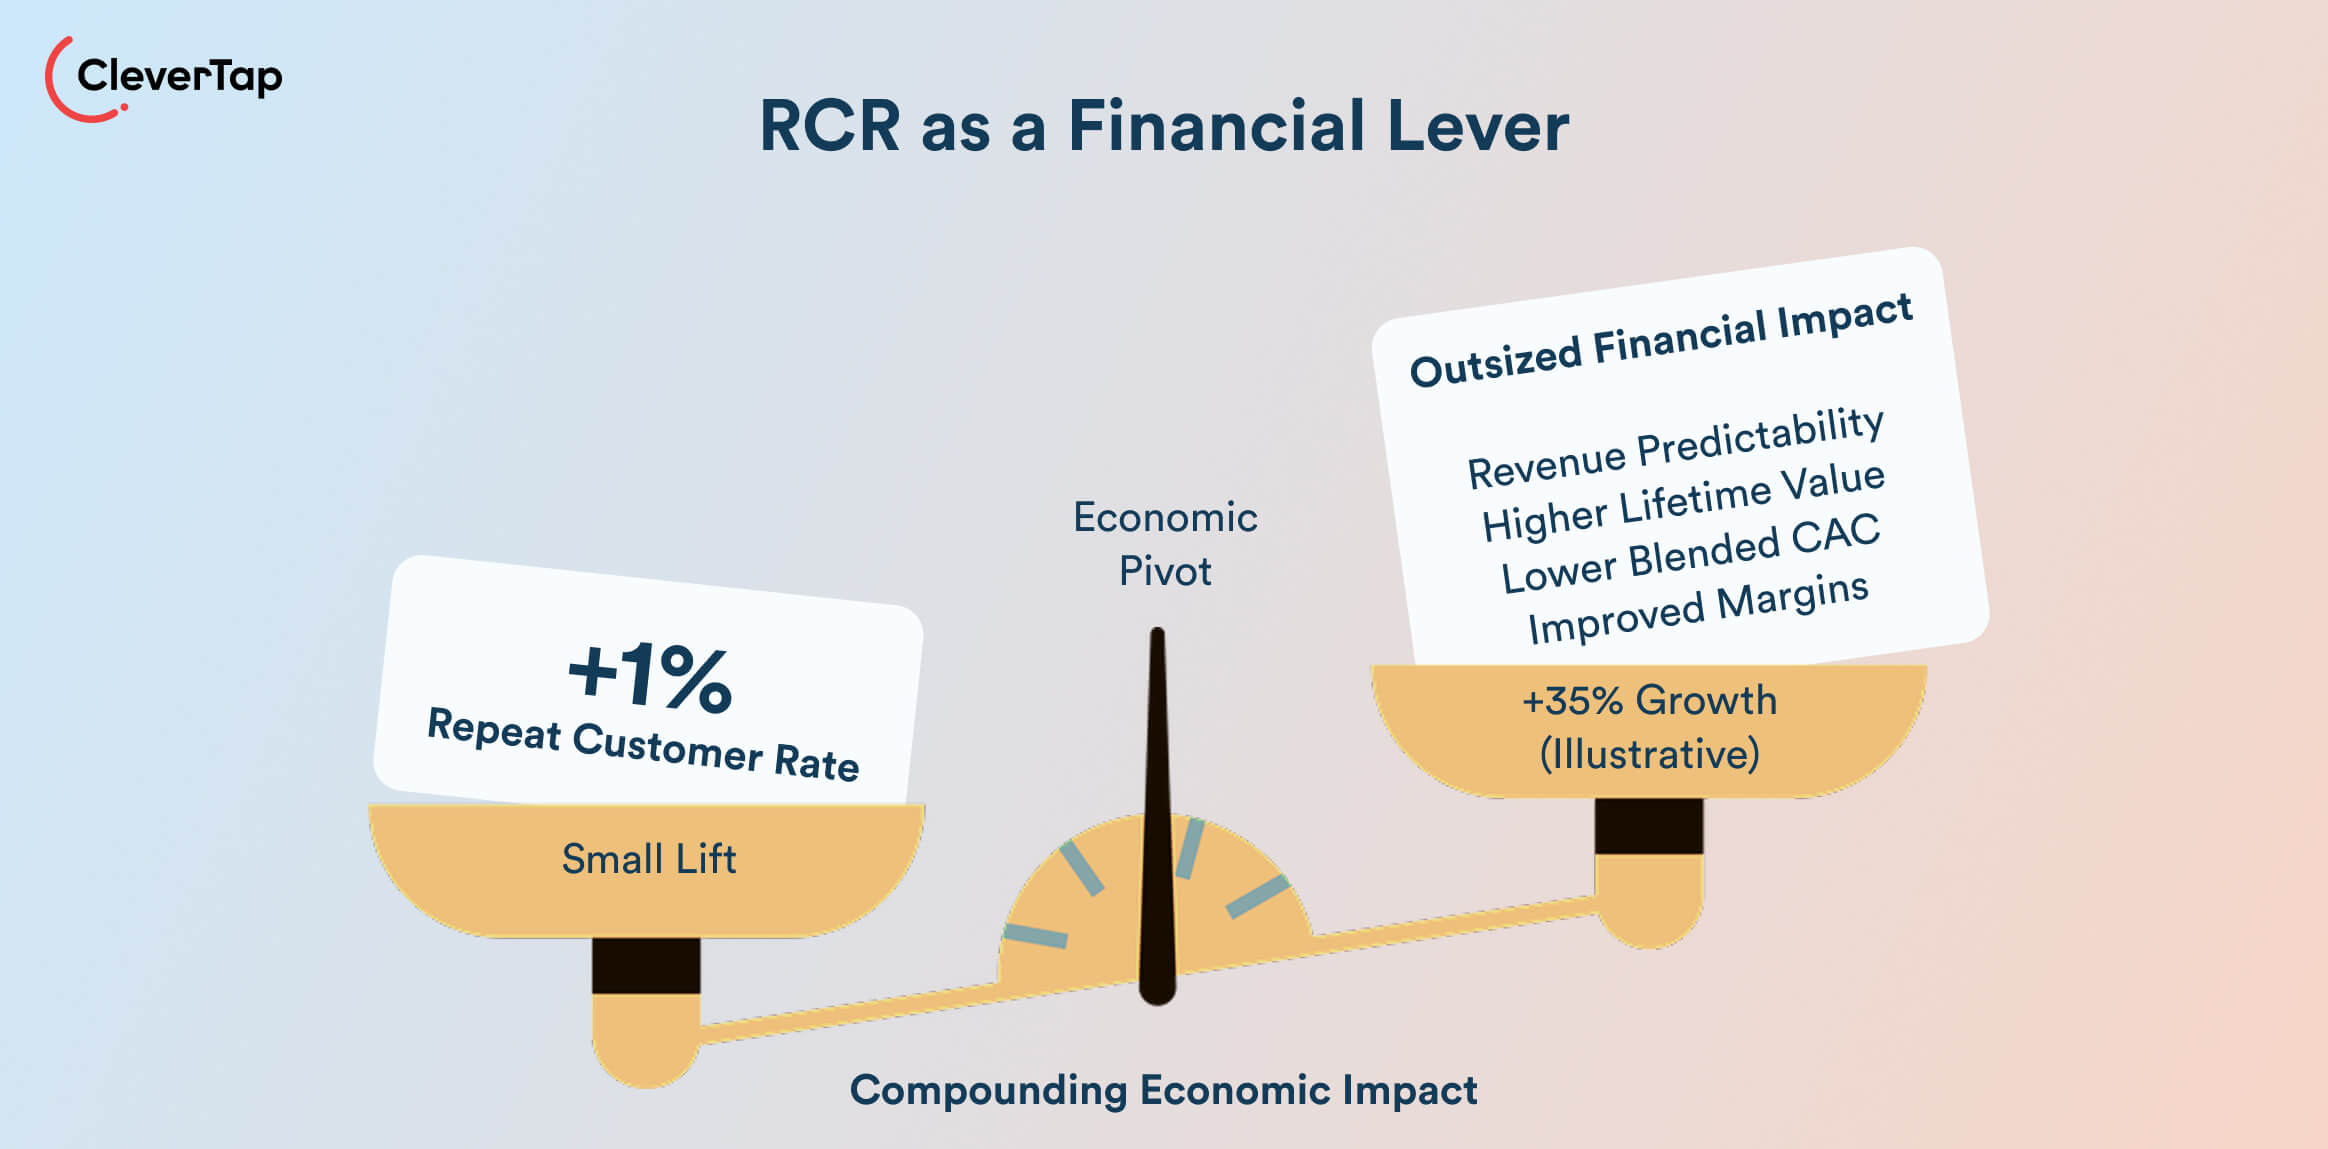
But the number alone doesn’t tell the full story. The mechanics of the business explain why even small RCR gains have an outsized financial impact.
- Revenue Predictability Improves: When you know that a reliable percentage of a month’s customers will come back next month, your forecasting shifts from guesswork to modeling.
- Customer Lifetime Value Expands. Every repeat purchase spreads the original acquisition cost across more transactions. A customer you acquired for $25 who buys once generates $25 in CAC payback. The same customer buying four times generates $6.25 in effective CAC per order. The CAC effectively becomes lower in every cycle.
- Blended CAC drops: As your repeat customer rate grows, a larger share of your total revenue comes from people you have already paid to acquire. This lowers the blended cost of acquisition across your entire customer base.
- Margins improve. Repeat buyers convert faster and need fewer incentives. First-time buyers need ads, onboarding flows, welcome discounts, and return-policy reassurance. Repeat buyers need a well-timed reminder. The cost-to-convert difference between these two groups directly affects your contribution margin per order.
A team that models RCR into its forecasting, CAC payback calculations, and budget allocation decisions sees unit economics more clearly.
The revenue predictability becomes more refined. Most importantly, the decision on where to invest budgets changes. You have the required clarity you need to make a calculated decision on whether to invest in ads or shift budgets elsewhere.
The Relationship Between Repeat Customer Rate and Customer Lifetime Value
Repeat customer rate is one of the strongest leading indicators of customer lifetime value.
The relationship works like a compounding loop. Each repeat purchase lowers the customer’s effective acquisition cost, increases their total revenue contribution, and raises the probability of yet another purchase. If a customer makes a second purchase, the probability of making a third purchase is higher than it was for the second purchase.
This compounding effect means that small improvements in repeat customer rate create outsized gains in CLV.
For CLV modeling, repeat customer rate serves as a leading indicator that is more directly tied to revenue than retention rate, which may include non-transactional activity. Retention rate tells you who is still around. RCR tells you who is still buying. And buying is what funds your business. When you model CLV using RCR as an input, you build forecasts rooted in transactional behavior rather than engagement metrics.
Repeat Customer Rate vs. Retention Rate: What Is the Difference?
These two metrics are used interchangeably all the time, which causes real problems in how teams make decisions.
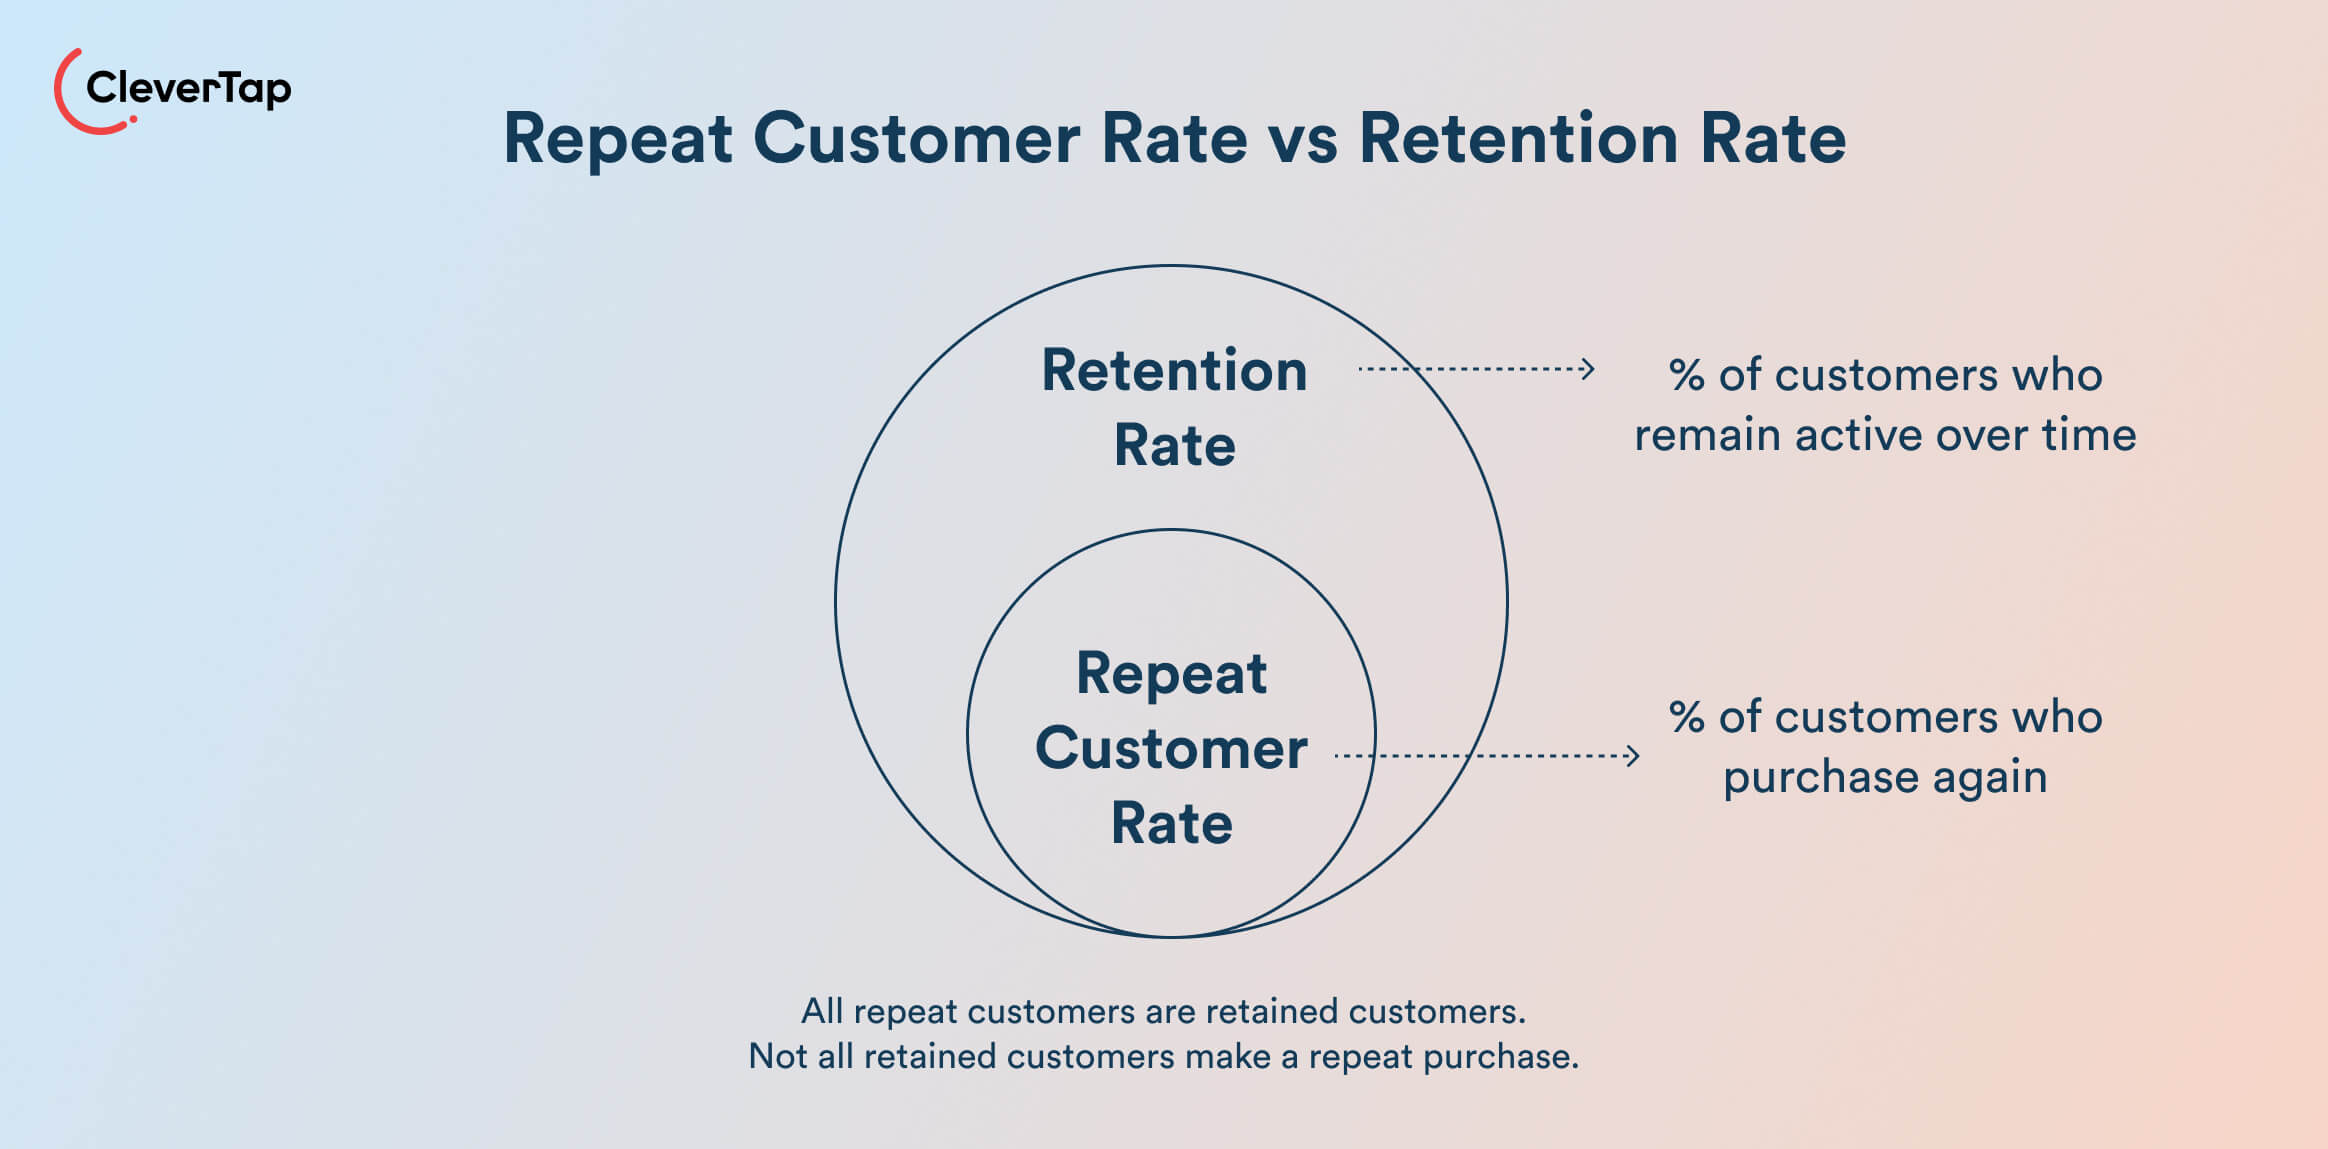
- Repeat customer rate answers a specific question: of all your customers, how many bought more than once? It’s a purchase-centric metric. It only counts when money changes hands.
- Retention rate asks a broader question: of the customers who were active in period A, how many are still active in period B? “Active” can mean a purchase, but it can also mean logging in, browsing, adding to a wishlist, or opening the app.
Here’s an example that shows why the difference matters.
A fintech app had 10,000 users in January. By March, 7,000 are still logging in and checking their balance. The retention rate looks healthy at 70%. But only 2,500 of those users completed a second transaction. The repeat customer rate is 25%. The team that looks only at retention sees a stable base. The team that looks at RCR sees a conversion problem: users are hanging around but not transacting.
This distinction matters because engagement without transactions doesn’t pay the bills. Retention rate is useful for understanding stickiness. Repeat customer rate is useful for understanding revenue health.
You need both, but if you had to pick one to obsess over, RCR tells you more about sustainable growth.
How to Calculate Repeat Customer Rate
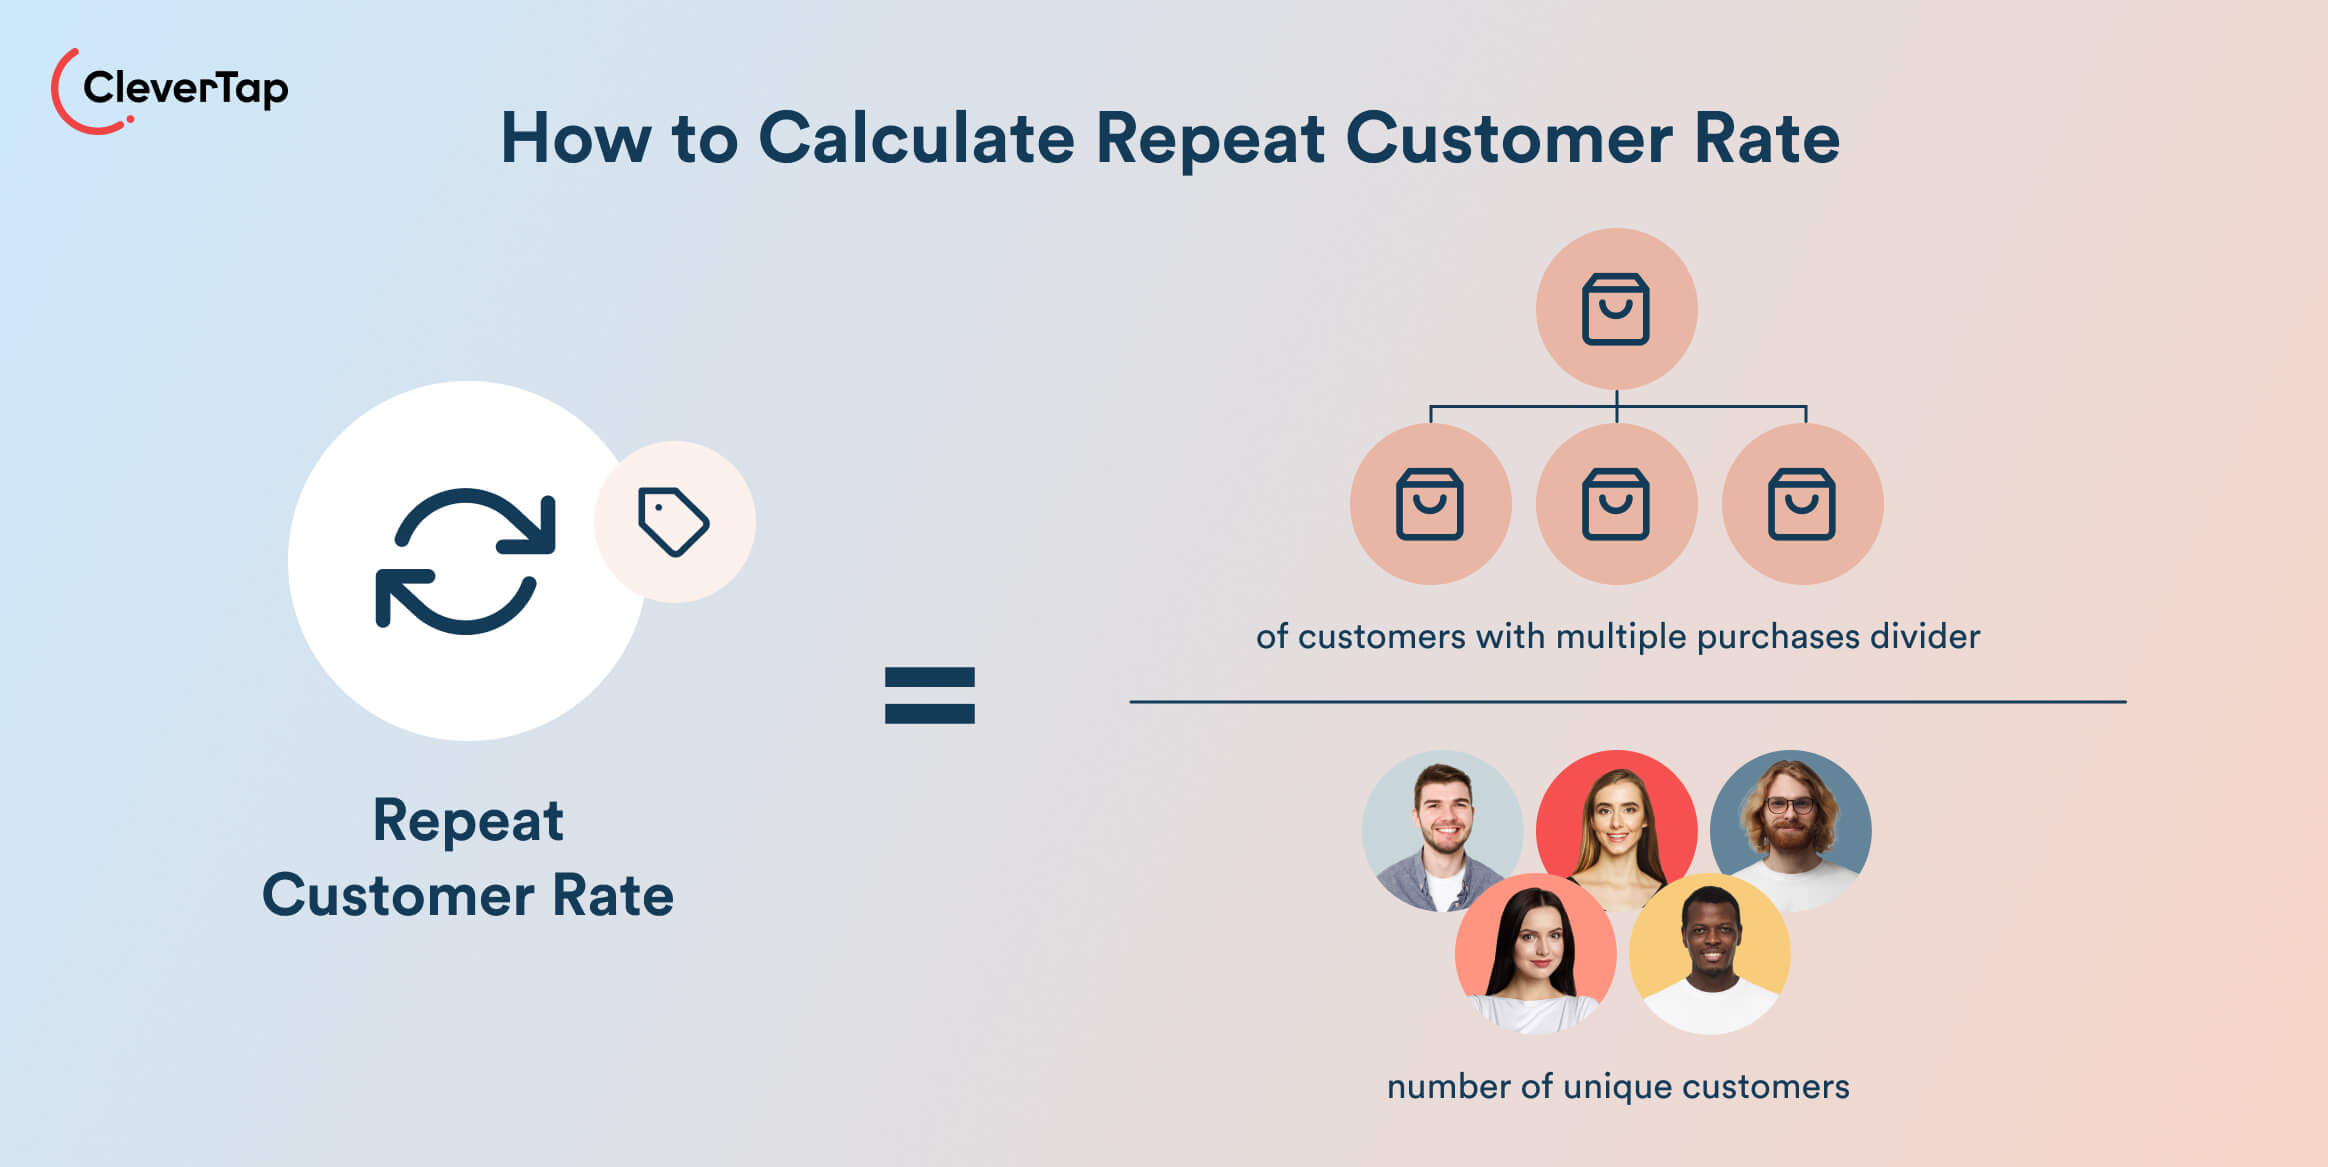
Understanding how to measure repeat customers starts with a straightforward formula:
Repeat Customer Rate = (Number of customers who made more than one purchase ÷ Total number of unique customers) × 100
Step-by-Step Calculation Example
Say you run an e-commerce store. In Q1, 5,000 unique customers made a purchase. Of those, 1,400 had previously bought from you (at any point in Q1 or before). Your repeat customer rate is:
(1,400 ÷ 5,000) × 100 = 28%
Time Period Considerations
The time window you choose dramatically changes the number, and this is one of the most common sources of error when teams try to measure repeat customers.
A 90-day or quarterly window is a better signal of loyalty for most B2C businesses. It reflects real buying behavior within a relevant cycle, not an all-time cumulative count that makes the number look better than it is.
Match your time window to your product’s natural purchase cycle. A grocery delivery app should measure weekly or monthly.
Cohort vs. Aggregate Calculation
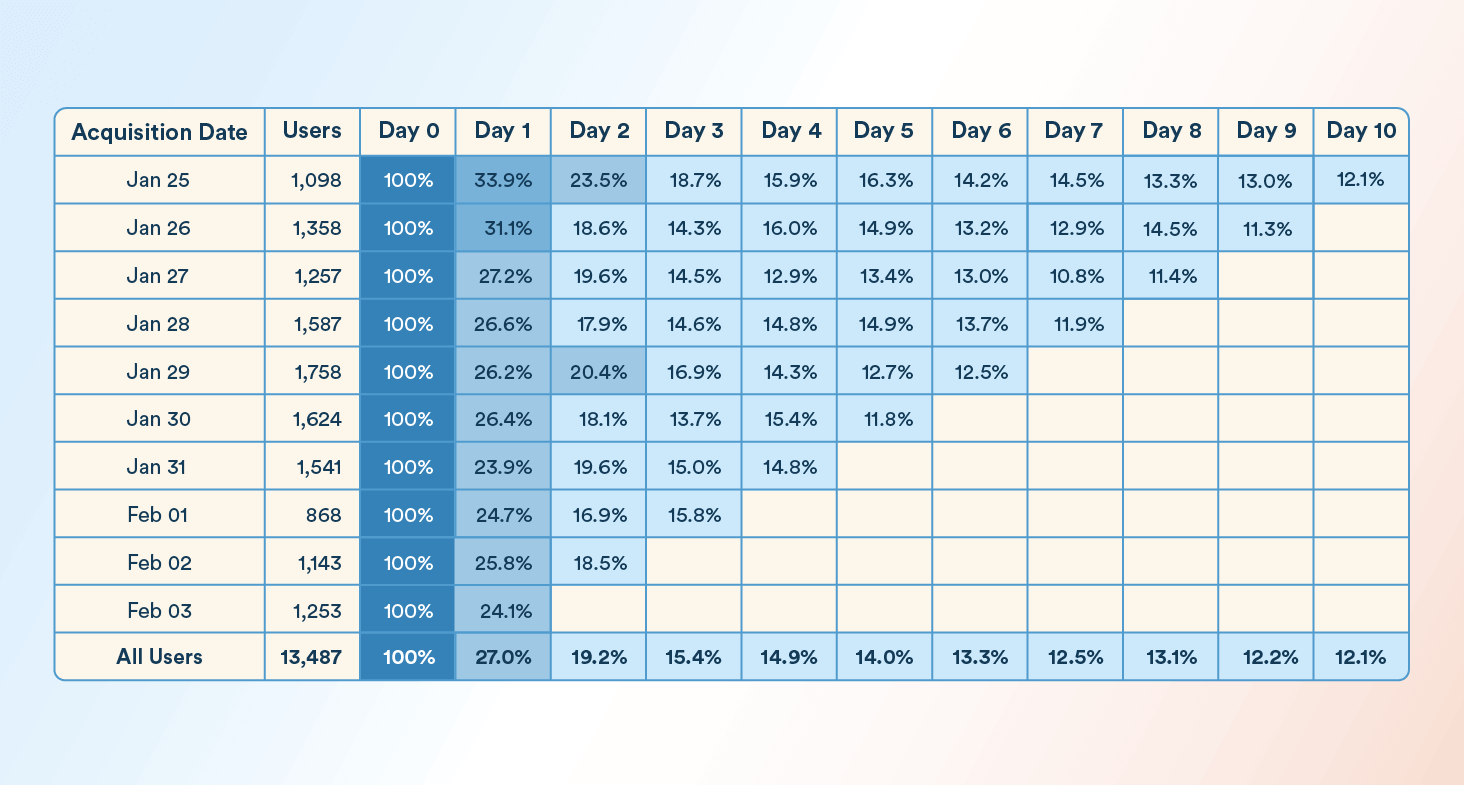
The aggregate number is a starting point. But cohort-based measurement is where the real insight lives. Instead of asking “what percentage of all customers are repeat buyers?” you ask “of customers who first bought in January, what percentage came back in February or March?”
Cohort analysis lets you spot trends that aggregate numbers hide. If your January cohort has a 30% repeat rate but your April cohort drops to 18%, something changed. A new acquisition channel brought in lower-quality leads. A product issue emerged. You can’t find these causes in a single aggregate number.
Avoid These Common Mistakes When Measuring Repeat Customer Rate
Watch out for these while measuring repeat customer rate:
- Wrong time window. Using all-time data inflates RCR and hides real trends. Define a window that matches your purchase cycle.
- Ignoring cohorts. Aggregate RCR blends new and old customers together. Segment by acquisition cohort to see actual behavior changes over time.
- Not segmenting by channel. Customers acquired through paid social behave differently from organic search customers. Measure RCR by acquisition channel to know where your best repeat buyers come from.
- Inflation due to subscriptions. Auto-renewing subscriptions inflate repeat purchase counts. Separate subscription revenue from active re-purchase decisions in your calculation.
- Treating RCR as a standalone metric. RCR without context is just a number. Pair it with average order value, CLV, and acquisition cost to understand whether repeat behavior is actually profitable.
What Is a Good Repeat Customer Rate?
There’s no universal “good” number because purchase frequency, price point, and industry all shape what a good repeat customer rate looks like. That said, e-commerce benchmark data gives a useful frame of reference.
According to reports, the average repeat customer rate in e-commerce is approximately 28.2%. Industry leaders with strong loyalty programs achieve 35% to 45%, while new stores typically achieve 10% to 15%.
However, you need to carefully interpret the benchmark to set a standard for your own. A 28% repeat rate at a high-AOV luxury brand will generate very different revenue per customer for a low-margin consumable. It’s important to track your RCR against your baseline over time. If you have a steady upward curve, even from 12% to 18%, it’s a signal that retention mechanics are working.
For planning, it’s best to think RCR benchmarks in tiers:
- Below 15%: Shows gaps in post-purchase experience
- 15% – 28%: You’re in the average range, and there’s still space for improvement
- 28%: Above 28%: Indicates strong repeat behavior. Gains are harder to achieve but have a higher impact on revenue
The whole point of it is to understand where you sit and what’s realistic for your sector.
How RCR Varies Across B2C Models
Repeat customer rate behaves very differently depending on the business model. Here is an overview of how RCR varies across different B2C models:
E-commerce and Retail
E-commerce sees the widest variation in repeat customer rate. Some product categories, especially consumables and replenishable goods, tend to see higher repeat purchase rates.
| Product Category | Repeat Purchase Rate |
| High-Performance Sports Accessories | ~33% |
| Meal Deliveries & Supplements | ~29% |
| Tea Products | 20.90% |
Repeat customer rate vs. repeat purchase rate:
Repeat customer rate and repeat purchase rate are often used interchangeably to measure customer loyalty. They’re generally calculated as the percentage of customers who make more than one purchase within a given time frame. While both indicate retention, the repeat customer rate typically focuses on the percentage of unique customers who returned, whereas the repeat purchase rate may emphasize the proportion of total orders from returning buyers.
Seasonality plays a major role. Holiday acquisition spikes often bring in deal-seekers who never return, dragging down post-season repeat rates.
Also read: 12 Creative Examples of Holiday Marketing Campaigns That Spark Sales
Fintech and Payments
Fintech repeat behavior is about habit formation. A user who makes a second payment or investment within the first two weeks is significantly more likely to become a long-term active user. CleverTap’s own data shows that shopping apps lose 86% of users within four weeks of download, but the 8% who make repeat purchases contribute up to 40% of all sales.
This pattern is consistent across multiple use cases. For example, Mobikwik found that the first 3 to 4 days after installation were the critical activation window. Users who didn’t complete a key action within that window were highly likely to churn.
Travel and Hospitality
Travel sees infrequent but high-value repeat behavior. A customer typically books once or twice a year. But each repeat booking carries substantial revenue.
Personalized recommendations based on past travel behavior (destination preferences, travel dates, and loyalty tier) are the primary lever here.
How to Improve Repeat Customer Rate Strategically
The following strategies improve the repeat customer rate by targeting the highest-impact levers. Use this guide to strategically improve the RCR in a given time frame.
1. Optimize the First Purchase to Reduce Second-Purchase Friction
The first purchase is an audition. Everything about it, from the confirmation email to the delivery experience to the unboxing moment, shapes whether the customer returns.
Start with immediate post-purchase confirmation. Include clear delivery timelines, easy access to support, and a personalized product tip or care instruction. The goal is to eliminate buyer’s remorse before it even forms.
2. Design a Structured First-to-Second Purchase Journey
Don’t wait for customers to remember you. Design a sequenced journey that moves them from first purchase toward second purchase with purpose.
This isn’t about blasting discount codes. It’s about a structured sequence: order confirmation, shipping update, delivery follow-up, a product tip or education piece, and then a relevant product recommendation timed to when their first product is likely consumed, worn, or used up.
Each touchpoint adds value before asking for anything.
GlowRoad, a social commerce platform in India, saw a 4x increase in repeat transactions after shifting from generic communications to a structured post-first-transaction engagement flow. The team used:
- Funnels to identify drop-off points in the reseller journey
- RFM analysis to segment users by purchase behavior
- Intent-based segmentation to target resellers by transaction likelihood.
The takeaway for growth teams: Map your post-purchase journey as deliberately as you map your acquisition funnel. Most teams invest heavily in the path to first purchase and leave the path to second purchase to chance.
3. Use Behavioral Signals to Personalize Follow-Ups
Behavioral data tells you more than demographics ever will. A customer who browses running shoes three times but buys a casual sneaker is signaling interest.
There’s a behavioral psychology principle at work here: the endowment effect. Once someone has bought from you, they feel a sense of ownership of your brand. Personalized follow-ups that acknowledge their specific choices reinforce that feeling of connection.
4. Segment by Repeat Probability
Not every customer has the same likelihood of buying again. RFM segmentation provides a framework for grouping customers by how recently they bought, how often they buy, and how much they spend.
This lets you allocate resources where they’ll have the biggest impact. Shawarmer, a QSR chain with 160 restaurants in Saudi Arabia, applied RFM segmentation to categorize customers by recency, frequency, and monetary value. Then they designed occasion-based campaigns.
They achieved a 9% uplift in overall sales, 36% retention among at-risk customers, and 27% reactivation among hibernating users, all with zero media spend.
The strategic lesson here is that segmentation isn’t just about personalization. It’s also about resource allocation. RFM tells you where each dollar of engagement spend will deliver the highest return.
5. Test and Measure Incremental Lift
Improving the repeat customer rate is about understanding which campaigns actually change behavior. Run cohort-based experiments: take two similar groups of customers, expose one to a new journey or message sequence, and measure the difference in repeat purchase rate between them.
This avoids the vanity trap of attributing repeat purchases to campaigns that simply coincided with natural buying behavior. Incremental lift testing shows you the true impact of your engagement strategy.
How to Measure and Track Repeat Customer Rate Effectively
Calculating the repeat customer rate once is easy. Making it useful for ongoing decision-making requires tracking infrastructure.
- Dashboards: Build a repeat customer rate dashboard that updates in real time or at least daily. Include breakdowns by cohort, acquisition channel, and product category. A single top-line RCR number hides more than it reveals.
- Cohort Tracking: Measure RCR by acquisition cohort (month or quarter of first purchase) and track how each cohort’s repeat rate evolves over 30, 60, and 90 days. This cohort analysis shows you whether your retention efforts are actually improving over time or whether you’re coasting on older, loyal customers while newer cohorts churn.
- Channel-Based Segmentation. Customers acquired from different channels repeat at different rates. Organic search customers often have higher repeat rates than paid social customers because their intent was stronger at the time of acquisition. Segment RCR by channel to allocate acquisition budget toward sources that produce not just customers, but repeat customers.
- Trend analysis. Plot your repeat customer rate over time alongside key business events: product launches, pricing changes, new campaign launches, and seasonal promotions. Correlations between events and RCR movement are where you find your most actionable insights.
Analytics platforms that unify behavioral data with campaign performance enable this kind of tracking.
You need a single source of truth that connects user behavior to engagement touchpoints. It allows teams to see what moved the needle.
How CleverTap Helps You Increase Repeat Customer Rate With Behavioral Intelligence
CleverTap is a customer engagement and retention platform designed for B2C businesses. It helps teams analyze user behavior, segment audiences, and run personalized, cross-channel campaigns to drive conversions and long-term retention.
Tracking repeat customer rate is one thing. Systematically improving it is another. CleverTap connects behavioral analytics with automated engagement, so insights turn into action. More importantly, it helps you identify where repeat behavior breaks, predict which users are likely to return, and trigger interventions that move customers from first purchase to second purchase.
Cohort Analysis
CleverTap’s cohort analysis tracks how specific user groups behave over time after a defined event, such as a first purchase, app install, or feature activation.
This allows you to pinpoint exactly where repeat customer rate drops across cohorts, whether by acquisition channel, campaign, or time period. Instead of relying on a single RCR number, you can see which cohorts fail to convert to a second purchase and investigate why.
Carousell, a marketplace with over 250 million listings across seven countries in Southeast Asia, used CleverTap’s cohort analysis alongside personalized push notifications based on browsing behavior and liked listings.
The result was a 71% increase in Week 3 retention.
For repeat customer rate, this kind of cohort visibility helps teams identify the exact moment users disengage before making a second purchase, and design targeted interventions to bring them back.
RFM Segmentation
CleverTap’s automated RFM analysis segments your entire user base into ten behavioral groups based on how recently and how frequently they perform a key event.
This effectively models repeat purchase probability, helping you distinguish high-intent repeat buyers from one-time or at-risk users
The RFM Grid visualizes each segment’s size, channel reachability, and average monetary value. The RFM Transition tool shows how users move between segments over time, so you can spot early signals of churn or a shift in loyalty and act before the trend becomes irreversible.
Behavioral and Intent-Based Segmentation
Beyond RFM, CleverTap lets you build segments based on real-time and historical behavior: products viewed, categories browsed, time-of-day usage patterns, purchase history, and event properties.
These behavioral signals allow you to trigger highly relevant follow-ups that directly influence repeat purchase decisions, such as replenishment reminders, cross-sell recommendations, or category-specific nudges.
Psychographic segments based on interests and habits enable engagement that feels personal rather than formulaic.
By aligning messaging with observed behavior, you increase the likelihood that a customer returns to complete a second or third transaction.
Lifecycle Journeys
The Lifecycle Optimizer maps your user base to defined lifecycle stages using frameworks like AIC (Acknowledgement, Interest, Conversion) or AARRR (Acquisition, Activation, Retention, Referral, and Revenue).
More importantly, it allows you to design structured journeys that guide users from first purchase to second purchase with precision.
From there, you design and test journeys that move users from one stage to the next using push notifications, email, SMS, WhatsApp, in-app messages, and more. These journeys can be triggered based on real user events such as order delivery, product usage timelines, or inactivity windows, ensuring that engagement is timed to when a repeat purchase is most likely.
Vodafone, with over 469 million connections across 26 countries, used CleverTap’s lifecycle journeys and retention cohorts to engage diverse user segments at scale. Their team identified a critical 2-minute re-engagement window for users who abandoned transactions and triggered personalized messages within that window.
It resulted in a 2.5x increase in prepaid segment revenues and a 15% improvement in onboarding click-through rates. This kind of real-time orchestration is critical for improving the repeat customer rate because it reduces friction between intent and action.
Predictive Analytics and CleverAI
CleverTap’s CleverAI Decisioning Engine uses predictive models to forecast churn probability, purchase intent, and optimal send times for individual users.
This allows you to identify which users are most likely to make a repeat purchase and intervene before they drop off.
Its agentic AI agents work collaboratively:
- Strategy Agents define the optimal path toward your goal
- Decision Agents match each user to the right offer or message
- Creative Agents generate individualized content
- Action Agents execute delivery across channels.
Together, these capabilities help you personalize not just what you send, but when and to whom, increasing the probability of repeat transactions.
Maya, a leading digital bank in the Philippines, used CleverTap’s automation and data-driven personalization to transform its engagement strategy.
The platform replaced manual, one-off campaigns with automated cross-channel journeys, resulting in a 95% boost in Easy Credit users and a 2x improvement in retention.
Moreover, a Forrester TEI study found that CleverTap customers achieved a 561% ROI over 3 years, with $8.1 million in quantifiable benefits across a composite organization.
Campaign Analytics
Every campaign sent through CleverTap connects back to downstream behavior metrics, including repeat purchase rate, revenue per user, and conversion funnels. This allows you to directly measure which campaigns are driving repeat purchases and which are not, rather than relying on proxy metrics like opens or clicks
This closes the loop between what you send and what happens next.
As a result, teams can continuously optimize their engagement strategy based on actual impact on repeat customer rate, not just engagement activity.
Boost your email marketing performance and drive higher conversions with CleverTap
Are Your Customers Buying Again?
Repeat customer rate is not just a metric. It reflects how effectively your business converts first-time buyers into long-term revenue.
The brands that win repeat customers treat the post-first-purchase window as their most valuable real estate. They measure RCR by cohort, not in aggregate. They segment by behavior and channel, not just demographics. They design structured journeys that make the second purchase feel like a natural next step. And they use behavioral intelligence to personalize engagement at scale.
CleverTap gives you the tools to do all of this. Serious about moving your repeat customer rate from a reporting number to a growth engine? Explore what CleverTap can do for your retention strategy. Schedule a demo today!
Agnishwar Banerjee 
Leads content and digital marketing.Expert in SaaS sales, marketing and GTM strategies.
Free Customer Engagement Guides
Join our newsletter for actionable tips and proven strategies to grow your business and engage your customers.
