


Table of Contents
Categories
Most Popular


Performance measurement cannot be viewed in isolation. It becomes meaningful when it is compared against a benchmark.
For eg: Metrics such as Daily Active Users (DAU), Monthly Active Users (MAU), Uninstall Rates, Engagement Rates, etc are always compared to numbers observed in the earlier period(s), industry benchmark(s), etc to come up with meaningful trends and growth analysis.
This benchmark needs to be carefully chosen so that any comparison becomes useful, accurate and insightful.
One of the most popular benchmarking metric is the ‘Average’.
For eg: The current MAU of an app may be compared to an average of the MAU of the past 12 months.
Average is a good summarization metric and is extremely easy to understand. But, at the same time, it could be very deceptive.
Let’s understand this with the help of another example:
Generally, marketing managers are aware of the average Click-thru-rates (CTRs) for various channels of communication. Most often, they use these average rates as one of the key benchmarking metrics to compare the performance of various campaigns.
Suppose, you are provided with the campaign CTRs of 2 products, A and B. We assume that the target audience for both the products is same for easy comparison.
From the graph above we understand,
- Total Number of Campaigns for each product = 10
- Average CTR for each product = 5%
Now, in order to compare the performance of the campaigns based on CTRs against a benchmark, is the average CTR sufficient?
Let’s say that a campaign for each of the products, delivered a 9% CTR. This CTR is 80% or 0.8 times above the average for both the products. But, does this mean that we need to treat the campaigns on equal footing?
Simple analysis on the range of the CTR for the products, reveals that CTRs for product A is more variable than product B.
| Product | Range of CTR |
|---|---|
| A | 2% – 11.25% |
| B | 4% – 6.75% |
Given the above range of CTRs for the 2 products, the chance of observing 9% CTR for product B is lesser compared to product A. Hence, one could conclude that the campaign which delivered 9% CTR is more valuable to product B than product A. Therefore, it deserves to be analyzed further to check for signals that could prove to be beneficial for future campaigns.
In the above example, the average CTRs were the same for both the products (a rare possibility).Hence, by just comparing the actual CTR with the range and drawing a conclusion may be tedious, time-consuming and prone to error for a wide range of CTRs.
A better way to analyze is to combine the average and the variability in the data and rank the campaigns appropriately.
- Average CTR for Product A and B = 5%
- Variability in CTR for product A* = 2.78%
- Variability in CTR for product B* = 0.85%
In order to rank the various campaigns on the basis of CTR, we need a scoring framework. A scoring framework will enable us to compare campaigns across products and channels. A well-established and recognized method is to calculate the z-score.
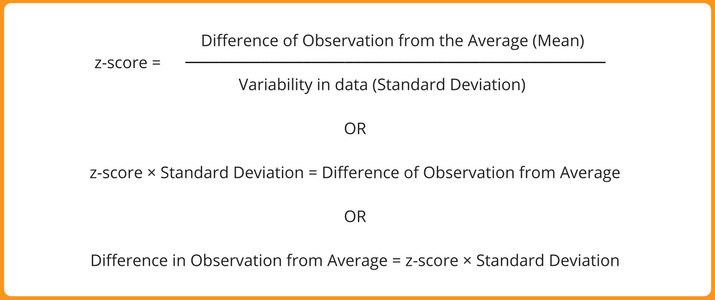
With the help of z-score, you are able to take the variability in your data into account. Also, z-scores are unitless. So, if your measurement metric is in %, kgs, cms, etc, the resultant scores as a result of the division is unitless (the measurement unit gets cancelled out). Hence, comparison across datasets is a breeze.
| Campaign | CTR(A) | z-score(A) | CTR(B) | z-score(B) |
|---|---|---|---|---|
| 1 | 2.00% | -1.08 | 4.00% | -1.17 |
| 2 | 3.50% | -0.54 | 4.65% | -0.41 |
| 3 | 2.85% | -0.77 | 6.15% | 1.35 |
| 4 | 11.25% | 2.25 | 4.75% | -0.29 |
| 5 | 4.10% | -0.32 | 6.75% | 2.05 |
| 6 | 4.70% | -0.11 | 5.10% | 0.12 |
| 7 | 7.20% | 0.79 | 4.75% | -0.29 |
| 8 | 5.90% | 0.33 | 4.45% | -0.66 |
| 9 | 6.10% | 0.40 | 4.25% | -0.88 |
| 10 | 2.40% | -0.94 | 5.15% | 0.18 |
The above table shows the z-score of campaign CTR for Product A and B. The campaigns across both the products can be ranked on the basis of z-scores. It seems that Campaign 4 of product A has the highest z-score of 2.25 and the lowest z-score of -1.17 belongs to Campaign 1 of product B.
Generally, in practice, observations with z-scores above 2 and below -2 are of interest. Statistically speaking, only 5% of the observations see such magnitude in deviation from the average. Here, the magnitude is in terms of variability or standard deviation.
For product B, CTR of Campaign 5 (6.75%) is 2.5 times standard deviation (z-score * standard deviation) away from the average CTR.
Likewise, a CTR of 9% for both products would mean:
– Campaign CTR is 1.44 standard deviation times away from the average for product A
– Campaign CTR is 4.70 standard deviation times away from the average for product B
Hence, the campaign CTR of 9% for product B seems out of the ordinary compared to product A.
Though averages are the most used and understood metric of comparison, we see how using it in isolation could lead to faulty insights. Hence, combining average with standard deviation to arrive at z-scores leads to better insights and helps you compare different numerical metrics like CTR.
Make your apps smarter
Jacob Joseph 
Heads Data Science.Expert in AI, Data & Analytics and awarded 40 under 40 Data Scientists in India.
Free Customer Engagement Guides
Join our newsletter for actionable tips and proven strategies to grow your business and engage your customers.
