Learn how you can Unlock Limitless Customer Lifetime Value with CleverTap’s All-in-One Customer Engagement Platform.

The holy grail of all mobile app marketers has always been retention: “How do I keep the users who installed my app?” In a single word, the answer is engagement.
Makes logical sense, since the more people who engage with your app and the more loyal they become, the better your chances at growing revenue.
With half of all apps being abandoned after only 10 logins, it falls on the developer to build an app experience that users want to keep returning to and get users hooked on your app.
But first, what is user engagement?
According to Mounia Lalmas-Roelleke, Research Director at Yahoo! and Honorary Professor at UCL, user engagement can be defined as a cognitive, emotional, and behavioral connection between a user and your technology.
Which only goes to show that a crucial step in engaging users is to delight them, and give them an experience that fulfills their needs.
To measure this engagement though, you need to have the right metrics in place. And while there are many data points you could track, you really only need two core metrics, supplemented by five more.

Metrics That Matter for Growth: A Handbook for Mobile Marketers
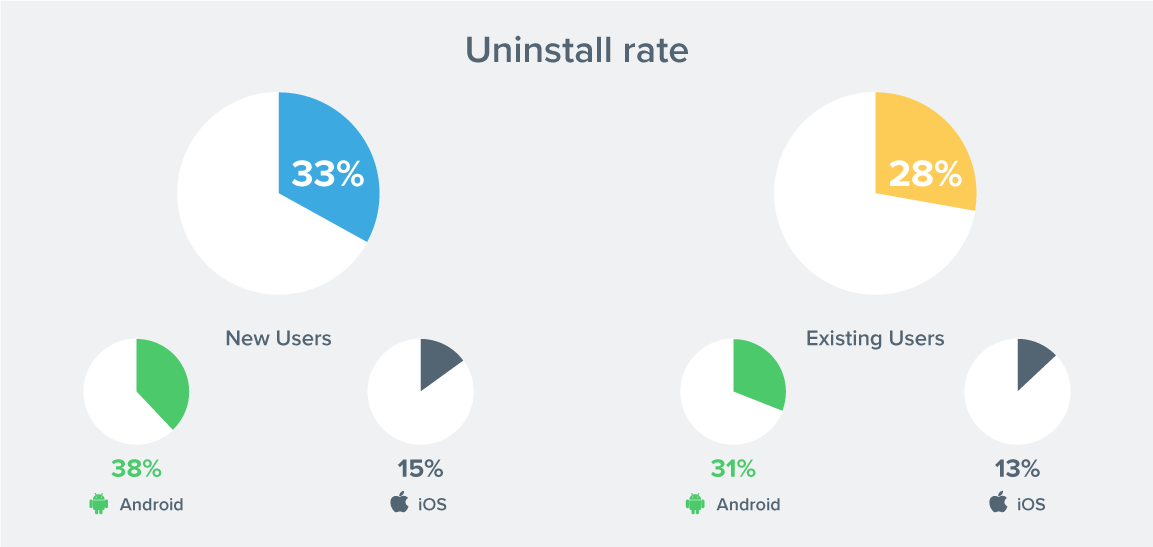
How many people uninstall your app on a daily basis? Keep a running tally in order to understand the relative health of your app.
Keep this in mind: most apps lose 80% of new users in the first 90 days. In fact, 50% of all users who uninstall your app do so within the first 4 to 5 days. So if you’re able to address friction points during onboarding, you’ll see daily uninstalls lessen within those those initial 5 days.

Uninstall Stats for Apps
Instead of looking at all your users in one bunch, cohort analysis is simply the act of breaking them down into groups that can be easily scrutinized.
In this case, break them down by the behavior of launching your app within a given time frame, specifically:
This allows you to monitor how long your cohorts return and stay active. It will also allow you to see which of your marketing actions have a positive or negative effect on engagement.
You need to track Daily Active Users (DAUs) and Monthly Active Users (MAUs). These are the number of active app users on any given day or month.
Just remember to define the exact behavior expected from an “active user.” Does it mean launching the app, logging in, or completing some other action?
These two metrics by themselves will help you understand how effective your engagement campaigns are and how frequently customers are using the app. Do they perform the key activities you’re pushing them to complete? Do they keep coming back?
More importantly, these help you measure stickiness.
Stickiness is simply DAU divided by MAU. When you convert this number to a percentage, it answers the question, “What percentage of my monthly users turn up each day?” The closer the number is to 1, the better your app’s stickiness.
If you monitor the number of daily and monthly sessions initiated by each active user, you will be able to tell if users are finding value in your app, and whether they will continue to make it a habit.
Additionally, by looking at the frequency – the number of times they launch and engage with your app – you can compare occasional users and your heavy users. This is an easy way to segment your customers and identify your champions and power users.
Finally, track the average time that users spend in each session. The longer they’re in your app, the better. Longer session lengths are a good signal that:
The idea, after all, is to hook them with your app and make it a habit for every user. As master product psychologist Nir Eyal says, “If a product doesn’t form a habit, it’s going to be forgotten.”
In the end, user engagement metrics show how healthy your app is on various layers. The more users find your app valuable, the more loyal users you retain. This gives you an opportunity to monetize and grow revenue. It also gives your users more chances to evangelize your brand and grow the user base.
Better user engagement leads to retention, and eventually revenue, referrals, and growth.
For a more complete discussion on the metrics you need to track for mobile app success, read: The Definitive Guide to Mobile App Metrics.

Metrics That Matter for Growth: A Handbook for Mobile Marketers