


Table of Contents
Categories
Most Popular


Calculating the ROI for mobile app marketing has always been complicated because of so many moving parts.
For the most part, a lot of that has to do with complex user behavior on the mobile.
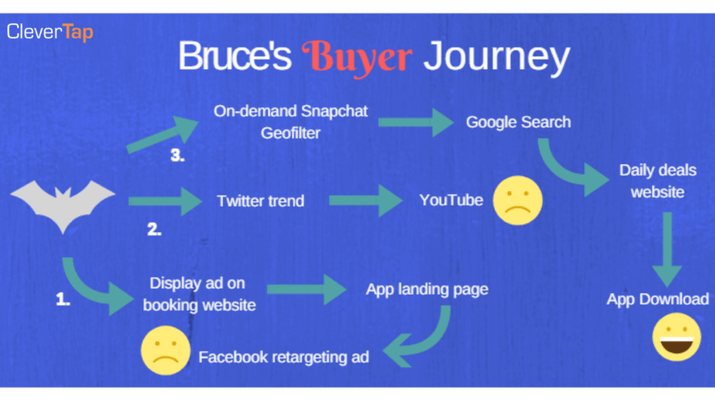
To understand exactly how complex, let’s look at Bruce.
He’s a 25 year old sneakerhead who can drop up to $5,000 on a pair of sneakers, and is always on the lookout for rare and limited edition trainers.
You are a sneaker app with the merchandise that would send Bruce to cloud nine.
However, Bruce isn’t just going to download your app even if he hears about your awesome collection.
Instead, this is how he will probably interact with your brand, over a period ranging anywhere from a day to a few months, depending on how badly he needs those shoes.
He finally gets the sneakers, and you get a new user,.
Congratulations!
Now comes the hard part for you as a marketer: how do you calculate the ROI of your app marketing?
Getting the metrics of your mobile app right
In Bruce’s story, you might be tempted to attribute the download and sale to the deals website, because that’s what your analytics would show as source of traffic.
If you go down that route, you might ramp up your investment in that website, issuing more coupons and potentially neglecting other channels.
That would be a mistake!
His decision to buy was likely influenced by what he saw online across multiple channels. The deals website was just the means to an end, and not the reason.
Google, for example, found out that one car buyer went through 900 + digital interactions over a period of three months before making a decision.
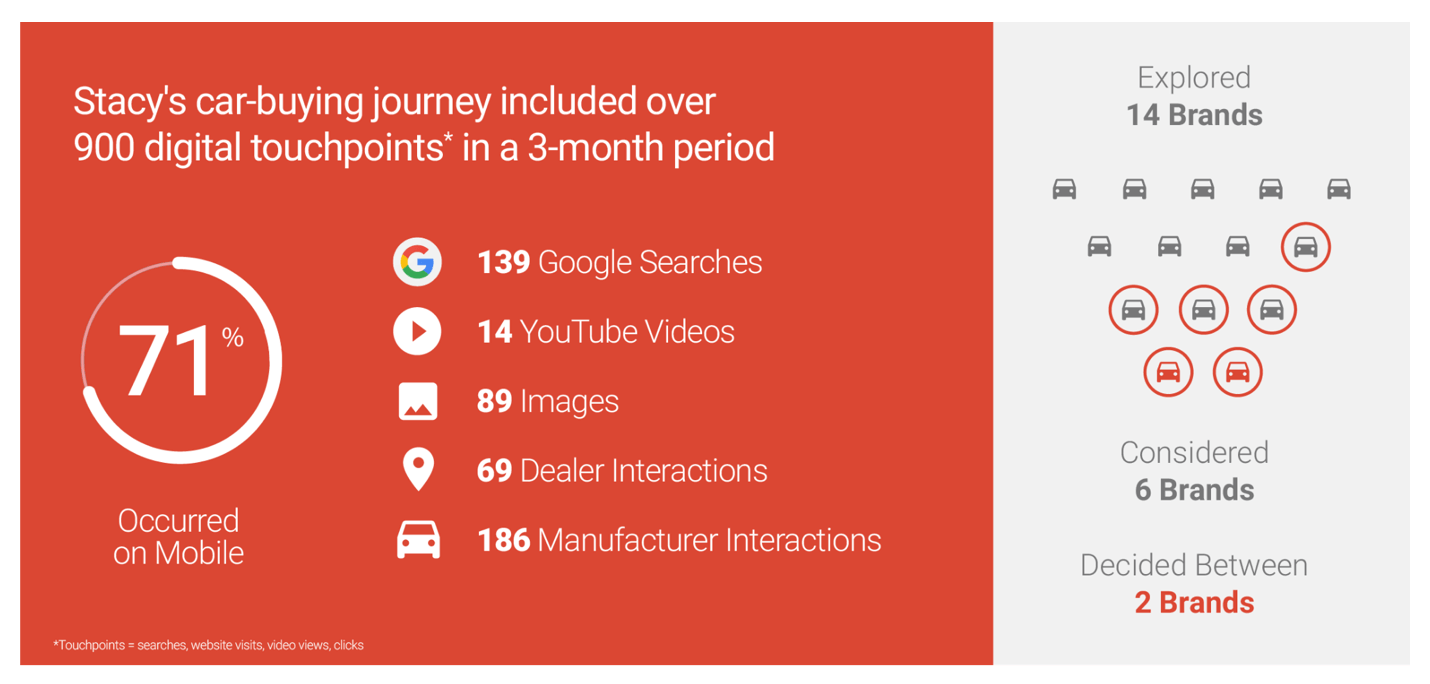
Notice the different channels at play in this buyer journey?
While the number of interactions are high because the car is a higher value purchase compared to a shoe or a $1.99 app the principles behind customer behavior are consistent: people will use multiple channels to find out about your product or service before they make the final decision.
Understanding how a buyer finds out about your app is crucial if you want to really calculate the ROI of your app marketing.
But that’s just one piece of the puzzle.
You also need to know:
- Whether users are responding to your onboarding process and not abandoning or uninstalling the app immediately.
- How are users responding to different retargeting or marketing campaigns to get them to be more active on the app.
- The channels and campaigns which are sending the most loyal or most high value users.
- The customer acquisition cost for users who join following a referral campaign, and the channels which drive the highest referral installs.
- And much more.
So many questions, so few answers. 🙁
Fortunately for you, there are a bunch of frameworks you can use to uncover the metrics that would help you answer these questions.

Mobile App Monetization Strategies for 2018
We will be using the familiar AARRR (Acquisition, Activation, Retention, Referral, Revenue) framework.
This article goes into details about determining your mobile marketing KPIs but for tl;dr version, here’s what you will get after going through the process of figuring out your metrics by using the Goals-Signals -Metrics framework.
| Goals | Signals | Metrics | |
|---|---|---|---|
| Acquisition | Users understand the features and benefits of the app | – Users download the app – Positive comments on social media about the app features following marketing campaign – Increased interaction with blog posts and marketing email campaigns | – Number of downloads – Cost per install/channel and CPI/campaign – App store ranking – App Abandonment rate – Cost per purchaser – Cost per acquisition |
| Activation | Users complete their profile and complete desired actions (place order, watch content etc) | – User activity in-app – Interaction with push notifications or emails – Increase in number of onboarded users – Increase in goal completion | – DAU/MAU/core daily active users – Push Notification open rate – Email open rates – Length per session – Goal completion rate – Cart abandonment rate |
| Retention | Users return regularly to your app | – Low dropoff in number of users from D1-D30 – Repeat orders – Deeper interaction with app features – Shorter time between multiple sessions – Increased usage of coupons – Increase in user generated content | – D1, D7, and D30 user numbers – Churn rate – Negative churn rate – Number of orders/user – Session frequency |
| Referral | Users talk about your app in positive terms and drive more downloads | – Glowing reviews on App and Play Store. – 5 star ratings – Positive chatter on social media about your app – Increase downloads from referral links and discount coupons | – Number of reviews – Ratings – Active users sending invites – CAC of referrals – Customer Lifetime Value – Loyal customer value – Retention rate of referrals – Invitees per referer – Clicks per invite – Installs per invite – Net Promoter Score |
| Revenue | Users spend money in your app | – Increase in in-app purchases – More signups for pro version – Increase in frequency of in-app purchases – Increase in average transaction value | – Average Revenue Per User – Customer Lifetime Value – Average order value – AOV/paying user – MRR/ARR |
Different apps will have different AARRR metrics, but this table can help you get started.
Once you know the metrics you need to track, you will need to set up systems to track your costs and your revenue to find out your ROI.
Simple, right?
But as you might suspect, it’s not easy.
Plug- and- play (ish) formulas for calculating app ROI
Let’s talk about Bruce’s sneaker shopping journey for a bit.
When you are calculating the ROI of your sneaker app, you will not only need to figure out the ROI at different stages of the user journey as represented by the AARRR framework but…
…also demonstrate the value of mobile app as a whole, as opposed to other channels like social or digital.
After all, there are already mutterings that mobile apps have peaked and they would be rapidly replaced by newer channels like chatbots, or by progressive web apps.
A rigorous ROI measurement effort could also uncover missed opportunities and trim wastage, 80/20 your marketing efforts, and turn your app marketing leaner and meaner, like this:
“That sounds all well and good in theory, Clevertap,” you will say. “But how the covfefe do I actually calculate the numbers and justify my marketing budget hike?”
We hear you!
There are a whole branch of approaches for calculating app ROI considering the mind boggling diversity in the app universe.
- Calculate Cost Per Install and Install To Action rate
This approach works if your app has one single most valuable post install action that the user can perform, like upgrading to Pro version.
The cost per install number will give you the total costs incurred in acquiring a high value purchaser, and dividing this number by the total revenue per user for the same time period will give you the app marketing ROI.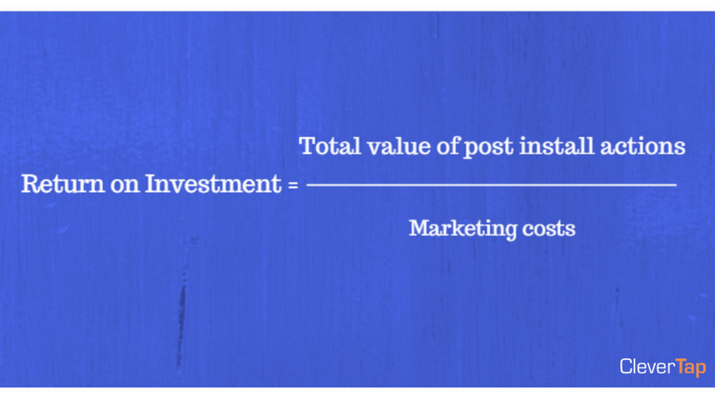
You can fine tune your marketing strategy by segmenting these numbers on a campaign, channel, creative or source basis to identify the high performers, and either double down on them or work to boost the laggards.
Drilling down into revenue numbers inside Clevertap
Another related metric that will give you insight on the value of your entire post install funnel is the ITA (Install to Action) rate, which is defined as the number of installs that perform the highest value action.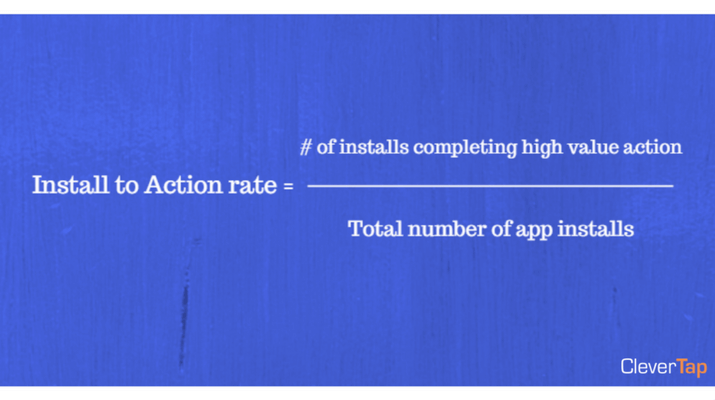
You can benchmark your CPA by using data from Fiksu’s cost per purchaser index. As the following graph shows, getting purchasers on Android is less costlier than on iOS.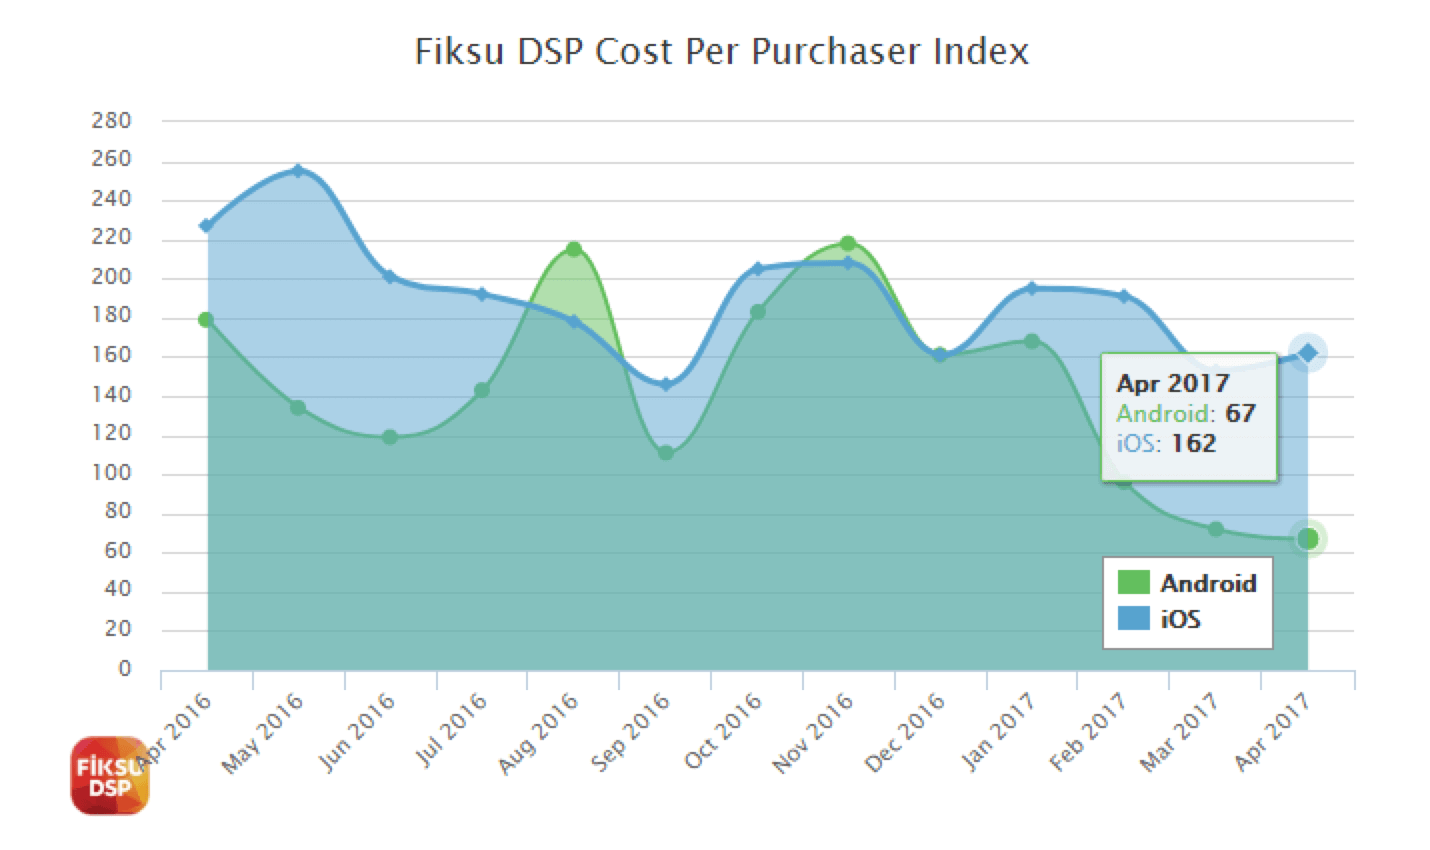
- Net Present Value method
If you are not directly selling anything, or if you are in charge of an enterprise app built for internal users, you might not be able to use the revenue metrics to calculate the ROI.
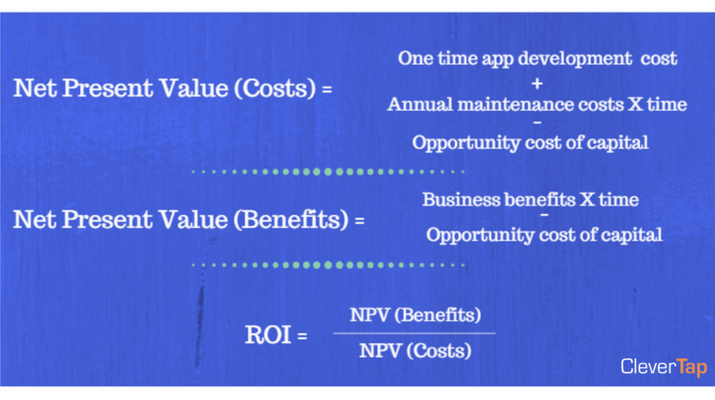
In such a scenario, you can use the net present value formula to calculate app ROI.
This post, along with the associated infographic goes into more details about the method but here’s how the math works:
- NPV (Costs):Find out all the costs associated with building and maintaining the app over the life time period, adjusting for cost of capital deployed down the line
- NPV (Benefits): Find out the value delivered by the app over its complete lifetime.
- Divide benefits by costs to get the ROI.
- The ARPU and CPLU method
Another way to find out whether your app marketing is going on the right track is to calculate the ARPU (Average Revenue Per User) and CPLU (Cost Per Loyal User) numbers and compare them.
You are in positive ROI if your ARPU is greater than CPLU.
ARPU > CPLU
Here’s how you can find out the numbers: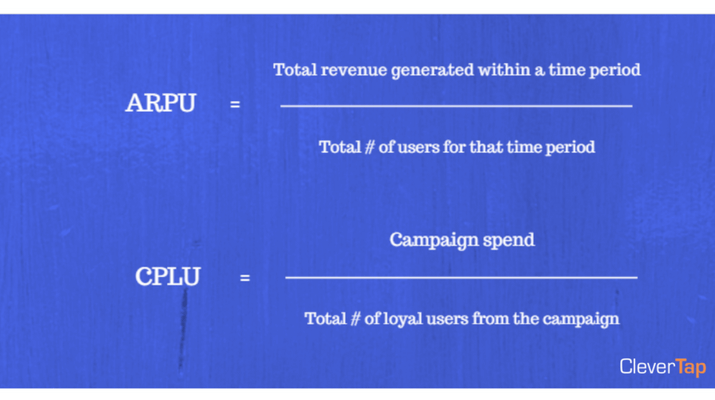
Final thoughts on ROI
As you may have realized, ROI isn’t something that you can get by punching some numbers into a spreadsheet or a calculator.
Your ROI numbers will always have an element of uncertainty, especially if you are a fast growing team with multiple marketing experiments running at any given time.
Instead of absolute numbers, pick one method for ROI and observe the trend over a period of time (assuming that you haven’t drastically changed your marketing strategy).
But even if you don’t have fancy spreadsheets, focus on increasing the ARPU metric while keeping other variables constant.
This simple tweak will guarantee that your app marketing effort is delivering positive ROI.
The Intelligent Mobile Marketing Platform
Tanushree Shenvi 
Tanushree Shenvi is a data-driven marketer with 10+ years of experience in performance marketing and product analytics. She currently leads the Product Intelligence function at CleverTap.
Free Customer Engagement Guides
Join our newsletter for actionable tips and proven strategies to grow your business and engage your customers.
