


Table of Contents
Categories
Most Popular


Customer churn is a critical metric for businesses. It refers to the rate at which customers discontinue their relationship with a company, and understanding this phenomenon is essential for maintaining a healthy customer base and ensuring long-term profitability.
Churn analysis involves examining the reasons behind customer attrition and implementing strategies to mitigate it. This blog will explore what churn analysis is, its benefits, the types of customer churn, how to conduct churn analysis, best practices, and conclude with actionable insights.
What is Churn Analysis?
Churn analysis is the process of assessing customer behavior to understand why customers leave a business and how to improve retention rates. It involves analyzing data related to customer interactions, satisfaction levels, and usage patterns. By identifying trends and patterns in churn data, businesses can gain insights into the underlying causes of customer attrition.
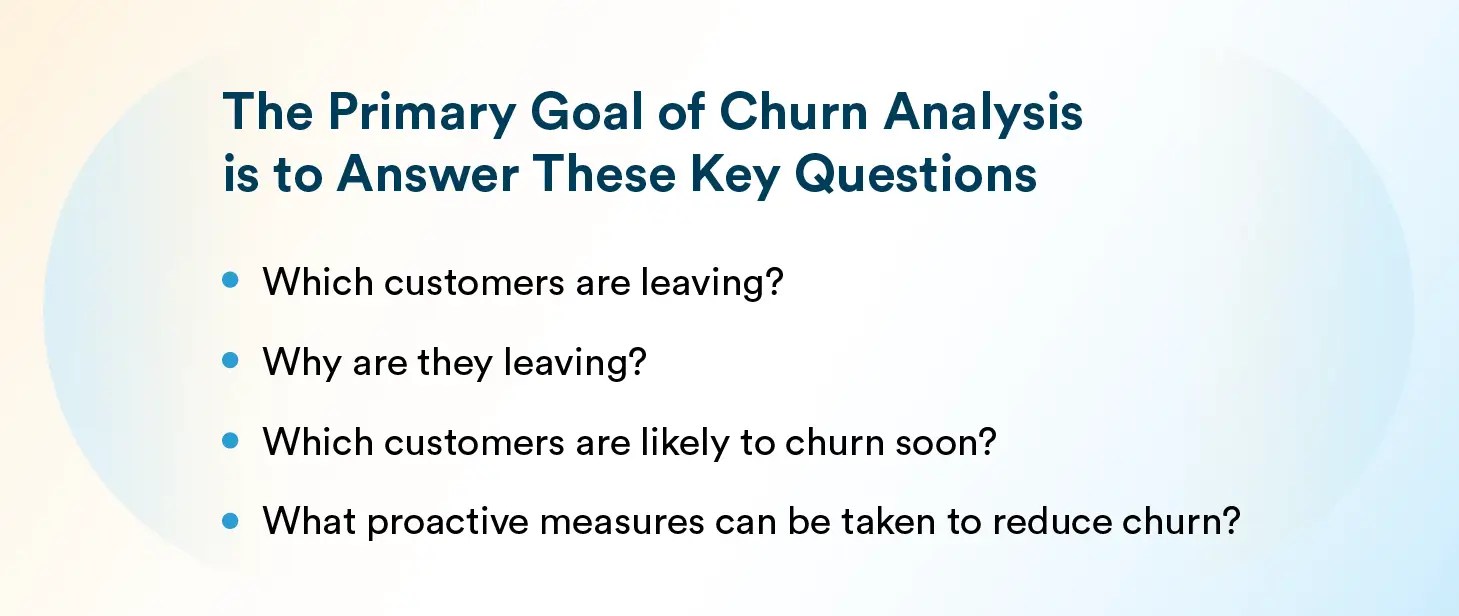
Effective churn analysis goes beyond merely calculating the churn rate; it helps find the motivations behind customer decisions and predict future behaviors based on historical data.
Benefits of Churn Analysis
Churn analysis offers benefits that can significantly impact a business’s bottom line:
- Identifying Weaknesses: By analyzing churn data, businesses can pinpoint weaknesses in their products or services that may be driving customers away. This insight allows for targeted improvements in areas that matter most to customers.
- Uncovering Opportunities: Alongside identifying pain points, churn analysis reveals what customers appreciate about a product. Understanding these strengths can help businesses enhance their offerings and better align with customer preferences.
- Predicting Customer Behavior: Churn analysis enables companies to anticipate which customers are at risk of leaving. By recognizing early warning signs, businesses can implement strategies to retain these customers before they decide to churn.
- Improving Customer Loyalty: Addressing the root causes of churn—such as poor service or unmet needs—can lead to increased customer loyalty and satisfaction, ultimately reducing future attrition rates.
Types of Customer Churn
Understanding the different types of customer churn is essential for effective analysis:
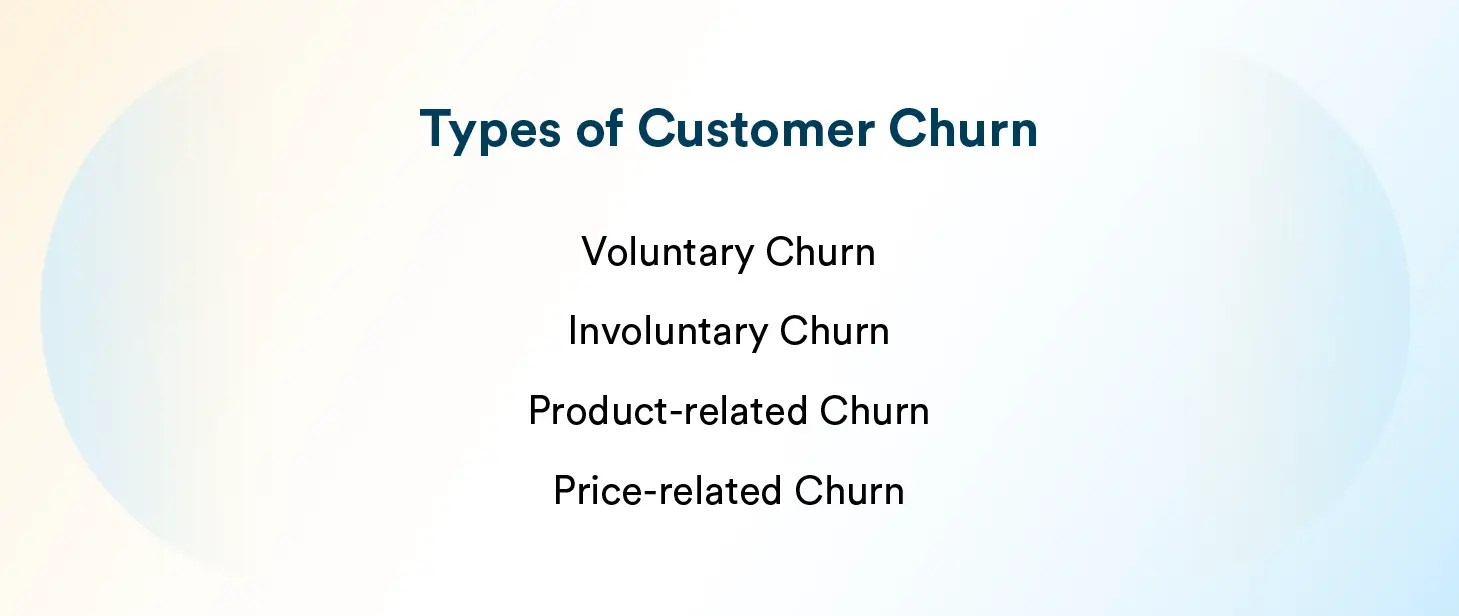
Voluntary Churn
This occurs when customers choose to leave for reasons such as dissatisfaction with the product or service, better alternatives available in the market, or changes in their needs.
For example, a subscriber may cancel their Netflix subscription because they prefer a competing service that offers more appealing content. Or, a user switches from Spotify to Apple Music because they prefer Apple’s ecosystem and seamless integration with their devices.
Involuntary Churn
This type happens when customers leave due to circumstances beyond their control, such as payment failures or account closures. For example, a business may lose access to its cloud storage because of an auto-renewal failure when its corporate credit card expires.
Product-related Churn
Customers may leave if they find that the product does not meet their expectations or lacks essential features. For example, a business may switch from Zoom to Microsoft Teams because Teams offers better integration with Office 365.
Price-related Churn
Price sensitivity can lead customers to seek more affordable options or better value elsewhere. For example, smaller businesses may cancel their Adobe subscription due to rising costs and switch to free or cheaper alternatives.
How to Conduct Churn Analysis
Conducting an effective churn analysis involves several key steps that enable businesses to understand customer attrition and develop strategies to enhance retention. Here’s a detailed breakdown of the process:
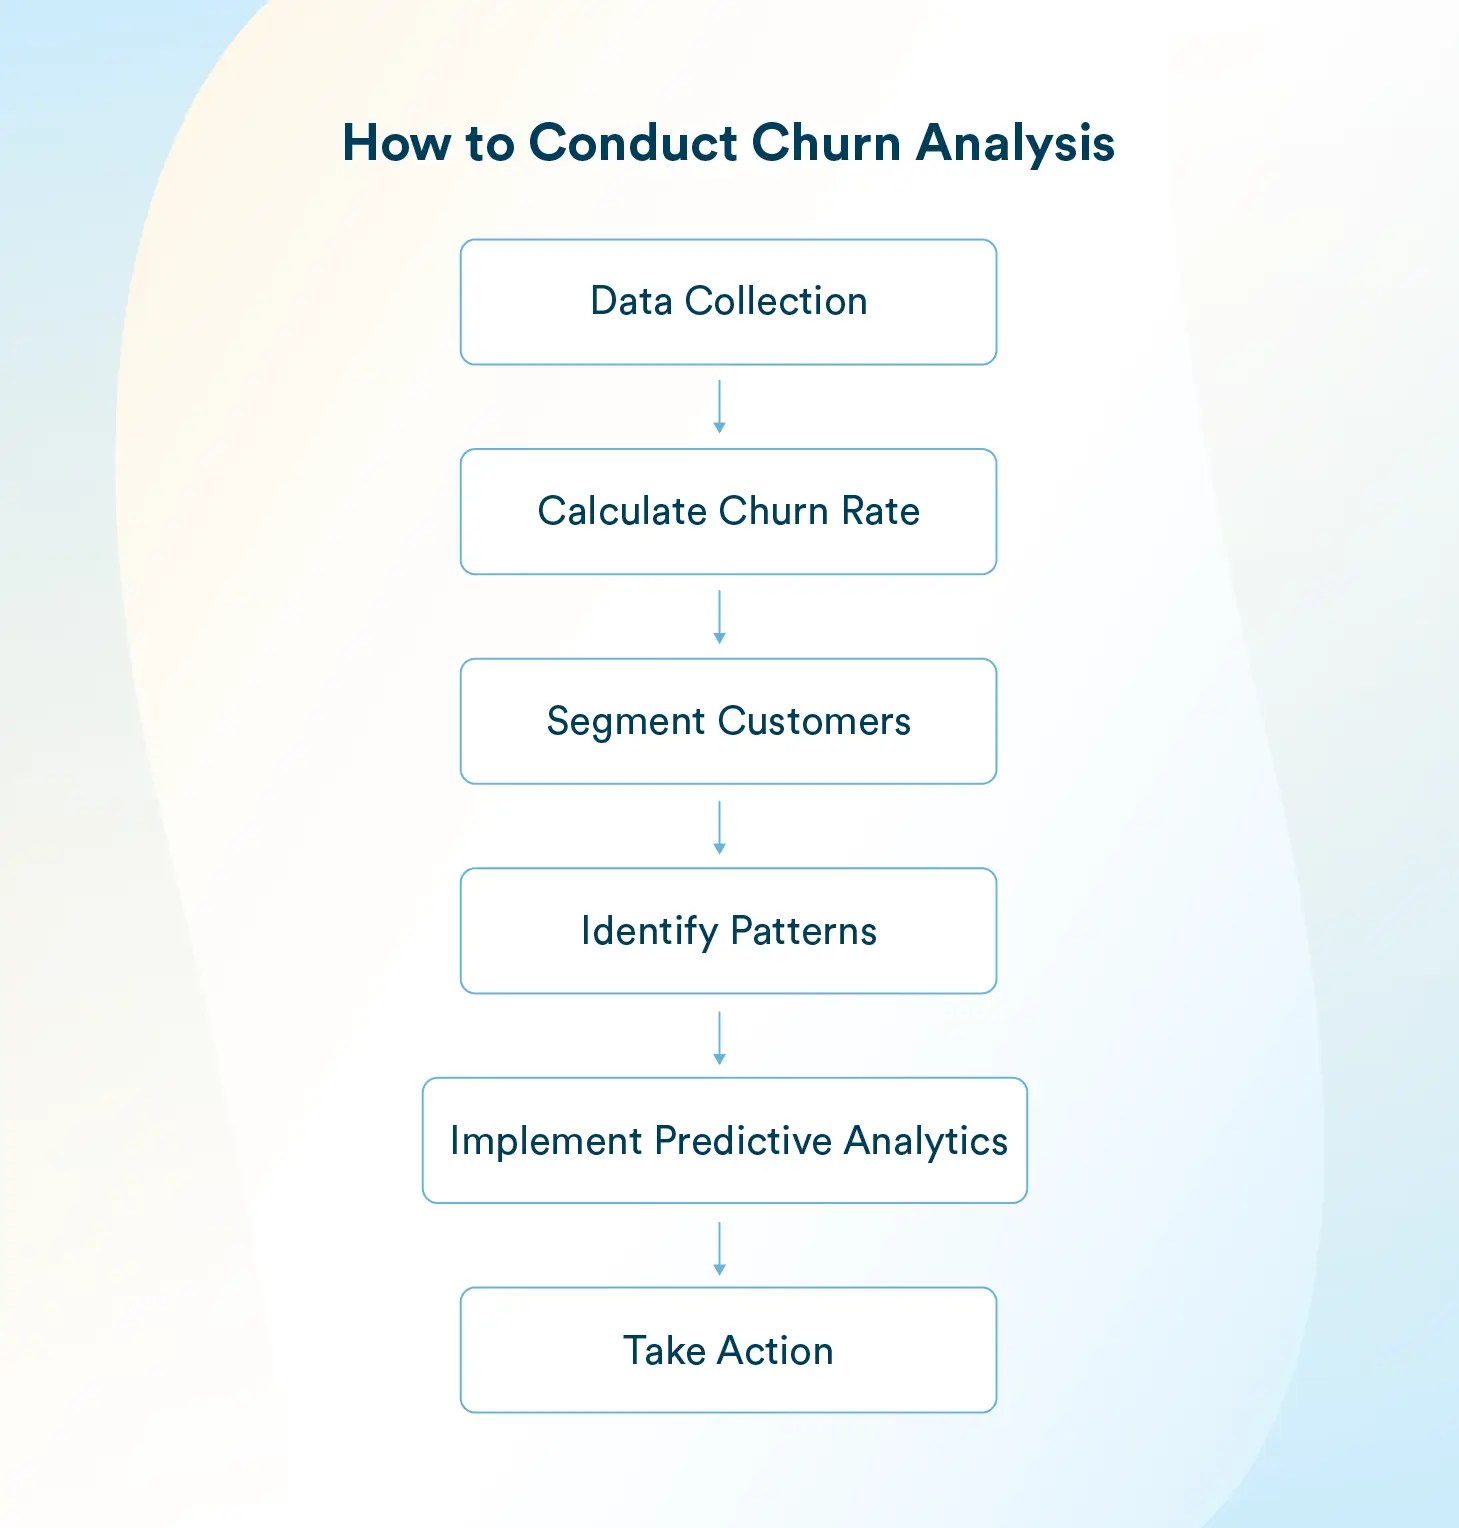
1. Data Collection
The first step in churn analysis is gathering comprehensive data from various sources. This data serves as the foundation for your analysis and should include:
- Customer Feedback Surveys: Collect qualitative insights directly from customers about their experiences, satisfaction levels, and reasons for leaving.
- Usage Statistics: Analyze how frequently customers engage with your product or service, including metrics like login frequency, feature usage, and transaction history.
- Demographic Information: Gather data on customer demographics such as age, location, and account type to identify patterns related to churn.
Ensuring data accuracy and completeness is crucial. Utilize tools like CRM systems, analytics platforms, and customer databases to consolidate information from disparate sources.
2. Calculate Churn Rate
Once you have collected the necessary data, the next step is to calculate your churn rate. This metric provides a clear picture of overall customer retention and is calculated using the following formula:
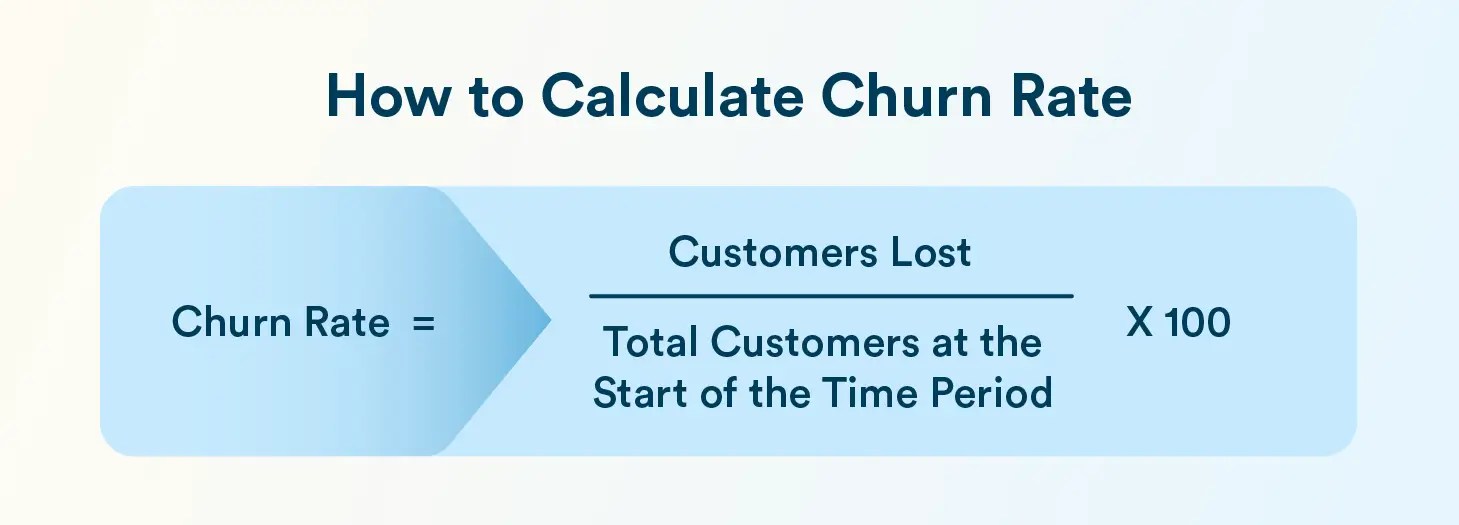
Calculating this rate regularly helps track changes over time and assess the effectiveness of retention strategies.
3. Segment Customers
Customer segmentation is a critical step in understanding churn dynamics. You can identify specific groups at risk of churning by analyzing churn by different customer segments—such as demographics, usage patterns, or revenue contributions.
Common segmentation criteria include:
- Demographic Segmentation: Demographic segmentation helps group customers based on age, gender, location, or other demographic factors.
- Behavioral Segmentation: Behavioral segmentation helps analyze customers based on their engagement levels or product usage patterns.
- Price Segmentation: Price segmentation helps identify high-value customers versus low-value ones to prioritize retention efforts accordingly.
This targeted approach allows for more tailored retention strategies that address the unique needs of different customer groups.
4. Identify Patterns
After segmenting your customers, examine the data for trends and patterns that indicate common reasons for churn. This might include:
- Service Quality Issues: Look for correlations between negative feedback regarding service quality and increased churn rates.
- Lack of Engagement: Identify if lower engagement levels correlate with higher churn rates; for instance, customers who do not use certain features may be more likely to leave.
- Timing of Churn: Analyze when customers tend to leave—whether shortly after onboarding or after a specific time period—which can provide insights into potential gaps in your customer journey.
Utilizing analytical techniques such as cohort analysis can help visualize these trends over time.
5. Implement Predictive Analytics
To take your churn analysis a step further, implement predictive analytics using machine learning models trained on historical data. This proactive approach allows businesses to anticipate which customers are likely to churn in the future.
Key steps include:
- Feature Engineering: Identify relevant features that may influence churn—such as frequency of use or customer support interactions—and prepare them for modeling.
- Model Selection: Choose appropriate machine learning algorithms (e.g., logistic regression, decision trees) based on your data characteristics and business needs.
- Training and Testing: Split your dataset into training and testing sets to validate model performance. Evaluate metrics like accuracy, precision, and recall to ensure reliability.
Predictive analytics provides actionable insights that enable businesses to intervene before customers leave.
6. Take Action
The final step in conducting churn analysis is taking action based on insights gained from your analysis. Develop targeted retention strategies aimed at addressing identified issues and re-engaging at-risk customers.
This involves personalized communication, where you reach out to at-risk customers with tailored messages that specifically address their concerns or needs.
Additionally, improving the customer experience is crucial; utilize feedback from surveys to make necessary adjustments in service delivery or product features. Consider implementing incentives for retention, such as offering discounts or loyalty programs, to encourage continued patronage among high-risk segments.
Implementing these strategies not only helps reduce churn but also fosters stronger relationships with customers by demonstrating a commitment to their satisfaction.
Churn Analysis Best Practices
To maximize the effectiveness of churn analysis, consider these best practices:
- Regular Monitoring: Continuously track your churn rate and analyze trends over time to stay informed about changes in customer behavior.
- Customer Feedback Loops: Implement systems for gathering real-time feedback from customers regarding their experiences and satisfaction levels. This feedback can provide immediate insights into potential issues leading to churn.
- Personalization: Tailor communication and engagement strategies based on individual customer behavior and preferences. Personalized outreach can significantly enhance retention efforts.
- Cross-functional Collaboration: Involve different departments—such as marketing, sales, and customer support—in your churn analysis efforts. A collaborative approach ensures a comprehensive understanding of customer needs across all touchpoints.
- Continuous Improvement: Use insights from churn analysis not only to address current issues but also to innovate and enhance your products or services continually.
Go From Churn Analysis to Action with CleverTap
CleverTap empowers mobile marketers to transition from churn analysis to actionable strategies through its advanced tools and insights. CleverTap’s intent-based segmentation identifies users most likely to churn or achieve specific goals, such as making a purchase. This is achieved by analyzing millions of data points, including:
- Visit Frequency: How often does a user visit the app?
- Campaign Interactions: Which users clicked on specific campaigns?
- Recent Activity: When was a user’s most recent visit?
- Transaction History: How many times has a user transacted in the past?
This deep analysis enables marketers to write long-term engagement strategies that enhance user retention and overall business performance.
Using RFM Analysis to Turn Churn Analysis Into Immediate Campaigns
CleverTap’s RFM analysis tool automatically segments users based on their engagement scores. This allows marketers to pinpoint the following:
- Hibernating Users
- At-Risk Users
- Loyal Customers
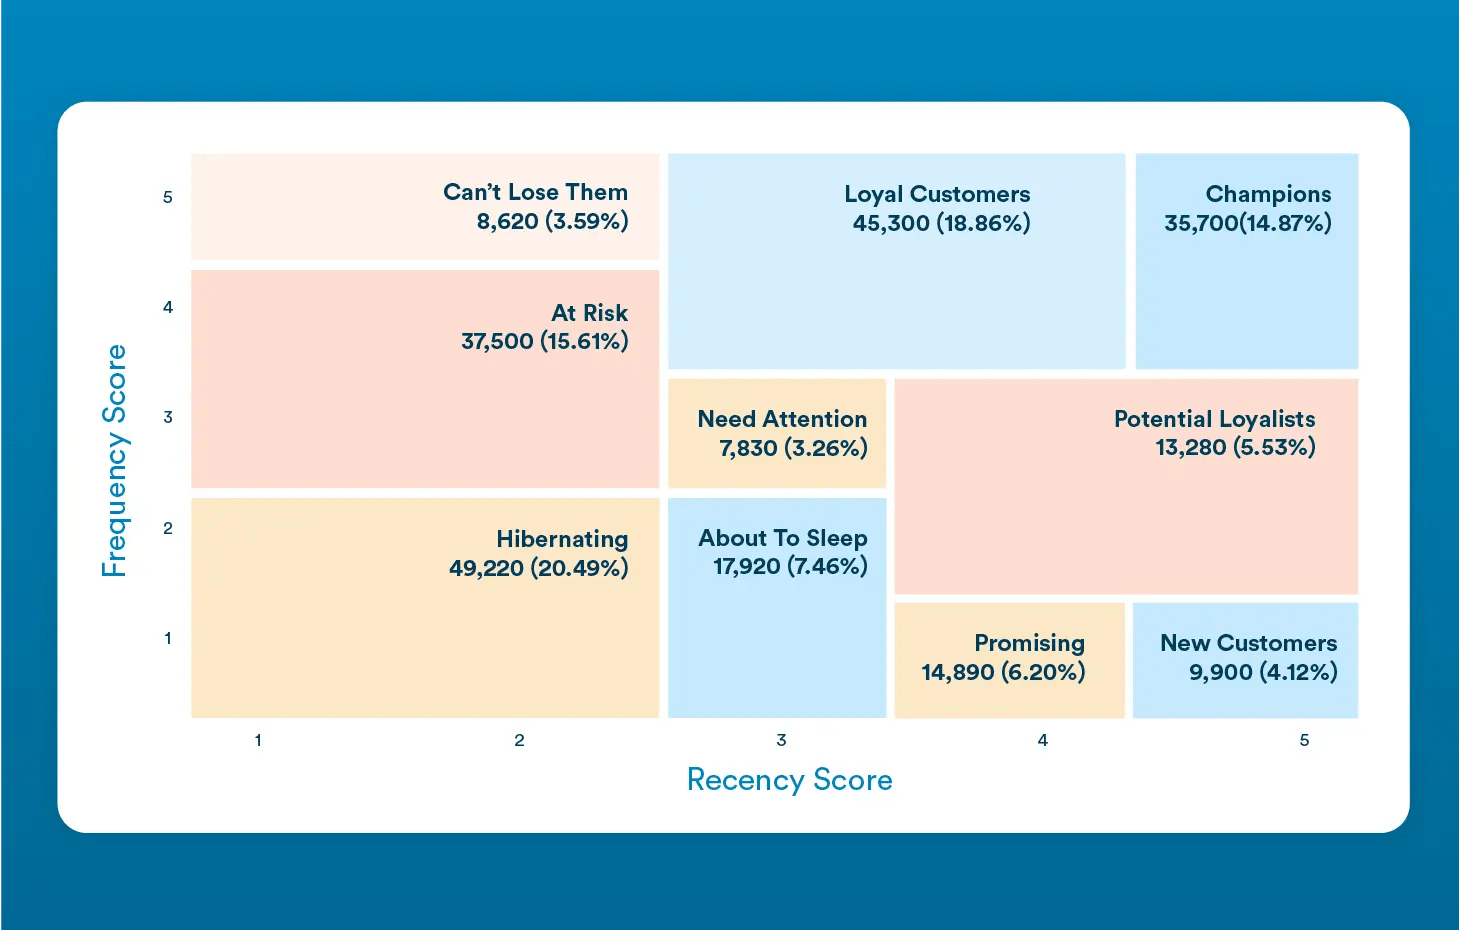
From this intuitive dashboard, marketers can initiate targeted engagement campaigns directly, streamlining the process of reaching out to specific segments.
Beyond identifying potential churn behaviors, CleverTap equips marketers with the tools to act on these insights effectively. By understanding user behavior and engagement patterns, marketers can implement personalized outreach and retention strategies that resonate with their audience.
Ultimately, CleverTap’s comprehensive analytics not only reveal the causes of churn but also enable predictive modeling to identify at-risk users. This lays the groundwork for successful engagement campaigns that foster customer loyalty and drive business growth.
Shivkumar M 
Head Product Launches, Adoption, & Evangelism.Expert in cross channel marketing strategies & platforms.
Free Customer Engagement Guides
Join our newsletter for actionable tips and proven strategies to grow your business and engage your customers.
