


Table of Contents
Categories
Most Popular


An average website conversion rate gives you a baseline of the number of visitors who will take a desired action among the total number of visitors on a website.
This baseline serves as a reality check into how your website is performing and what channels are working for you. In this article, we’ll discuss the conversion rate benchmarks, formula, and strategic ways to improve conversions for your business case.
Let’s quickly brush up on the fundamentals and see how your numbers compare with the average website conversion rate of your industry.
What Is a Website Conversion?
A website conversion occurs when a user completes a site’s target action. For example, in e-commerce, it’s a completed sale or a free trial or demo signup for a SaaS website.
For instance, if 10,000 people visit an online store and 189 buy something, the conversion rate is 1.89%. Each industry interprets conversions differently. However, fundamentally, a visitor action moves business goals forward.
Importance of Tracking Conversion Rates
Conversions bring in business for your brand by moving visitors toward business goals. The more conversions on your website, the better the revenue inflow. Monitoring these conversions gives you clarity about which marketing channels are driving these customers.
Doubling down on these channels uplifts conversion rate, ensuring a bottom-line impact. Suppose a website has 100,000 visitors; an increase in conversions by 1% would mean 1000 more customers. There are a variety of ways you can do this, for example adding trust signals in your checkout flow.
Marketers rely on platforms like CleverTap to monitor conversion funnels. This gives insights into where a user drops off, which leads to strategic funnel optimization and improvement in conversion events.
What Is a Good Average Website Conversion Rate?
The adjective “Good” is subjective when it comes to conversion rates. They vary. For a company, a 44% conversion might be subpar when businesses in other industries celebrate at 10% conversions. However, you’re not here to find a “good website conversion rate.” You need a benchmark to see if your strategies are doing well or are still far behind the industry standards.
For e-commerce, 2-3% conversions are seen as an average. Anything above 3% should be a reasonable conversion rate. In a study of 14 industries conducted by Ruler Analytics, the overall average conversion was 2.9%. There are a few outliers here, for example:
| Industry | Average Conversion Rate |
| Speciality e-commerce sites (niche products) | 7.6% |
| Software-focused sites | 4.1% |
| Art and craft sites | 4.6% |
| Health and wellbeing | 3.56% |
| Kitchen appliances | 2.97% |
| Fashion and accessories | 1.57% |
| Food and beverages | 1.36% |
Sources: Ruler Analytics, Website Builder Expert, Mobiloud
Several other factors play a significant role in estimating conversion. For instance, desktop conversions are consistently higher.
Learn how you can optimize your website conversion rate using 9 effective strategies.
Average Website Conversion Rate: Desktop vs. Mobile
Retail Touchpoints research claims desktop conversion to be at a rate of 3.9%. Mobile conversion is at 1.8%, significantly lower than desktop conversions.
This might be because desktop users are in the buying mode. They have a bigger screen to remain cautious about putting in their sensitive financial records.
Average Website Conversion Rate by Industry
Here’s an overview of average conversion rate benchmarks by industry and their sub-sectors:
- E-Commerce (2%): It starts from 0.78% in baby products to over 4% in arts and crafts.
- Software as a Service (2-5%): Top SaaS websites usually aim for more than 10% conversions.
- Finance (2-5%): This is for banks and credit card sites. Due to the long sales cycle, the rate for insurance is between 1% and 3%.
Sources: Mobiloud, MadX, Pathmonk
The average website conversions for subscription services vary by vertical. In top subscription businesses, the trial-to-paid conversions are decent, but their key is renewal.
Let’s look into more detailed insights into different conversion rates across industries.
Average Website Conversion Rate for E-Commerce
The conversion rate of e-commerce websites hovers between 0.78% and 4%. Research suggests that the average is 2.58%. These conversion rates depend on multiple factors, and most importantly, the product type. For example, a fashion website shows an average conversion of 1.7%. At the same time, conversions from arts and crafts websites are higher, around 4.6%.
Within e-commerce, there are different product categories, and their conversion rates are as mentioned below based on the conversion rate benchmarks by Statista.
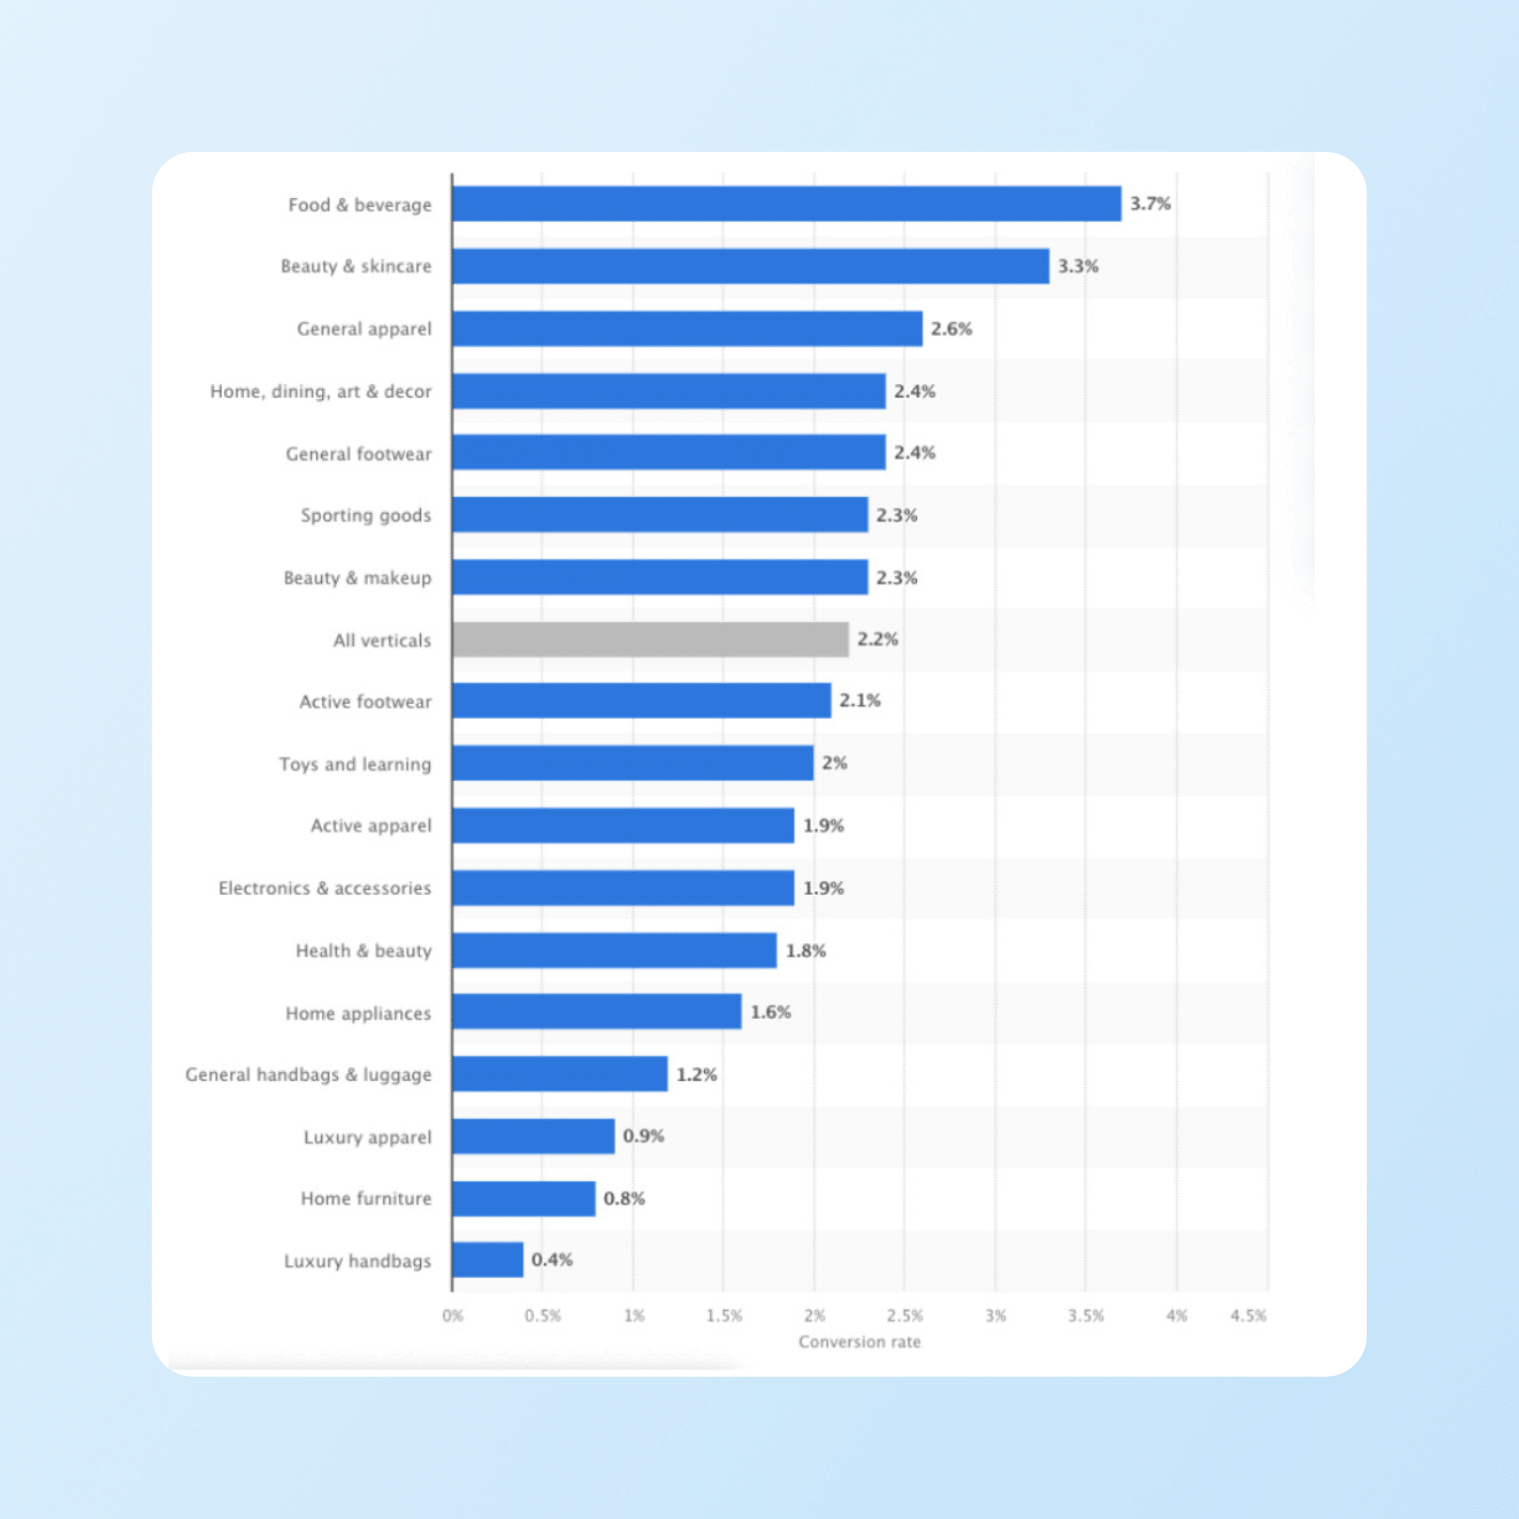
Source: Statista
It’s expected that low-priced items will convert better than costly inventory.
These conversion rates vary across countries, too. For example, the US has a 2.3% conversion rate on its website. Germany has a 2.22% rate while Italy has only 0.99% average conversions. There are different countries like Denmark, the Netherlands, and the United Kingdom, which have 1.8%, 1.78%, and 4.1% conversion rates, respectively.
From a traffic channel perspective, referrals have the highest conversion rate.
CleverTap’s E-Commerce Benchmark Report shows that only 22% of new users purchase within their first month. This highlights the importance of re-engagement and nurturing; many shoppers need multiple touches or more time before they commit.
Average Website Conversion Rate by Traffic Source for E-Commerce Websites
Visitors coming from an email newsletter or referral have a 5% conversion rate, which is better than the 2% conversion rate through organic and 1% through social media and display.
Here’s an overview of conversion rates across different traffic sources in e-commerce:
| Traffic Source | Average Website Conversion Rate |
| 5.2% | |
| Referral | 5.4% |
| Search | 2.1% |
| Paid ads | 1.4% |
| Social | 0.7% |
Source: Mobiloud
The context defines whether an e-commerce conversion rate is good or bad. A 5% conversion rate is excellent for an e-commerce site. Services sectors like healthcare and finance have an average website conversion rate of between 2% and 4%. In healthcare specifically, if you have a conversion rate above 10%, it’s considered exceptionally “good”.
Average Website Conversion Rates for SaaS Websites
SaaS businesses have low-touch and high-touch models. Low-touch companies use their websites to attract visitors to sign up for free trials and subscriptions. High-touch business models focus on enterprise-level demo requests and more direct sales. Since the sales process differs for each business model, their conversion goals are different.
| Type | Average Conversion Rate |
| Free trials without credit card requirements | 8 to 10% |
| Free trials with credit card registration requirements | 25% |
| Freemiums | 1 – 10% |
Sources: SmartKarrot, TechCrunch
For high-touch business models, there are different conversion events across the funnel. If we are to concentrate on website conversions, the conversion rates here would be lower than the low-touch models. The average conversion rate benchmark is around 0.05% from top to bottom funnel.
Average Website Conversion Rate for Financial Services Websites
According to Unbounce, the median website conversion rate in the financial services sector is 8.3%. However, performance varies significantly across subcategories:
- Insurance: Leads the pack with a remarkable 18.2% conversion rate, outperforming the sector median by 119%.
- Credit and Lending: Slightly above the median at 8.8%, indicating steady performance.
- Investing: Lags behind with a 3.9% conversion rate, highlighting potential areas for improvement.
These insights underscore the importance of tailoring strategies to specific financial subcategories to optimize average website conversion rates. The report found that content written at a 5th to 7th-grade reading level achieves the highest median conversion rate of 18.1%. This means that when content is simple and easy to understand, visitors are more likely to take action.
Unlike most industries, financial services are seeing stronger performance on mobile than desktop. Mobile traffic boasts an average conversion rate of 11.5%, outpacing both desktop (9%) and the all-industry median (11.2%). It’s a clear sign that mobile isn’t just a secondary touchpoint—it’s a conversion powerhouse.
Meanwhile, desktop is lagging, falling below the all-industry median of 12.1%. This gap highlights a pressing opportunity: optimize your desktop experience to stay competitive.
Average Website Conversion Rate for Travel Websites
Travel websites face steep challenges, with an average conversion rate of just 0.2%. The top performers, however, show what’s possible—the best 20% convert at 2%, while the top 10% reach an impressive 3.4%. On the flip side, sites converting at below 0.1% fall into the bottom 20%.
When it comes to device performance, mobile conversions average only 0.1%, while desktop edges ahead at 0.5%. These numbers underscore the need for razor-sharp UX and a frictionless booking experience to rise above the competition.
How to Calculate Website Conversion Rate
The formula to calculate a website’s conversion rate is simple:
Website Conversion Rate = (Conversions ÷ Visitors) × 100%

When calculating the conversion rate, you need to follow the steps below.
- Choose The Conversion Event: Decide what action counts as a conversion (purchase, form submission, signup, etc.).
- Count Conversions and Visitors: Tally the total number of times the conversion happened (numerator) and the total unique visitors (denominator) over the same time period.
- Apply the Formula: Put these numbers into the formula to get the conversion rate value.
Make sure the measurement parameters are consistent, such as monthly visitors vs. monthly conversions. Segment this data based on device or channel to identify the most fruitful source.
Most analytics tools will do this math automatically. The best ones will explain why conversion might not have happened. It’s advisable to onboard analytics tools that simultaneously take care of the former and the latter.
Get a list of 26 essential conversion rate metrics to track.
Strategies to Improve Average Website Conversion Rate
Below are a few strategies that help websites across different domains improve conversions.
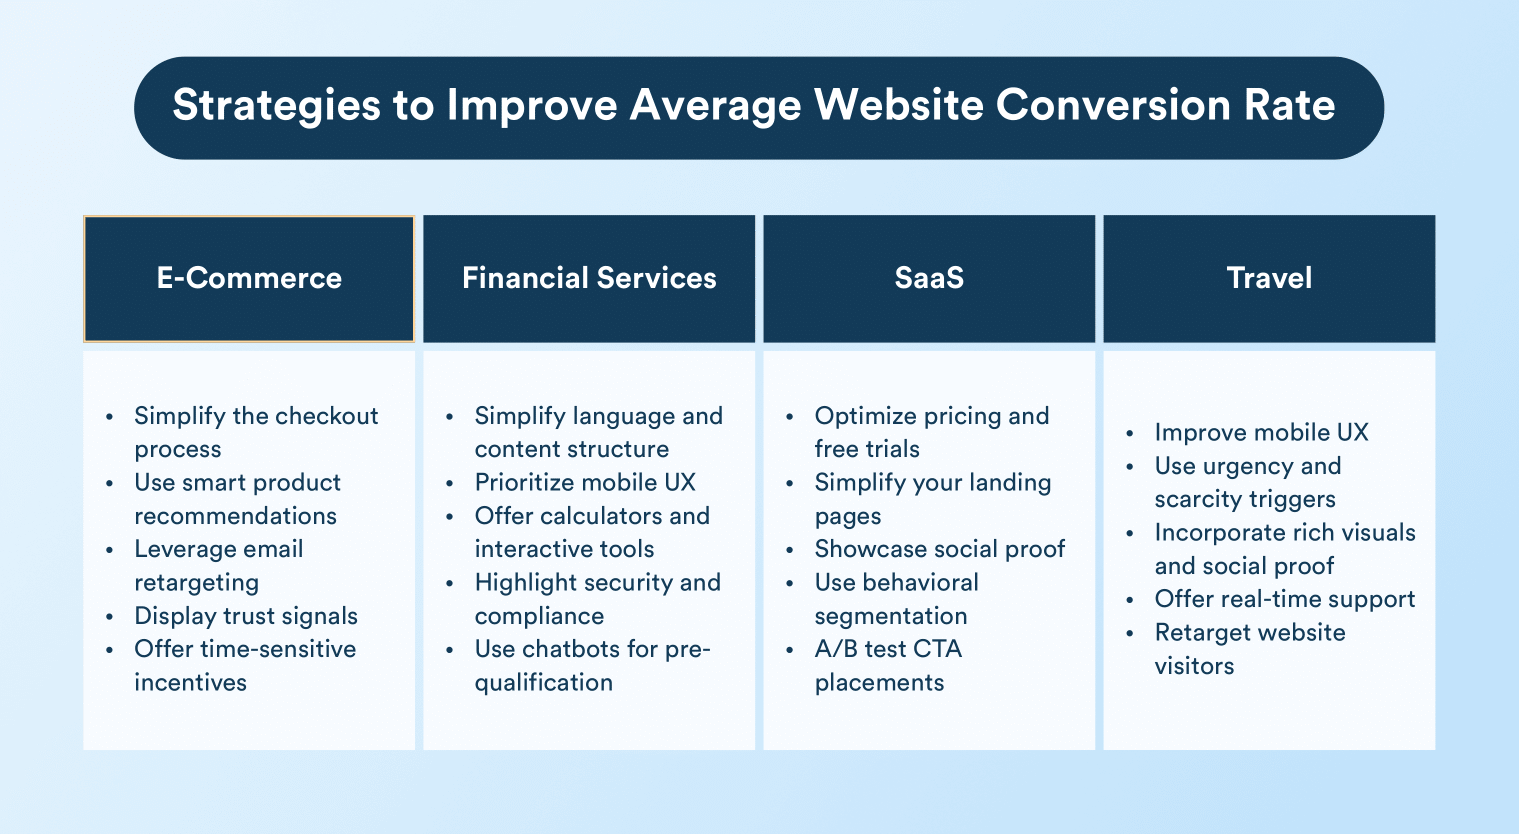
1. E-Commerce
Pain Points: High cart abandonment, mobile friction, product discovery issues.
Strategies:
- Simplify the Checkout Process: Remove unnecessary fields and offer guest mobile checkout options.
- Use Smart Product Recommendations: Personalize product suggestions based on user behavior to drive impulse buys.
- Leverage Email Retargeting: Recover lost sales with abandoned cart emails and re-engagement flows.
- Display Trust Signals: Show reviews, secure payment badges, and return policies to boost buyer confidence.
- Offer Time-Sensitive Incentives: Discounts, limited-time offers, or low-stock alerts can nudge indecisive shoppers.
2. Financial Services
Pain Points: Complex content, lack of trust, mobile-first challenges.
Strategies:
- Simplify Language and Content Structure: Use plain language at a 5th-7th grade reading level to increase comprehension and action.
- Prioritize Mobile UX: Since mobile outperforms desktop, ensure mobile pages are fast, responsive, and form fields are thumb-friendly.
- Offer Calculators and Interactive Tools: These help users make informed decisions and keep them engaged longer.
- Highlight Security and Compliance: Assure users of data safety through SSL badges, privacy policies, and certifications.
- Use Chatbots for Pre-Qualification: Engage users instantly and help them find the right product or plan without friction.
Learn how to improve conversion rates for fintech apps.
3. SaaS
Pain Points: Unclear value proposition, friction in onboarding, long consideration cycles.
Strategies:
- Optimize Pricing and Free Trials: Make signups easy, preferably without credit card requirements, and use onboarding emails to nurture trial users.
- Simplify Your Landing Pages: Remove clutter and focus on a single CTA (e.g., “Start Free Trial” or “Book a Demo”).
- Showcase Social Proof: Display logos of major customers, testimonials, and user success stories to build trust.
- Use Behavioral Segmentation: Trigger in-app messages or emails based on trial activity to guide users toward activation.
- A/B Test CTA Placements: Test button copy, color, and placement to find what drives more sign-ups.
4. Travel
Pain Points: High research phase, device performance gap, complicated booking flows.
Strategies:
- Improve Mobile UX: Optimize loading speed, simplify date pickers, and streamline booking forms for small screens.
- Use Urgency and Scarcity Triggers: “Only 2 rooms left!” or “Booked 4 times in the last 24 hours” nudges action.
- Incorporate Rich Visuals and Social Proof: High-quality images and user-generated content (reviews, photos) instill confidence.
- Offer Real-Time Support: Live chat or chatbot assistance during booking reduces drop-offs and answers objections.
- Retarget Website Visitors: Use dynamic ads or personalized emails to remind visitors of trips they browsed but didn’t book.
Learn how to improve app conversion rate with these 25 proven strategies.
How to Meet the Average Website Conversion Rate Benchmark for Your Industry Using CleverTap
Looking to boost your website conversions and streamline engagement across the customer lifecycle? CleverTap helps you follow conversion rate optimization best practices easily and delivers a comprehensive growth engine, merging analytics, automation, and personalization, so you can turn insights into action from one powerful platform.
Unified Analytics & Real-Time Intelligence
CleverTap’s real-time dashboards, funnel and cohort analysis, and unified customer views help you identify friction points and growth opportunities across devices and platforms.
Hyper-Personalization at Scale
Say goodbye to generic messaging. With behavioral segmentation, dynamic content delivery, and AI-powered predictive modeling, you can craft hyper-relevant experiences for every user.
Omnichannel Campaign Management
Engage users where they are—be it through email, push notifications, SMS, WhatsApp, or in-app messaging. Orchestrate synchronized campaigns that create seamless, high-impact journeys across all touchpoints.
Built for Scale, Designed for Simplicity
Whether you’re a startup or an enterprise, CleverTap’s intuitive UI, pre-built integrations, and enterprise-level security ensure easy onboarding, reliable performance, and peace of mind.
Lifecycle & Conversion Optimization
Drive conversions with tools like Lifecycle Optimizer to map and automate user journeys. Use segmentation to personalize every touchpoint and trigger intelligent actions—like recovering abandoned carts—at just the right moment.
Transparent Performance Tracking
With custom metrics, granular KPIs, and detailed reporting, CleverTap enables continuous optimization. Identify what works, test what doesn’t, and fine-tune strategies to maximize your ROI.
Book a CleverTap demo and explore how it can help you increase conversions.
Improve Conversions Strategically
You don’t need conversions to skyrocket and nosedive frequently. Increase them in a scalable way for your business, where you can reuse strategies to ensure a permanent increase in the number of users who take a desired action. Benchmarks will give you a baseline, but each business must compare against its own vertical and traffic mix.
Improving website conversion is an ongoing job, which means you need scalable technology and a process that scales as you grow. CleverTap is a reliable choice as it delivers the full functionality you need today and will require in the foreseeable future.
Agnishwar Banerjee 
Leads content and digital marketing.Expert in SaaS sales, marketing and GTM strategies.
Free Customer Engagement Guides
Join our newsletter for actionable tips and proven strategies to grow your business and engage your customers.
