


Table of Contents
Categories
Most Popular


Modern customer loyalty blends repeat business and emotional advocacy. Loyal customers deliver a higher lifetime value as they stay longer. With a history of memorable experiences with the brand, they start advocating for your business.
Forrester reports that companies obsessed with their customers enjoy 51% higher retention and 49% faster profit growth than their peers. Even the slightest effort to improve customer loyalty directly affects profits. True loyalty may seem irrational in a world of better alternatives, but it remains a powerful and persistent force in consumer behavior.
This makes measuring and optimizing customer loyalty key for marketers expecting higher value from similar acquisition investments. In this blog, you’ll get precise input on how to measure customer loyalty and ways to optimize it with the right technological intervention.
What Is Customer Loyalty?
Customer loyalty means your users keep returning to your brand to make purchases. They choose your brand, even when they have other options. It’s like when someone always buys coffee from the same cafe, not because there aren’t others around, but because they trust it, like it, and feel connected.
Customer loyalty matters a lot since loyal customers stay longer, spend more, tell others, and cost less if you look back while measuring the ROI. Loyalty makes users stick with the application over time, offering better user retention values. They make repeat purchases and become potential opportunities for your team to upsell and cross-sell for revenue expansion.
Most importantly, keeping a user is cheaper than getting one. For a 5% increase in customer retention, your profits shoot up by 25% to 95%. It’s all about establishing trust and strengthening it with every interaction.
When you’re doubling down on building customer loyalty, there are two types of customer loyalty you’ll come across:
Types of Customer Loyalty: Behavioral vs. Emotional Loyalty
Customer loyalty has two sides: Behavioral loyalty and emotional loyalty.
Behavioral Loyalty describes the mere repetition of a purchase without any considerations justifying such a behavior, and no clear preference for the goods or services purchased. It’s just a habit. For example, if a customer is habituated to ordering milk from Blinkit, an instant commerce company, they may be reluctant to take a milk subscription from a brand that delivers milk to their doorstep.
Many emotions can fuel this habit, but they’re not directly related to the purchase. For example, if they travel a lot, and are impromptu most of the time, Blinkit lets them order at will and be free from any anxiety coming from milk cartons waiting at their doorstep.
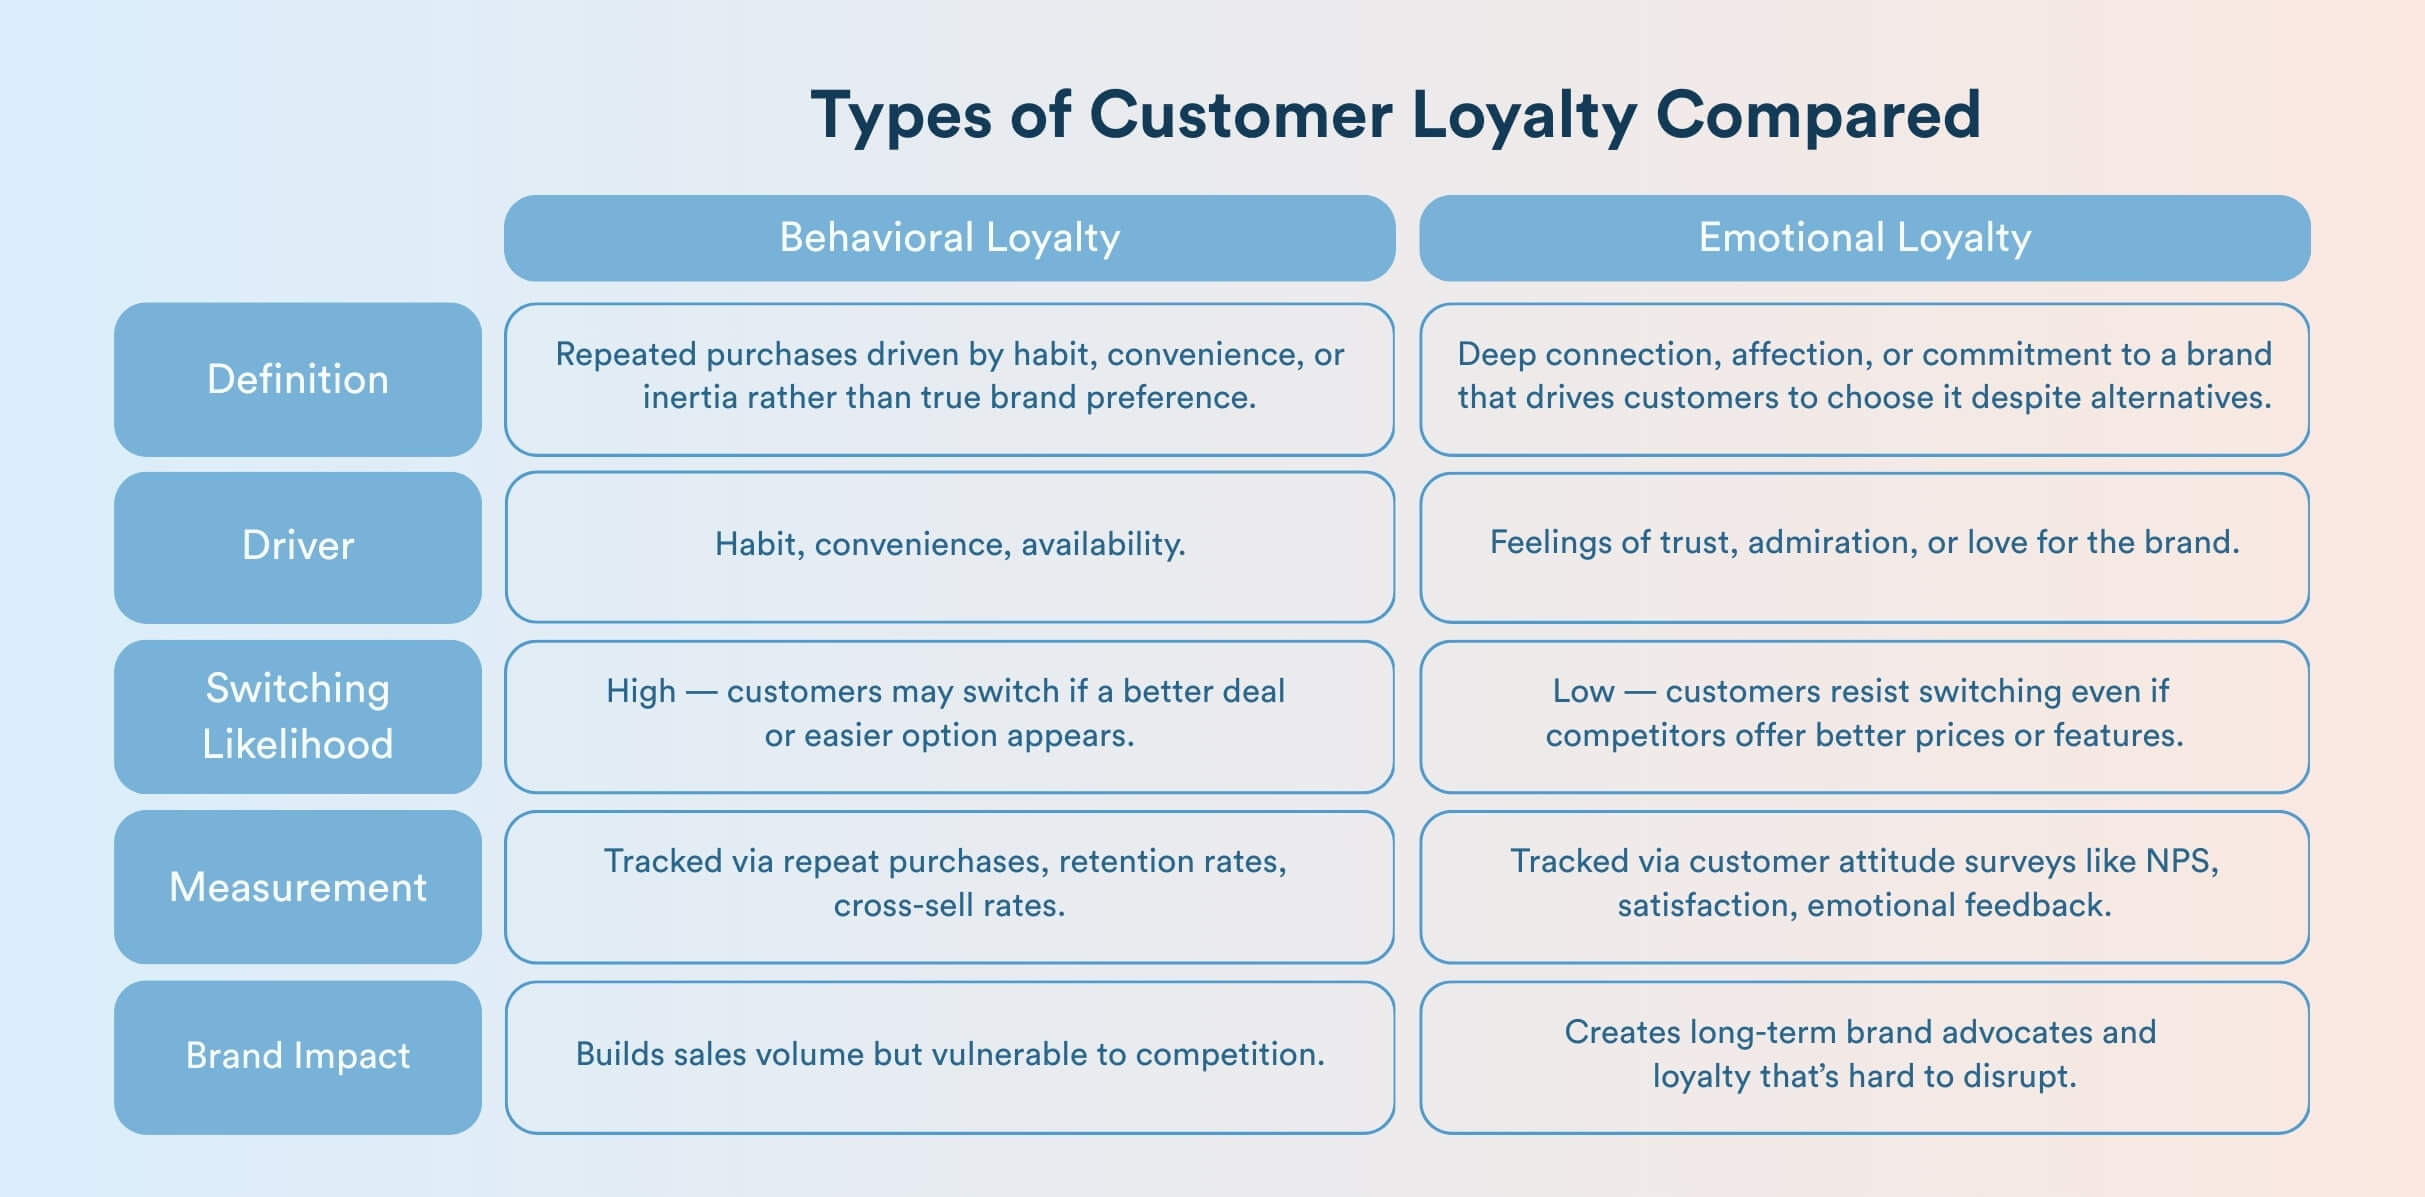
Emotional loyalty stems from feeling and deep commitment or affection for a brand.
Richard L Oliver, a researcher in consumer psychology, notes in his research that:
“Loyalty is not just repeat purchase. It is an enduring preference that persists despite better prices, quality, or features. When brands build such an emotional connection with customers, they reach an adoration phase, where customers don’t think about alternatives. It’s like being in love with the brand.”
For example, Apple fans will choose the brand even when it’s not the cheapest or most convenient.
When you’re practicing building customer loyalty for your brand, both types matter. Behavioral customer loyalty metrics are comparatively easier to track through repeat purchases or cross-sell rates. You have NPS and satisfaction scores to hint at the emotional loyalty.
Savvy brands correlate customer attitude and emotional feedback, such as NPS or satisfaction surveys, with their behavioral metrics. This allows them to understand the consumer psychology surrounding purchasing from a brand.
How to Measure Customer Loyalty: Top 9 Metrics
Check out the top customer loyalty metrics brands rely on day-to-day to double down on retention and increase LTV. Here’s an overview of customer loyalty metrics you should track for your brand.
A Customer Loyalty Metrics Cheat Sheet
| Metric | What It Measures | How to Calculate (Formula) | Why It Matters |
| Net Promoter Score (NPS) | Customer advocacy | Survey customers on a 0–10 scale; %Promoters (9–10) minus %Detractors (0–6). | NPS gauges emotional loyalty and advocacy. High scores mean strong word-of-mouth; companies with high NPS see faster revenue gains. |
| Customer Retention Rate | Portion of customers who stay over time | Retention Rate = (Number of customers at end of period ÷ Number at start) × 100 | Retention is a fundamental loyalty measure. Improving retention even by a few points dramatically increases profits. |
| Repeat Purchase Rate | Share of customers making at least two purchases | (Customers with ≥2 purchases ÷ Total customers) × 100. | It’s easier to build loyalty with repeat customers. |
| Upsell/Cross-Sell Rate | The extent to which customers are buying more products | (Customers who purchased additional products or upgraded ÷ Total customers) × 100 | Help you assess if customers trust you enough to try more |
| Customer LifeTime Value | Total expected profit from a customer over their retention period | (Average order value × Average purchase frequency per period × Average customer lifespan) × Profit margin. | CLV links loyalty to revenue. |
| Customer Loyalty Index (CLI) | Composite of intent-to-buy, repeat, and cross-buy | Survey customers on three questions (e.g., likelihood to recommend, repurchase, or try new offerings) on a 1–6 scale. CLI = the average of the three scores. | CLI captures loyalty sentiment beyond NPS |
| Customer Satisfaction Score | Immediate satisfaction with a recent experience | (% of responses rating 4 or 5) × 100%. | It measures customer satisfaction across specific touchpoints that build customer loyalty. |
| Churn rate | The rate at which customers stop doing business with your brand | (Customers lost during period ÷ Customers at start) × 100%. | Churn highlights problems wth price, experience, or value. |
| Referral Rate | Share of new customers from referrals | (New customers acquired via referral ÷ Total new customers) × 100%. | Shows how happy and loyal your current customers are, as they feel encouraged to bring their friends. |
Tip: Bookmark this article to make this customer loyalty metrics cheat sheet accessible.
1. Net Promoter Score (NPS)
NPS measures customer advocacy, which is the willingness to recommend your brand. You survey customers with questions like, “How likely are you to recommend us to your friends and relatives?” The answer is on a scale of 0 to 10, where 9 and 10 scores are promoters, whereas 0 to 6 are detractors.
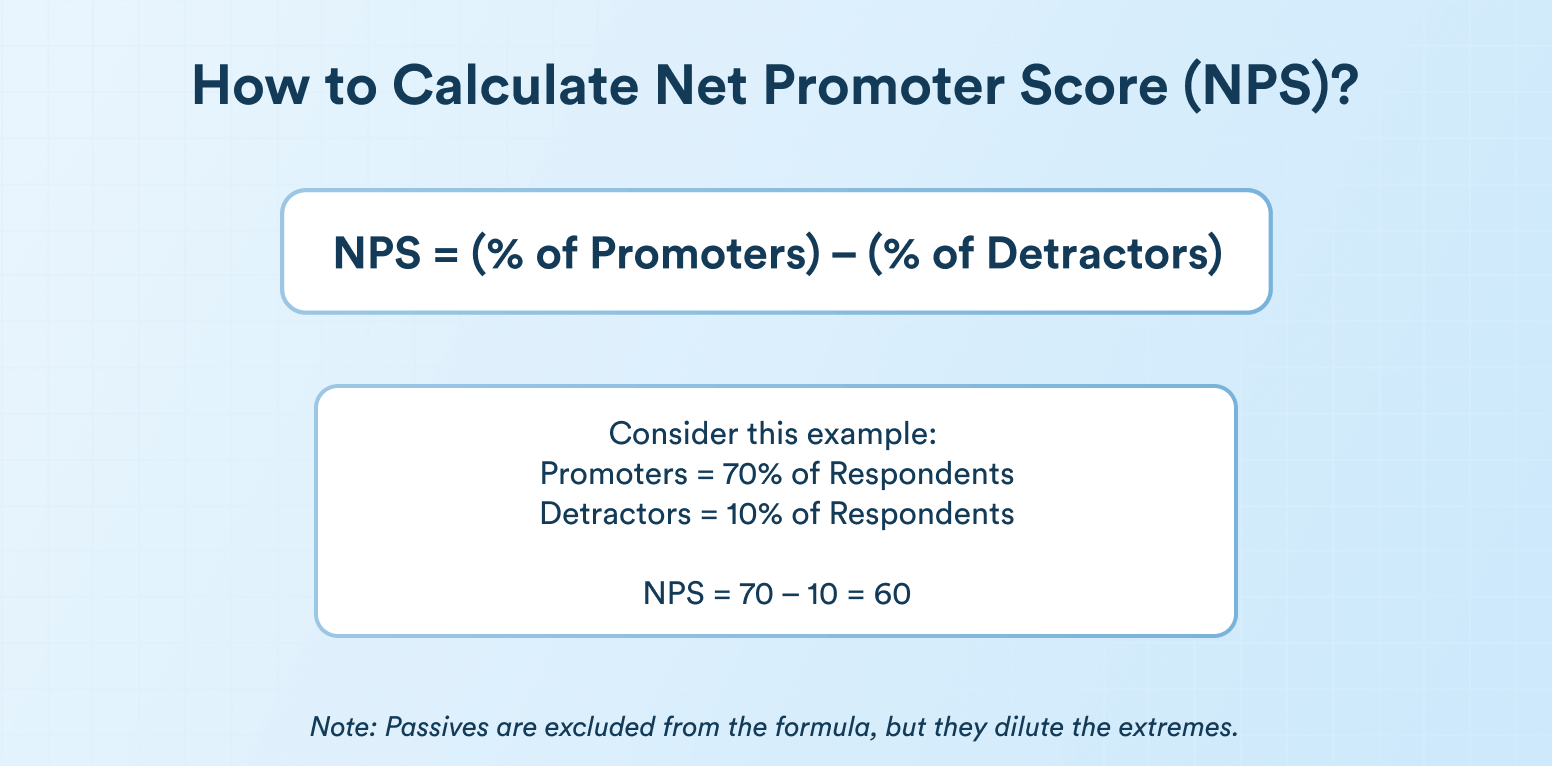
NPS estimates emotional loyalty and advocacy. High scores mean strong word-of-mouth. An NPS above 50 is considered excellent; above 80 is world-class. However, NPS is a one-time sentiment snapshot that doesn’t capture repurchases. It is best to use NPS with other metrics to get a complete picture.
Learn more about NPS and ways to improve it for customer advocacy.
2. Customer Retention Rate
Customer retention rate measures the portion of customers who stay over time.
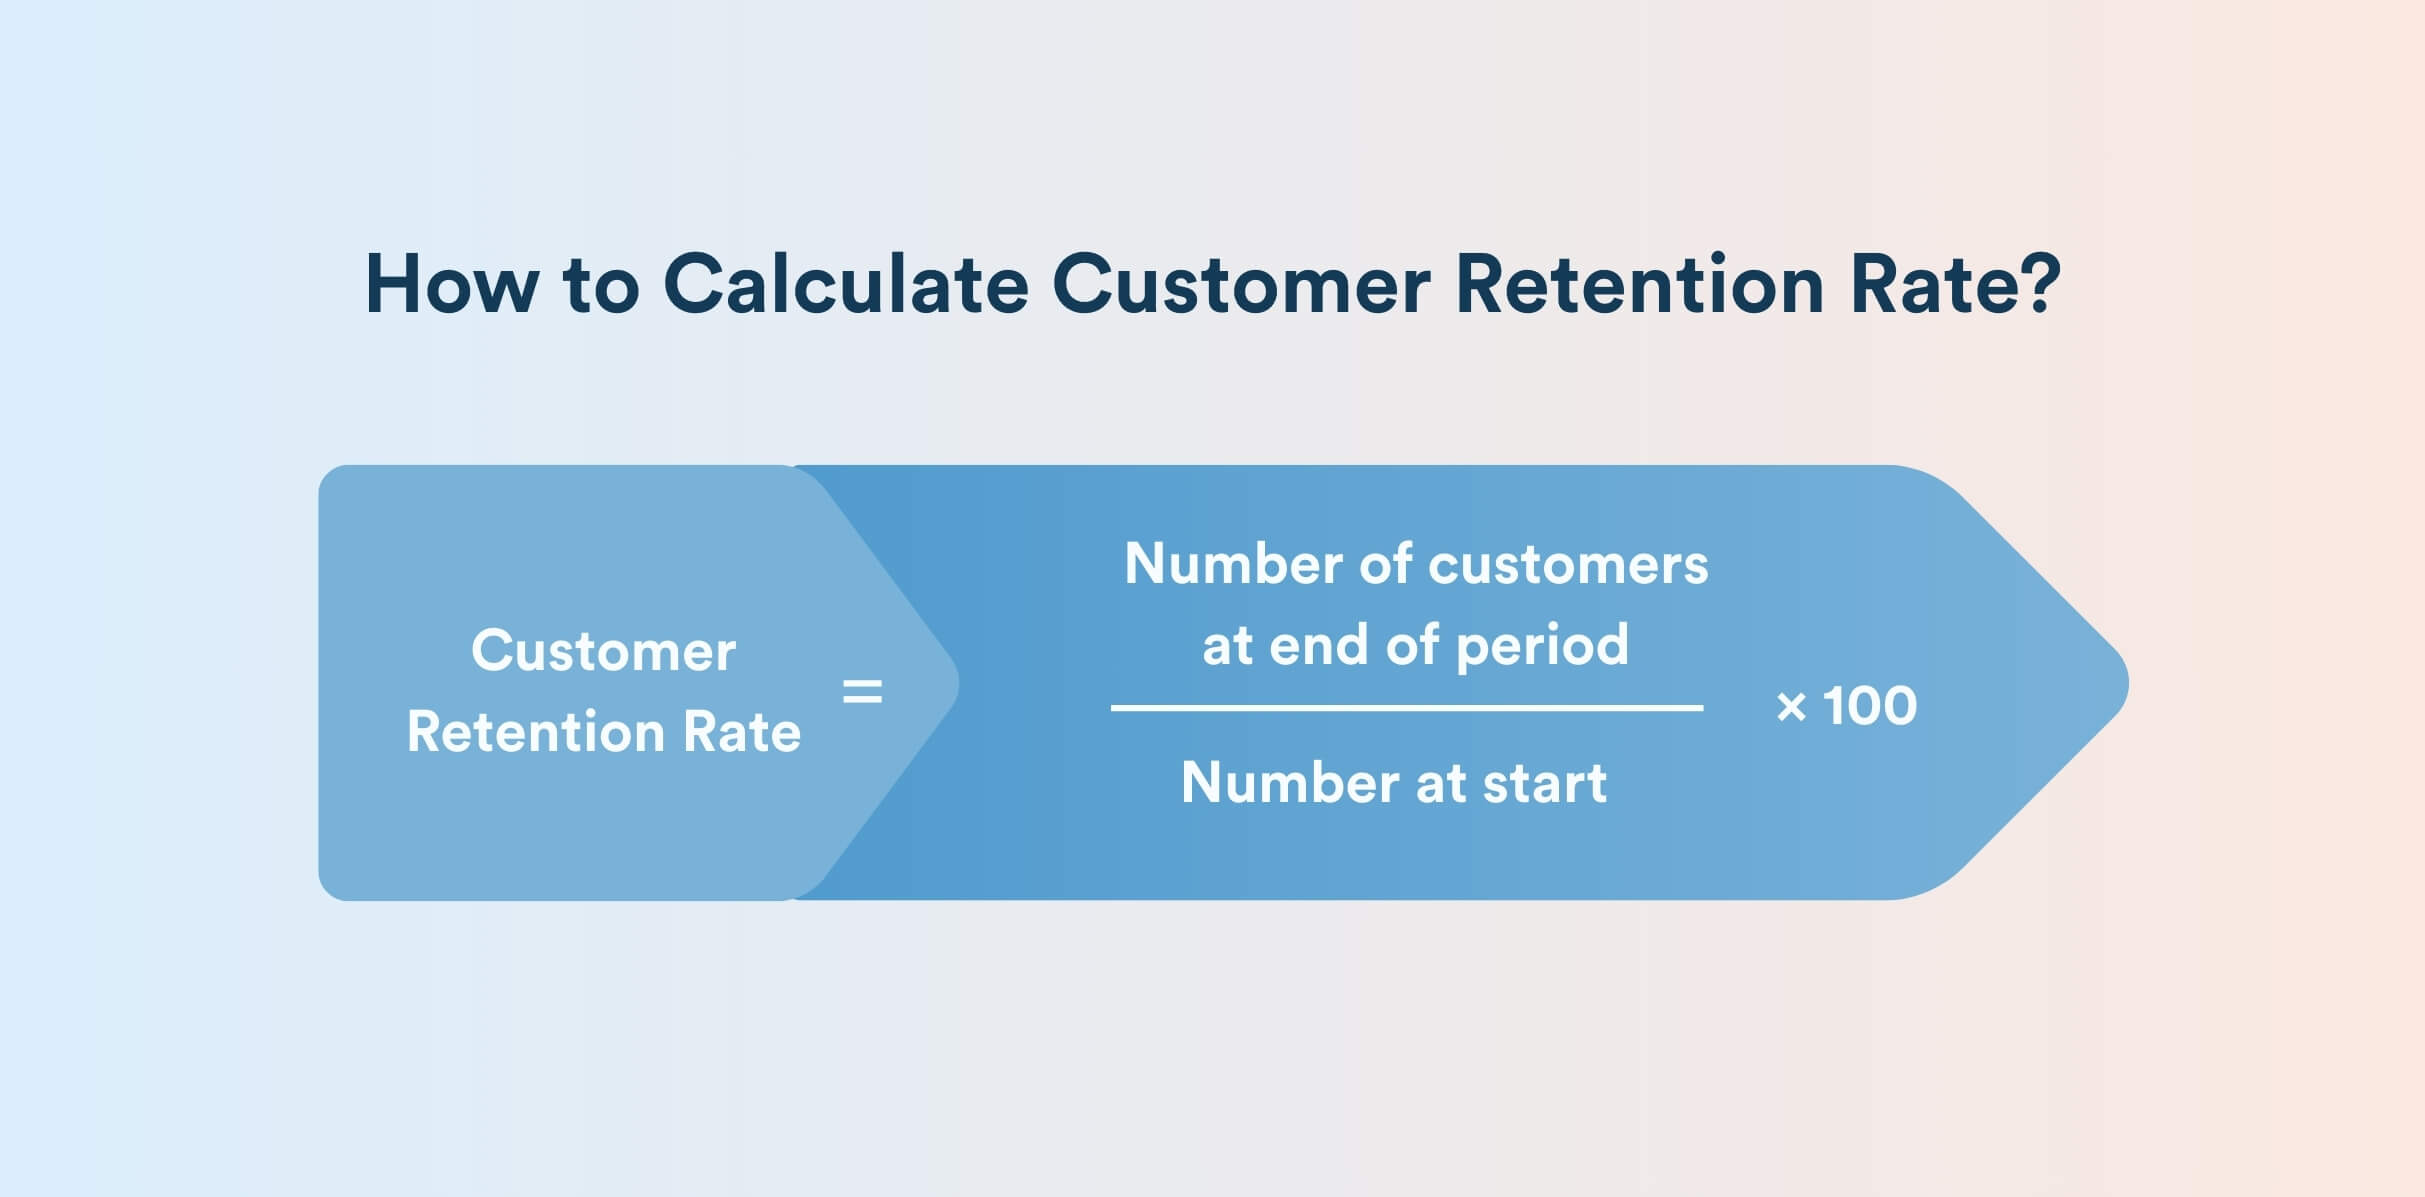
Customer Retention Rate = (Number of customers at end of period ÷ Number at start) × 100
High retention means customers keep coming back.
The retention rate varies by industry; for example, the average retention rate in these sectors is as follows:
- Retail: 63%
- Financial Services: 78%
- IT services: 81%
- Hospitality and Travel: 55%
It’s best to track the customer retention rate in different cohorts, such as one-month or six-month retention rates after the first purchase. Analytics based on a timeline give you a better understanding of what to optimize.
3. Repeat Purchase Rate
It’s the share of customers making at least two purchases.
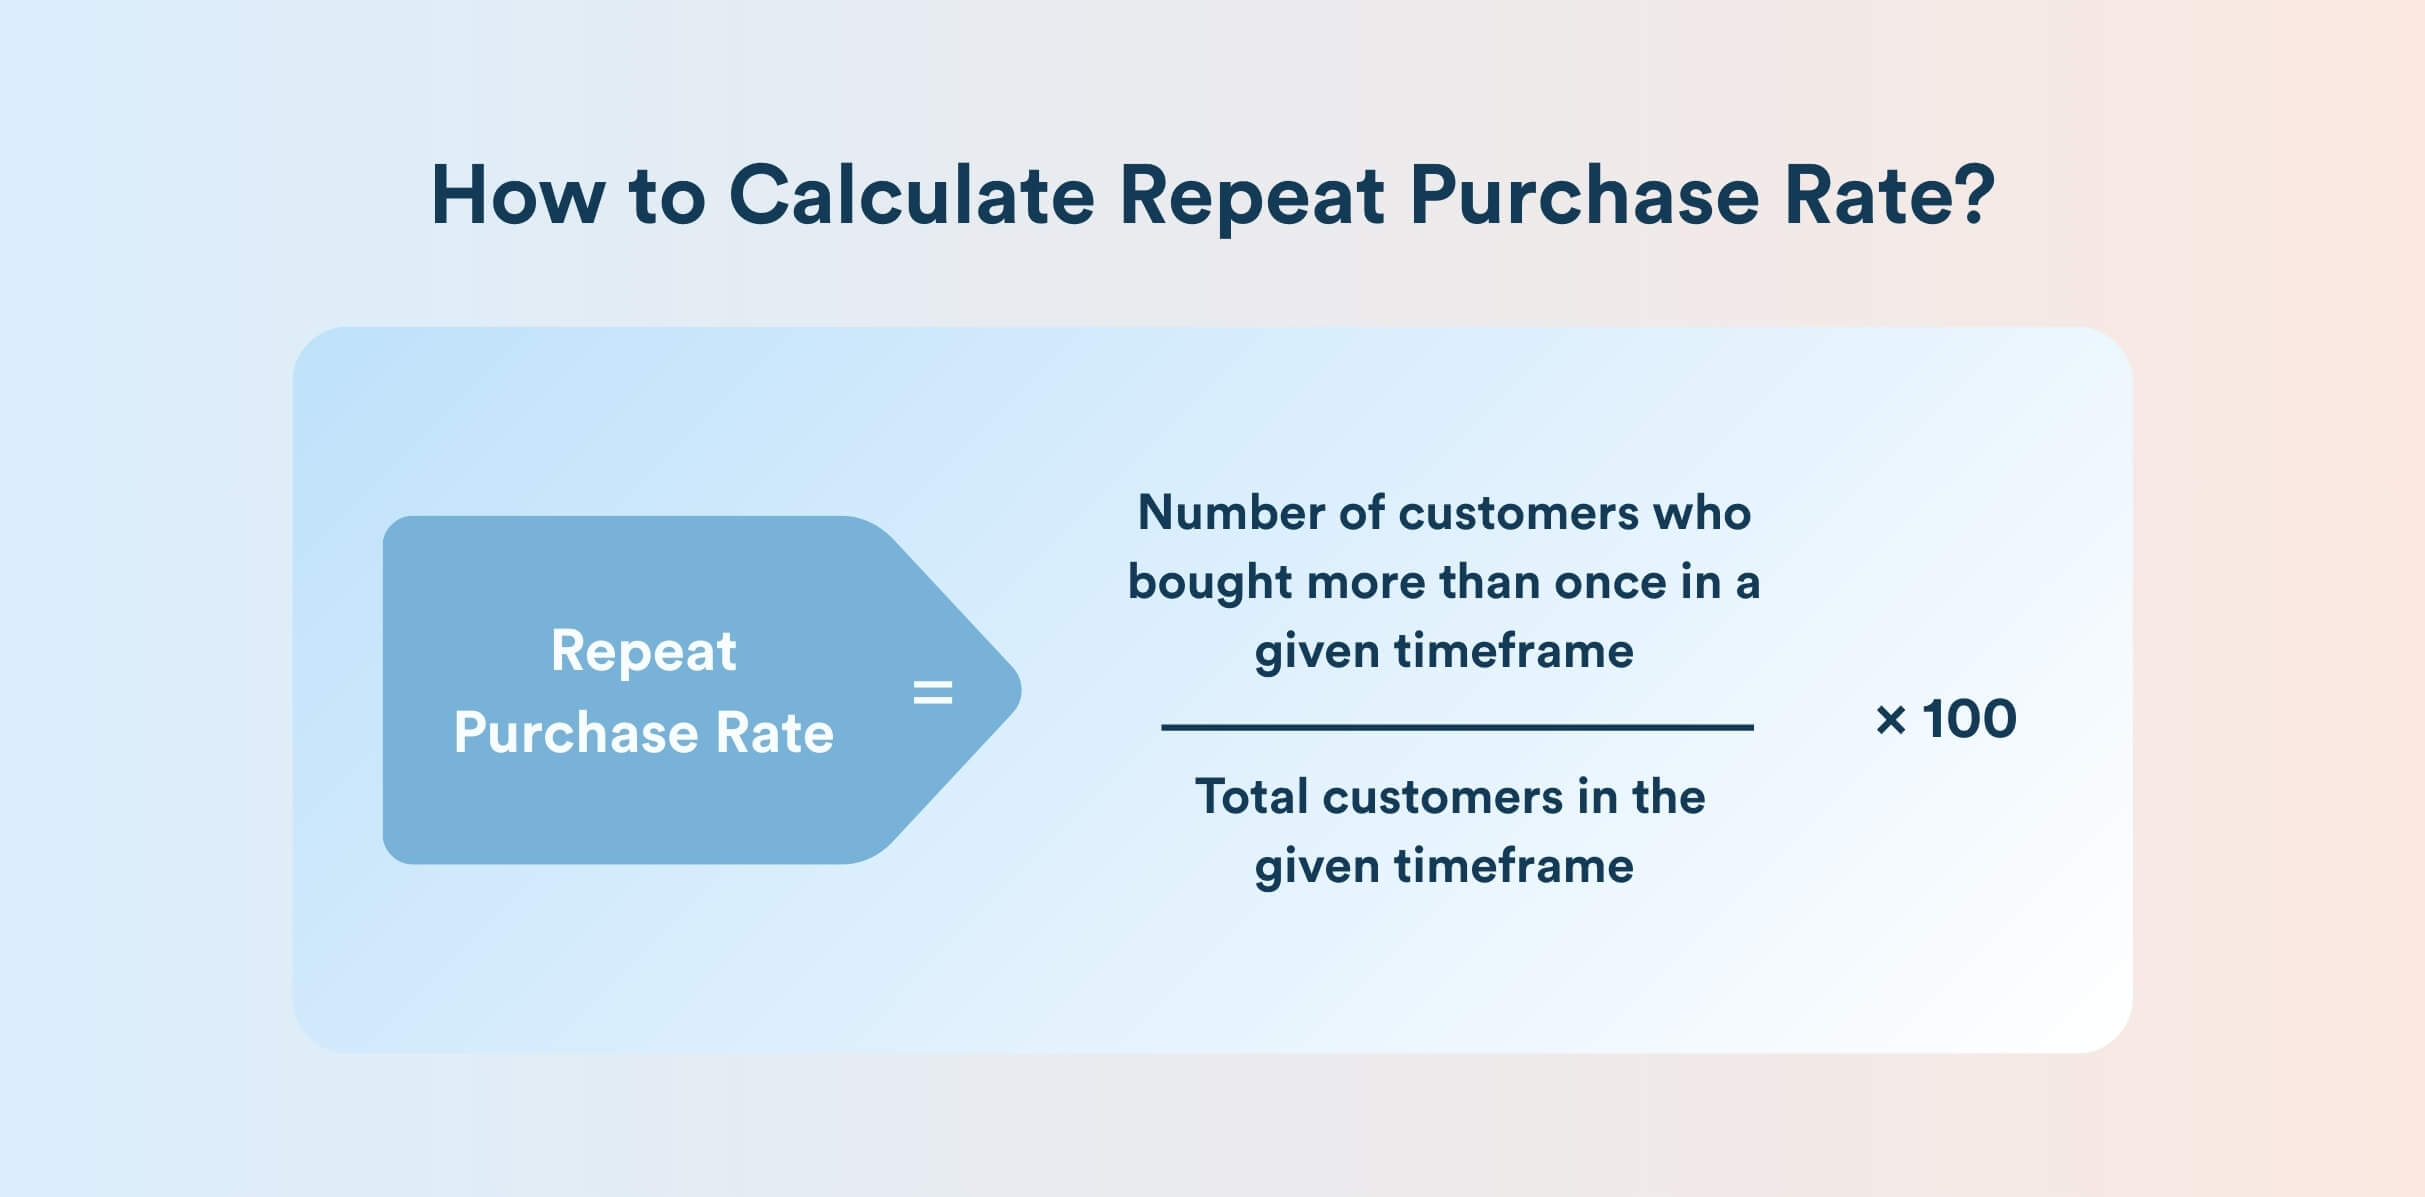
Repeat Purchase Rate = (Number of customers who bought more than once in a given timeframe ÷ Total customers in the given timeframe) × 100
The repeat purchase rate may not necessarily indicate loyalty, but building loyalty with a repeat customer is easier. When customers repeatedly purchase from your brand and have a good experience with it, they start building the behavioral connection that drives them back to your brand for more purchases.
4. Upsell or Cross-sell Ratio
The upsell or cross-sell ratio shows the extent to which customers buy more products or services across your platform.
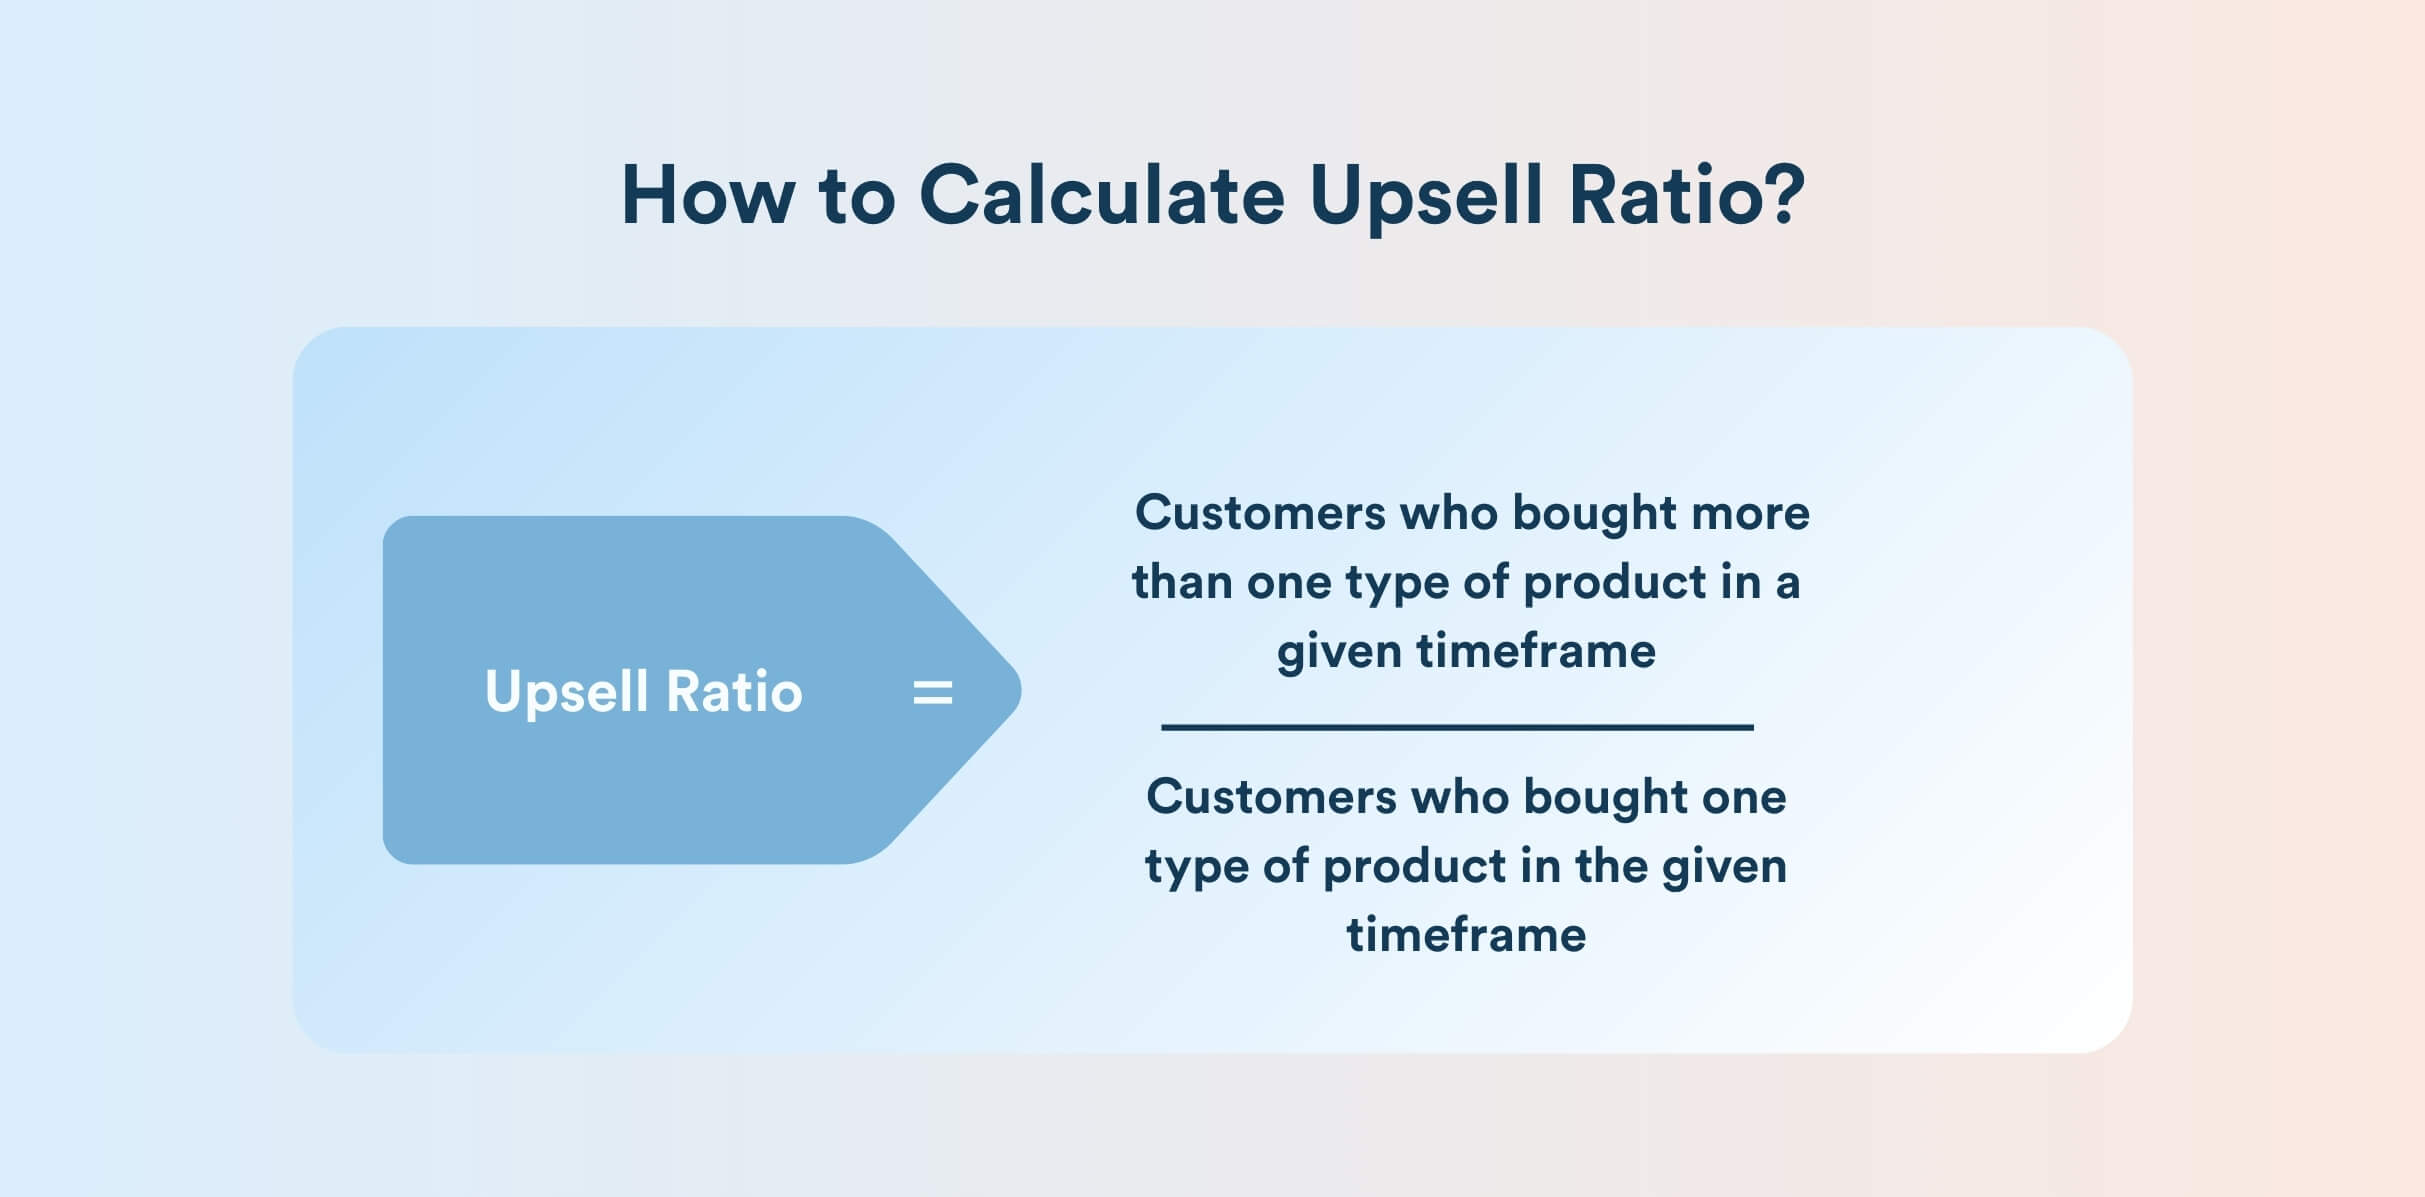
Upsell Ratio = Customers who bought more than one type of product in a given timeframe ÷ Customers who bought one type of product in the given timeframe
This metric shows how many existing customers are buying higher-tier offerings or new categories. A high upsell ratio means customers trust you enough to upgrade or try more, driving CLV higher. If it’s low, you need better cross-sell campaigns or more optimized customer engagement.
The success of upsell or cross-sell campaigns largely depends on your product or service fit, not just loyalty. If you see a low ratio, it’s also advisable to think along those lines.
5. Customer Lifetime Value (CLV)
Customer lifetime value (CLV) is the profit margin you can earn during your entire relationship with an average customer. It shows how much more your customers buy from you during your business relationship.
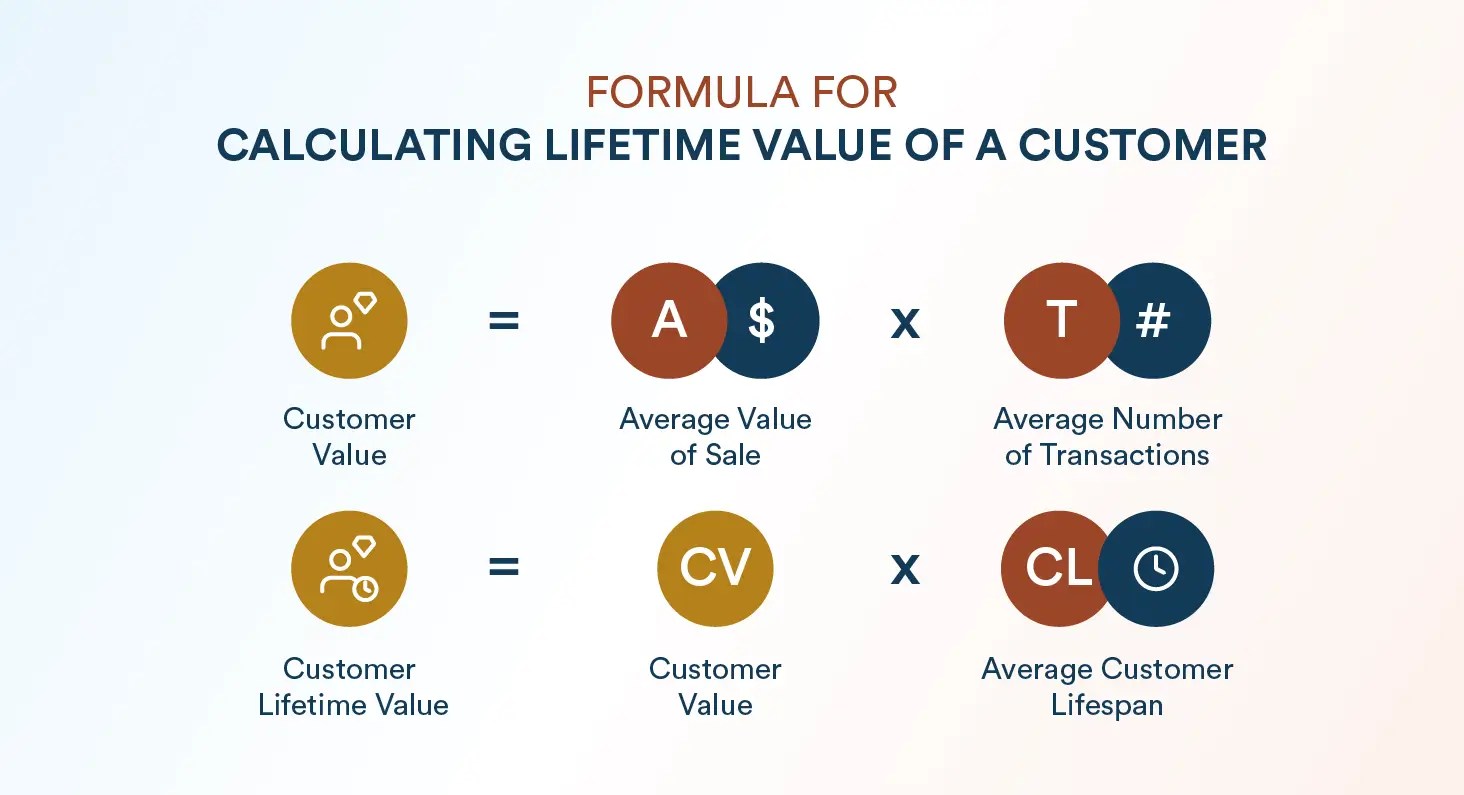
Often, customer loyalty and CLV go hand in hand. Loyal customers ultimately lead to a high CLV. Here’s how you calculate it:
CLV links loyalty to revenue. Loyal customers have higher CLV. Tracking CLV lets you see how loyalty tactics translate into dollars.
Calculate your brand’s CLV in 30 seconds using our CLV calculator.
6. Customer Loyalty Index (CLI)
Customer loyalty index helps you track customer loyalty over time. It involves a survey with three questions aimed at assessing NPS, repurchases, and upselling:
- How likely are you to recommend [company] to a friend?
- How likely are you to buy from [company] again?
- How likely are you to try [company]’s other products or services?
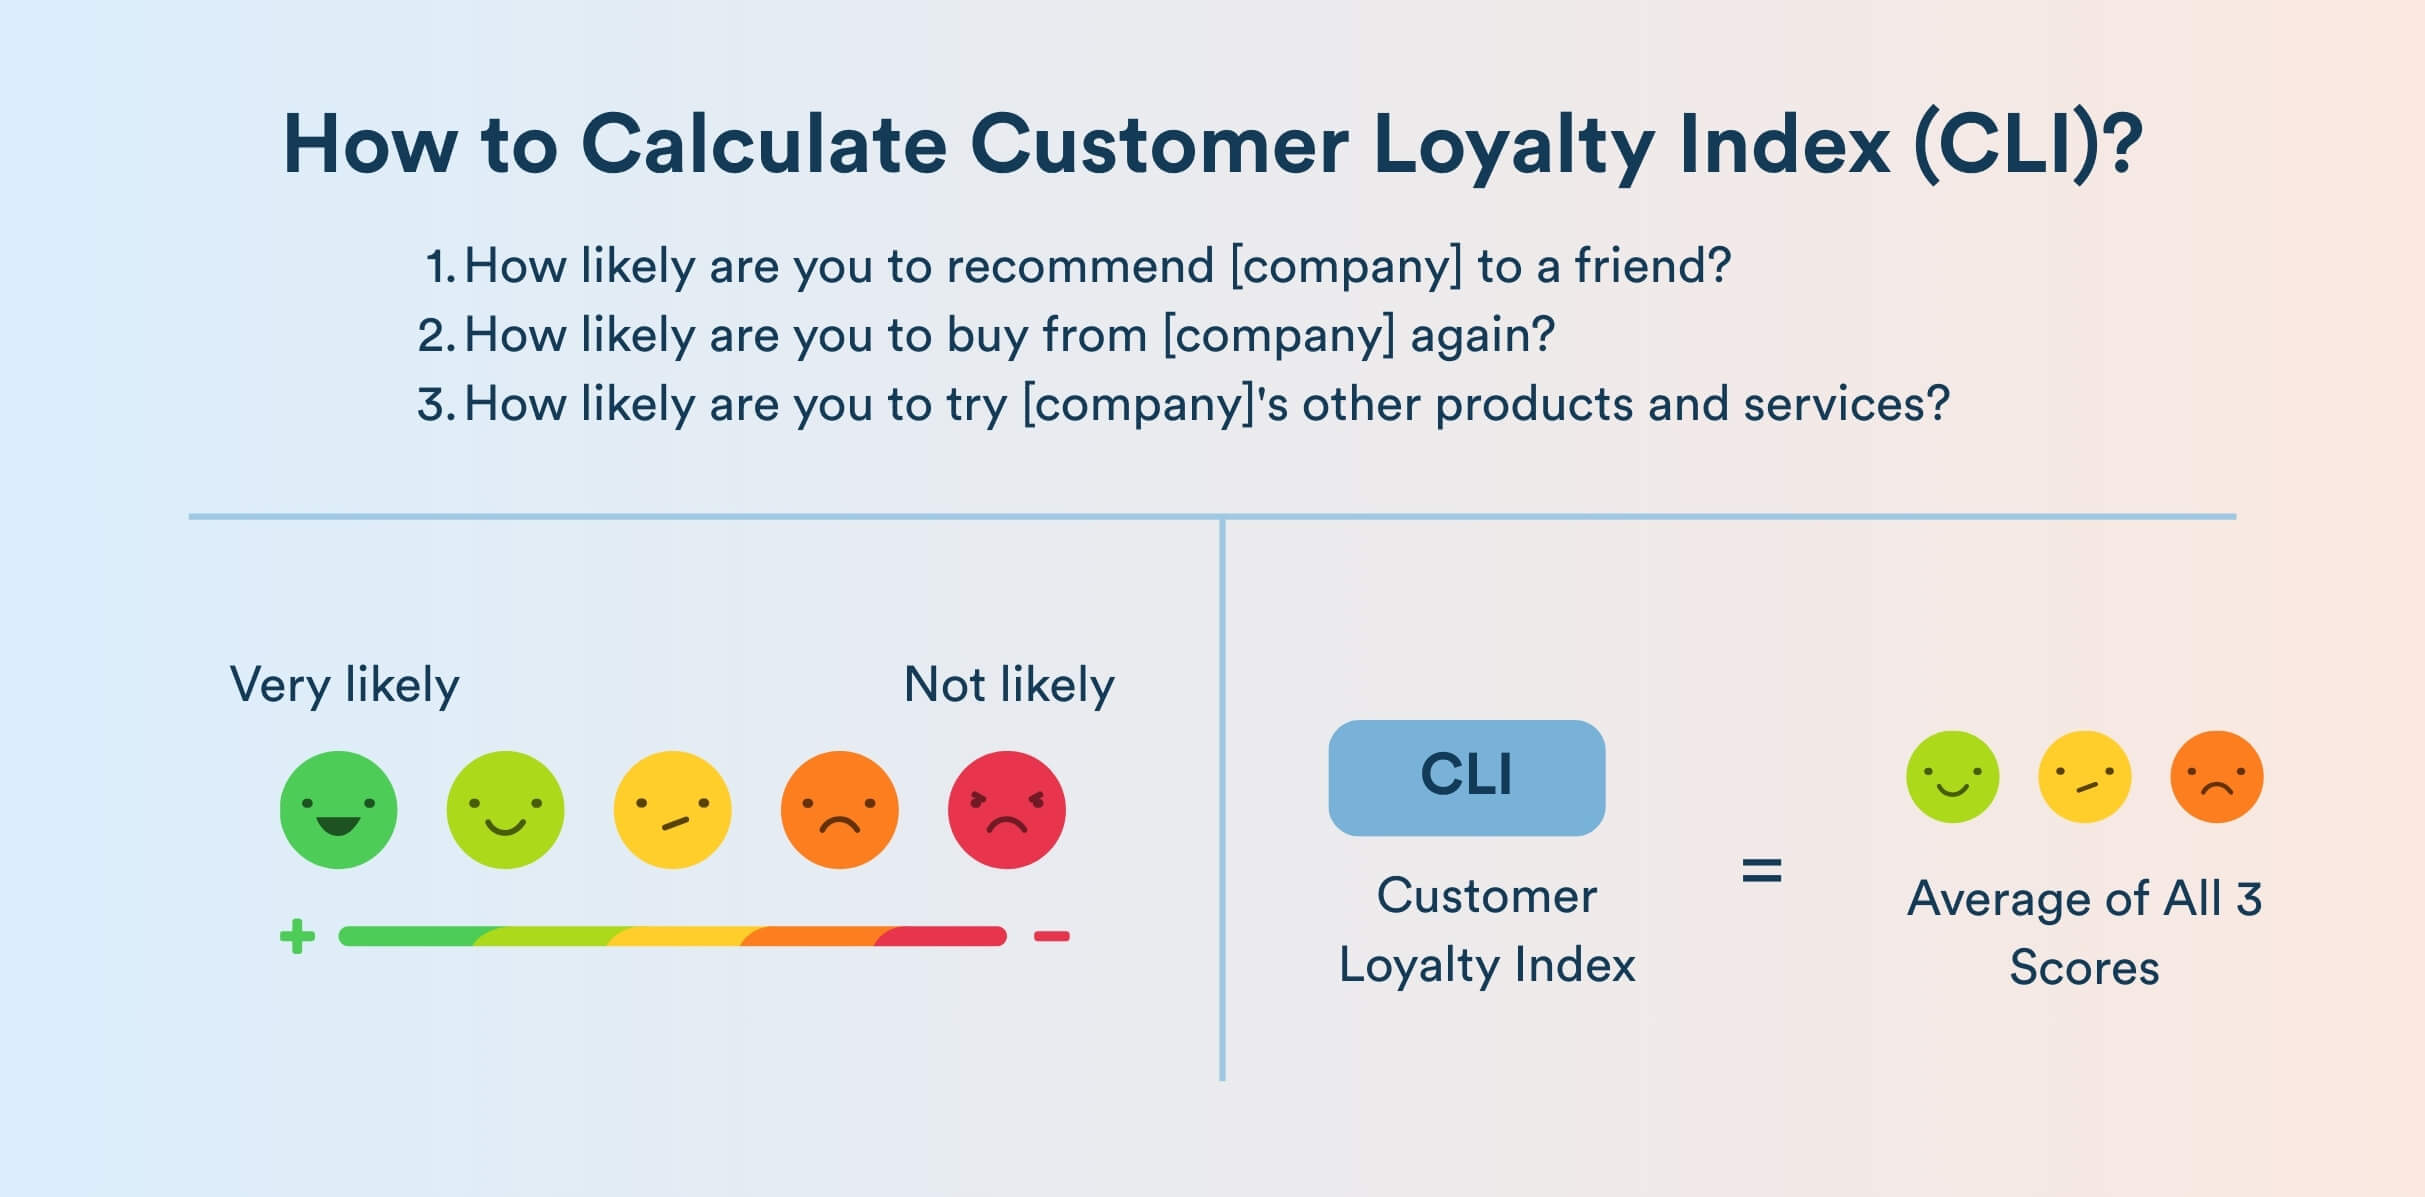
Customers answer on a scale of 1 through 6, where one means “very likely” and six means “not likely.” To calculate CLI, find the average of all three scores.
7. Customer Satisfaction (CSAT)
The CSAT score measures the immediate satisfaction with a recent experience. Ask customers to rate satisfaction (e.g., 1–5).
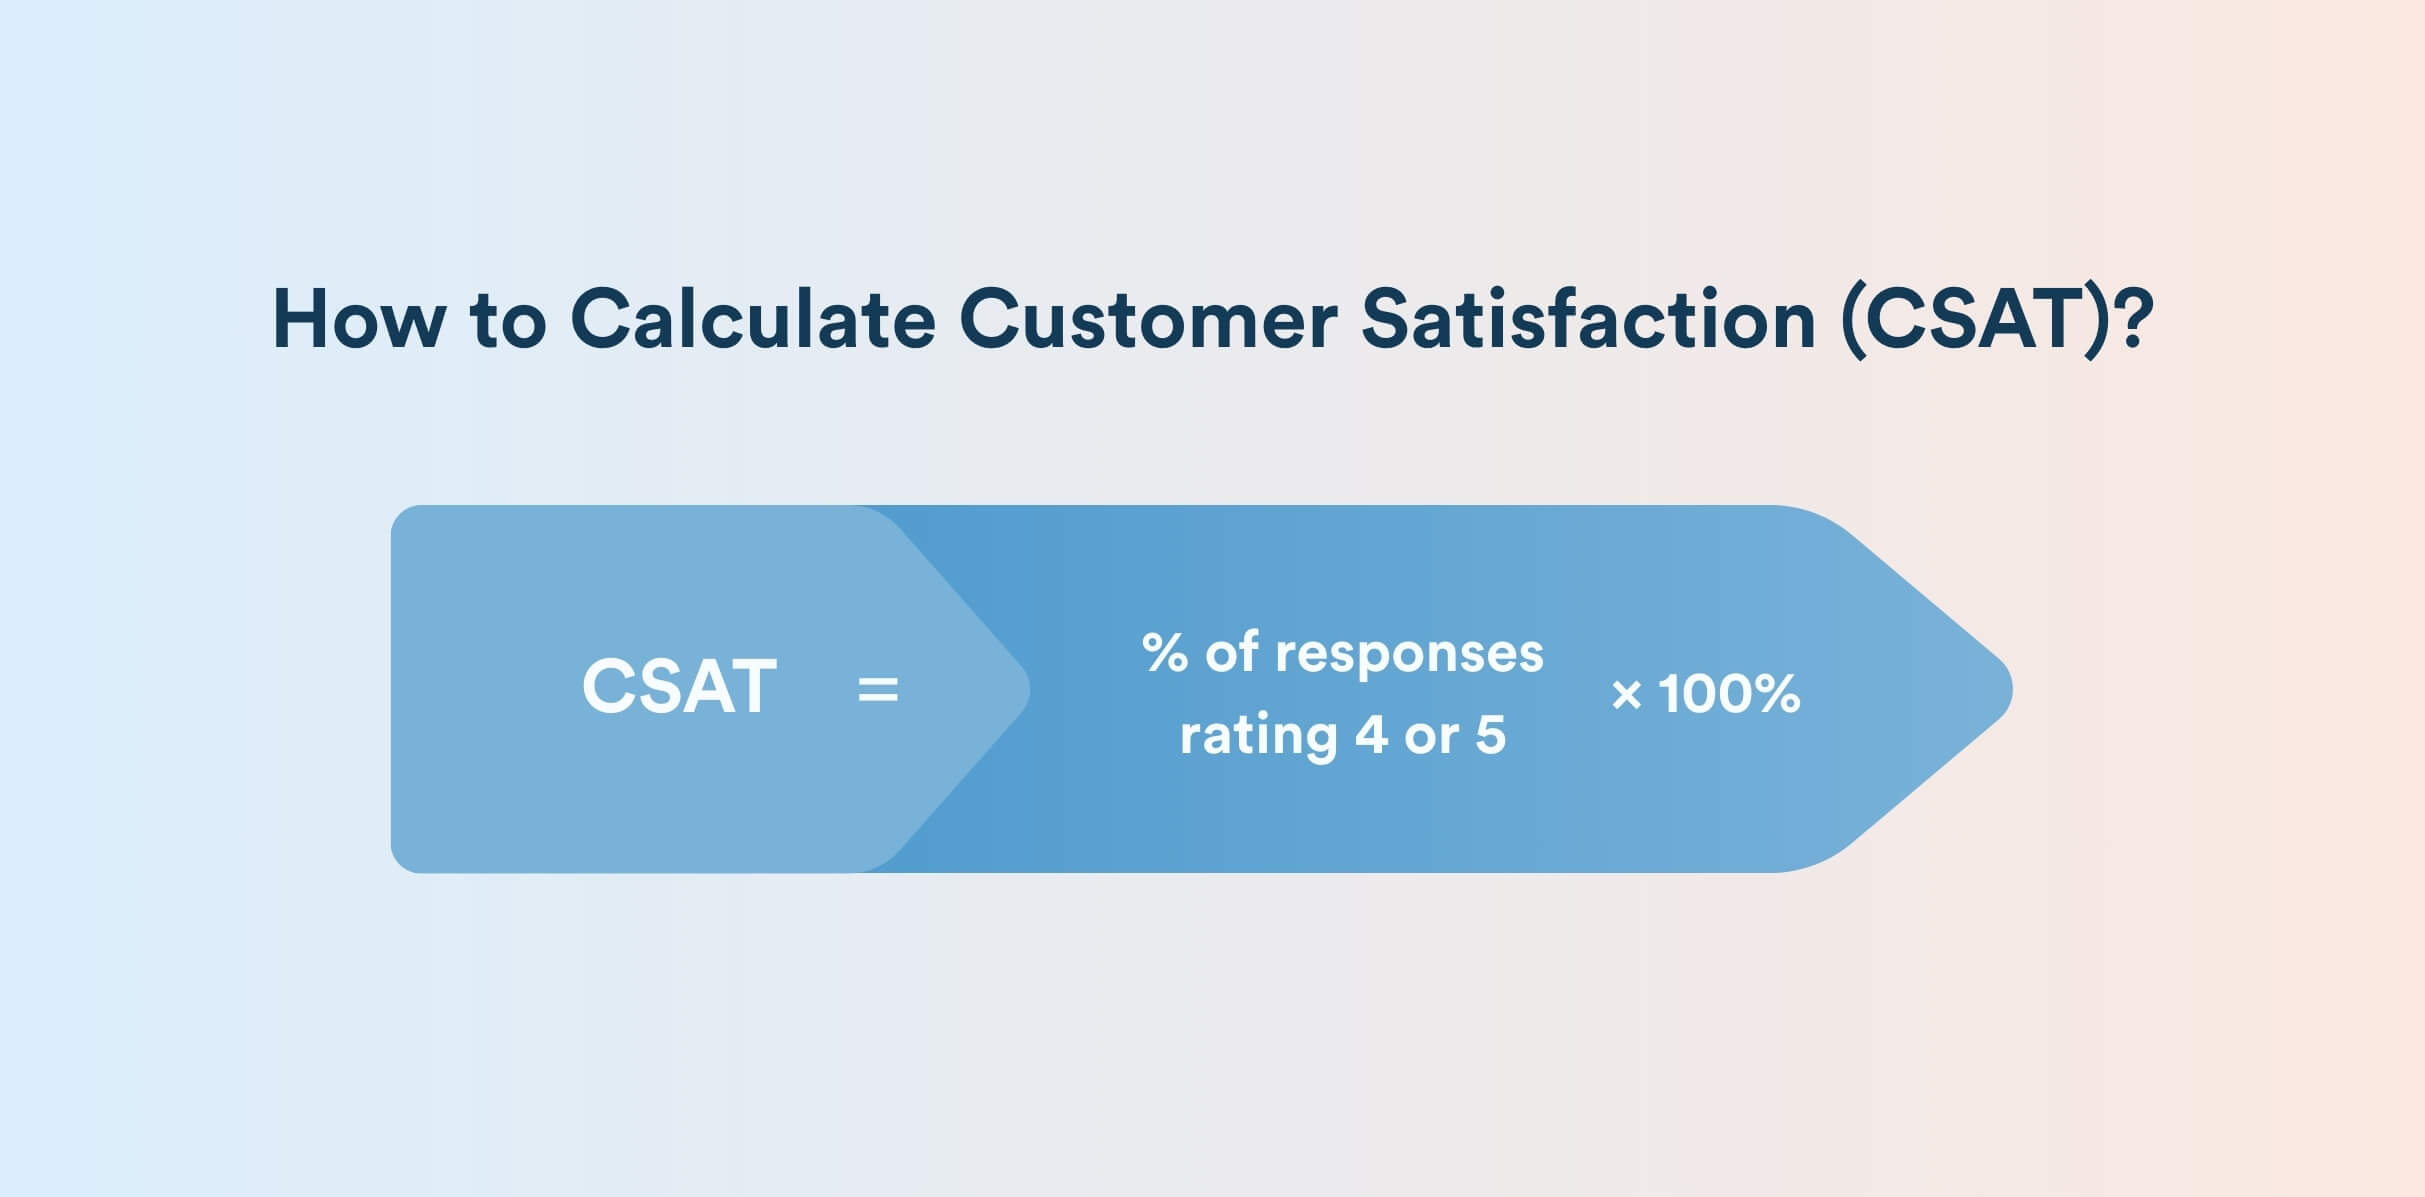
CSAT = (% of responses rating 4 or 5) × 100%
CSAT measures customers’ happiness after an interaction, purchase, support call, etc. High CSAT correlates with loyalty because satisfied customers are more likely to return. It’s tactical and more suitable for short-term feedback on products or services.
Low CSAT signals friction that leads to churn. Unlike NPS, CSAT is not forward-looking; it tells you about specific touchpoints.
8. Churn Rate
Churn rate is the rate at which customers leave or lapse.
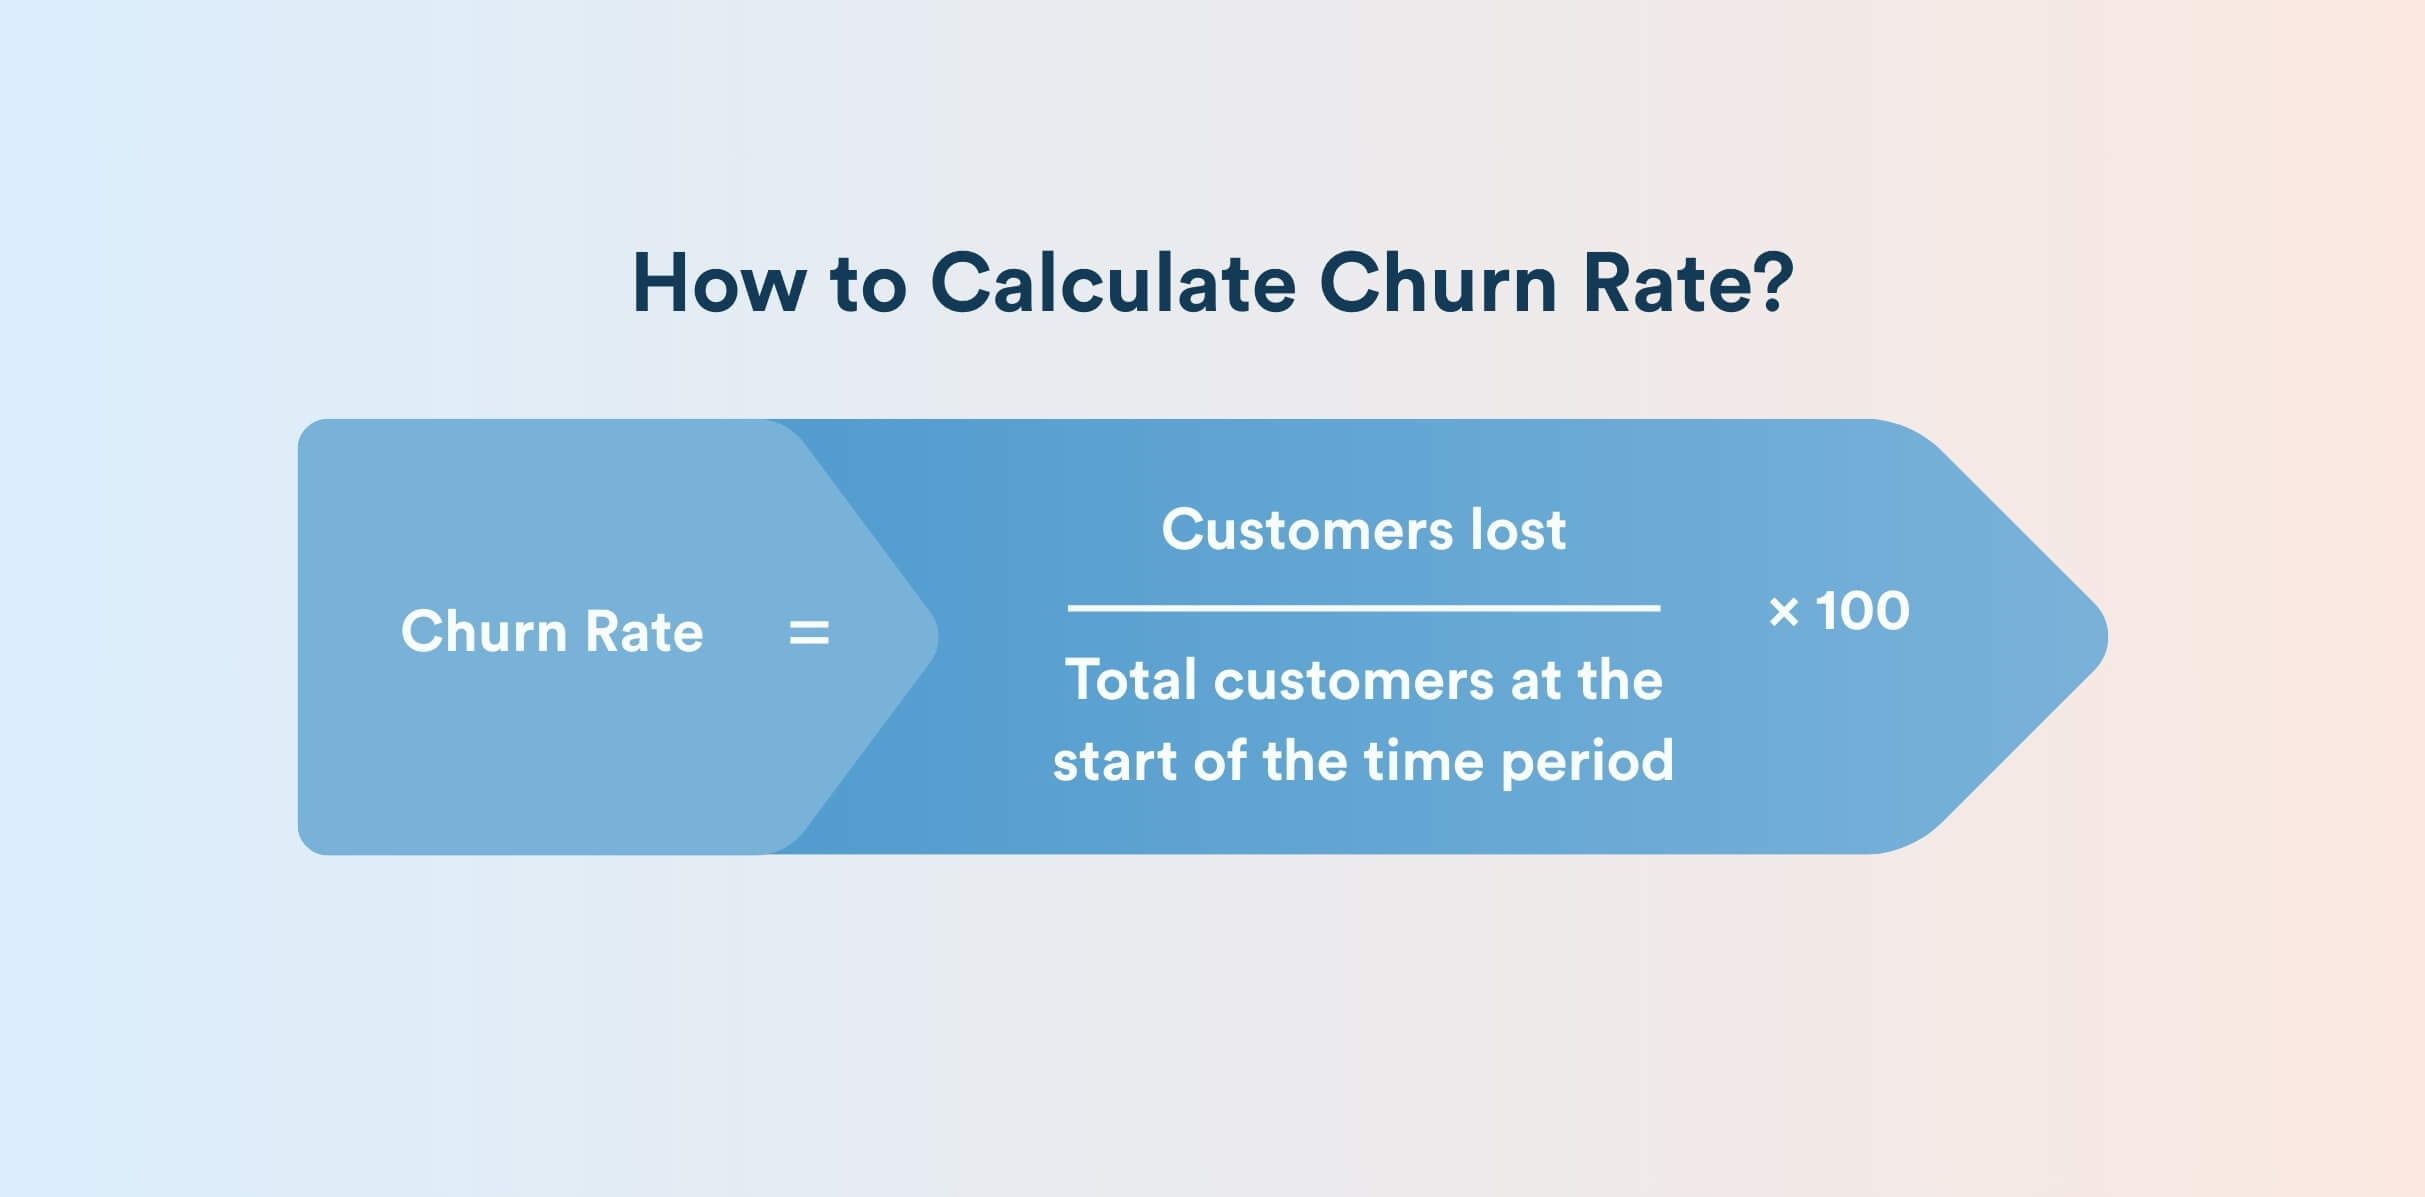
It’s the inverse of retention. It highlights problems in terms of price, experience, or value. For a subscription-based business, it’s a vital metric to track as loyal customers should ideally churn at a minimal rate.
Learn how to conduct a churn rate analysis.
9. Referral / Advocacy Rate
It is the rate at which you get new customers from referrals.
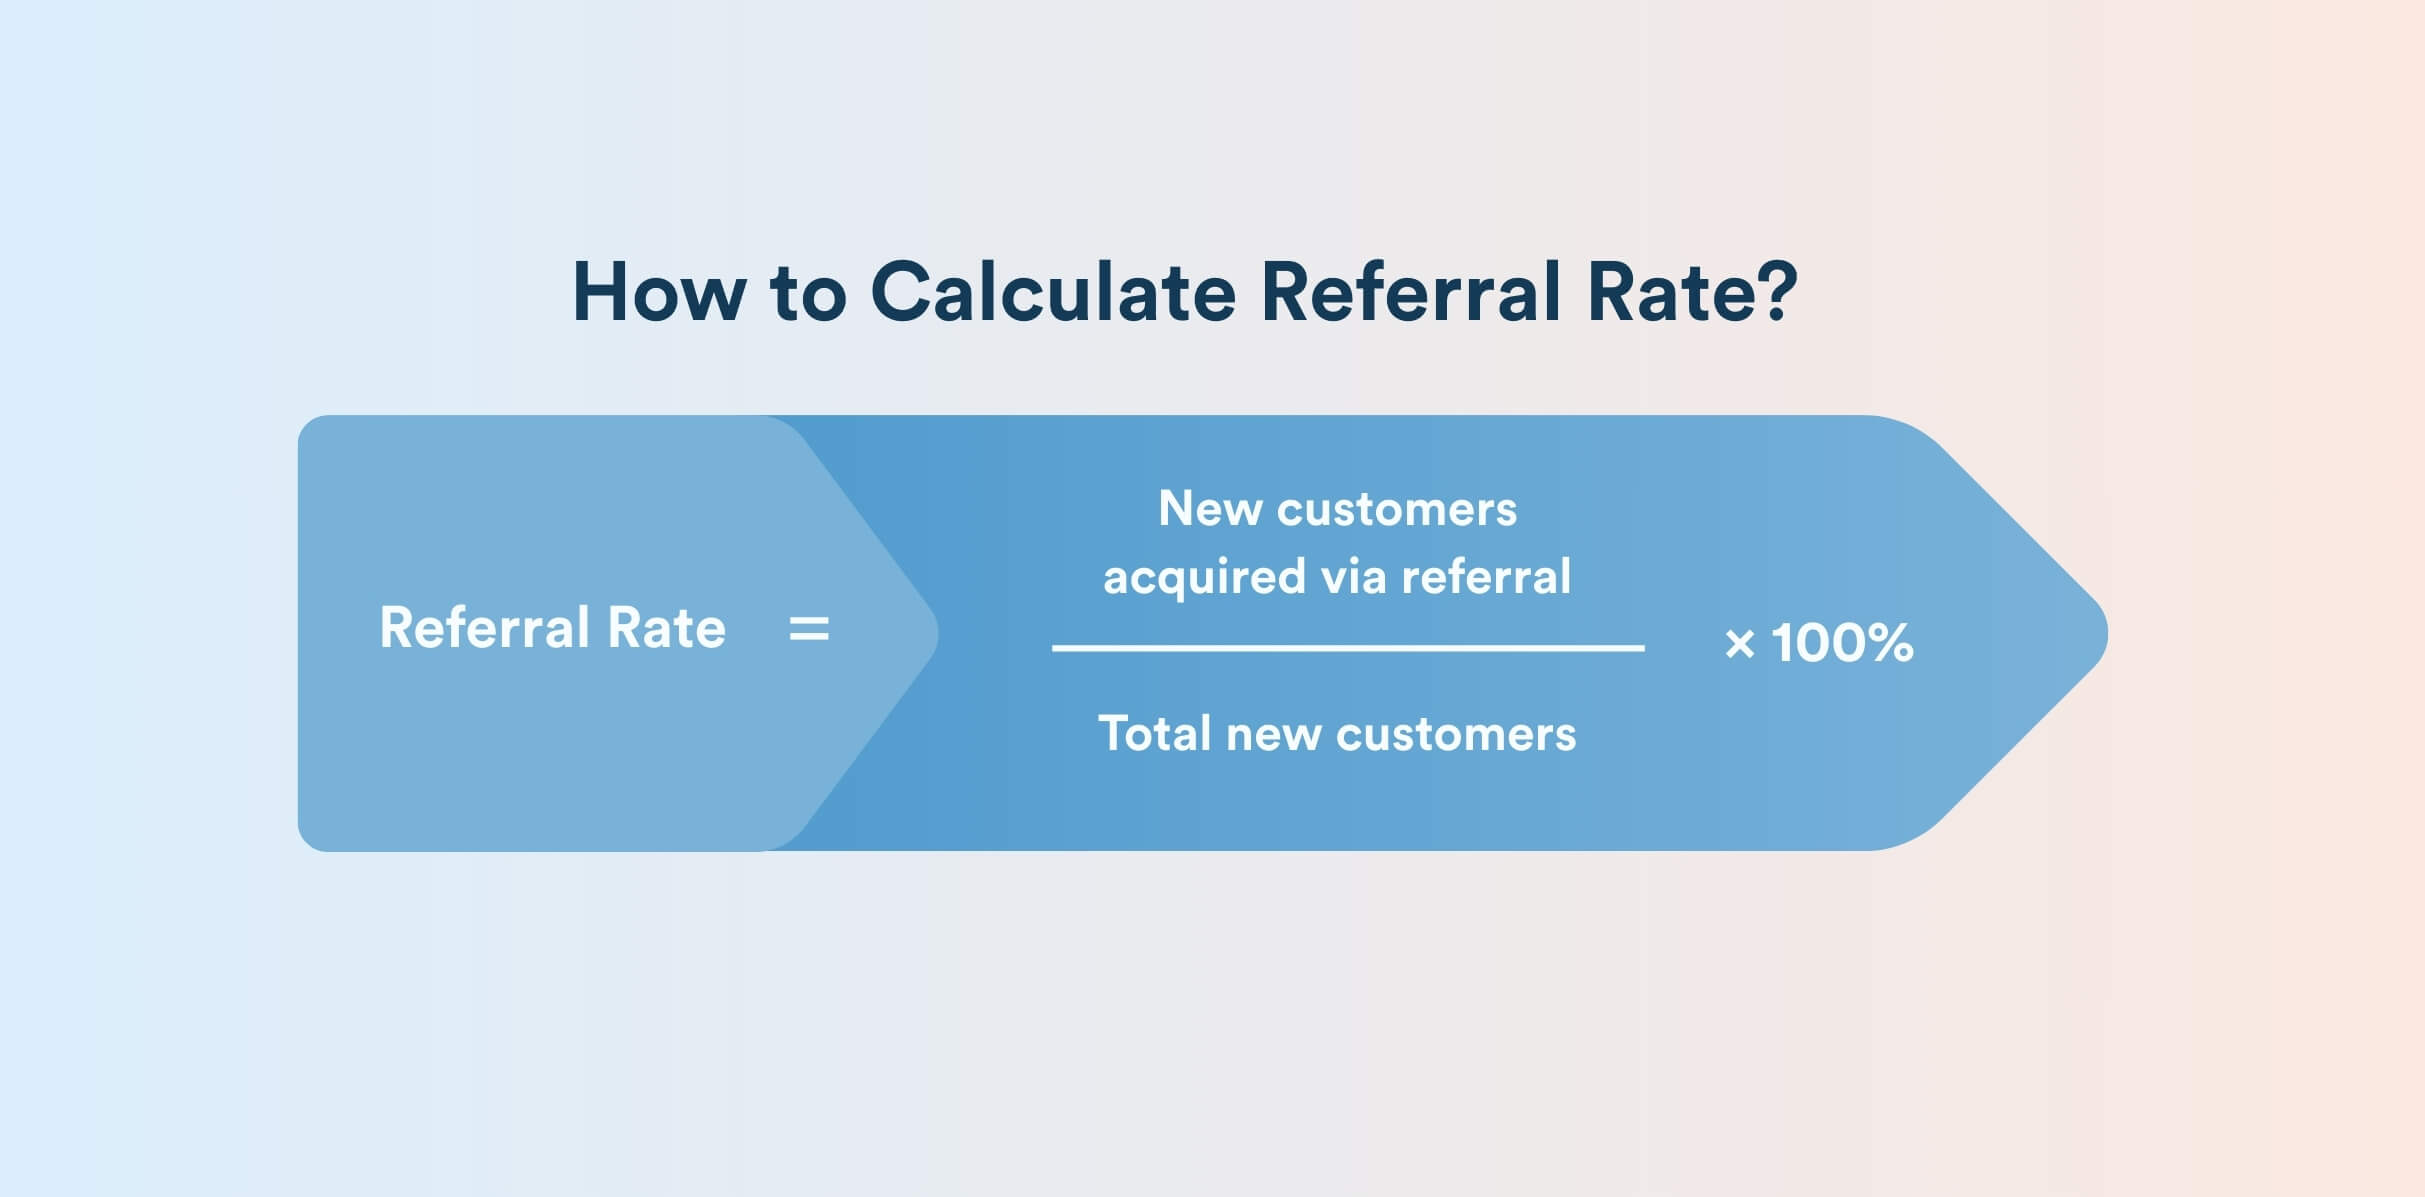
Referral Rate = (New customers acquired via referral ÷ Total new customers) × 100%
Referrals are the ultimate proof of loyalty. Customers are so happy that they bring friends. A higher referral rate means strong advocacy. For example, a referral rate of 20%, i.e., one in five new customers, that came from word-of-mouth, is excellent. If low, consider incentives or programs to encourage sharing.
6 Customer Loyalty Program Metrics: What to Track?
If you run a loyalty or rewards program, additional KPIs let you assess its health. Here are six loyalty-program-specific metrics and how to calculate them:
| Loyalty Program Metrics | Formula | Why It Matters |
| Program Enrollment (or Participation) Rate | Loyalty members ÷ Total customers × 100 | Shows the percentage of your customers who have joined the loyalty program. |
| Active Member Rate (Active Participation Rate) | (Customers who earn or redeem rewards ÷ Total customers) × 100 | Highlights the fraction of customers who are actively using the loyalty program. |
| Redemption Rate | (Total points or rewards redeemed ÷ Total points or rewards issued) × 100 | Confirm if the loyalty program is driving engagement. |
| Breakage Rate | (Expired points ÷ Issued points) × 100 | Suggests that the reward catalog or value is weak if the rate is high. |
| Tier Penetration / Progression | (Members in top tier ÷ Total members) × 100 | Depicts the distribution of members across loyalty tiers, or movement between tiers. |
| Program Revenue Percentage | (Revenue from loyalty program members ÷ Total revenue) × 100 | Shows the financial impact of your loyalty base. |
These program-focused metrics complement the general customer loyalty metrics above, highlighting whether the loyalty program drives engagement or simply accumulates members.
Get inspired from the best customer loyalty program examples to build your own.
How to Interpret Customer Loyalty Metrics
Loyalty rarely looks the same across all customers. Segment your data by key groups:
- Customer Tenure: Compare loyalty of new vs established customers. New cohorts have lower repeat rates early on. A high churn in the first month highlights onboarding issues, whereas long-term customers have much higher CLV.
- Customer Value: Break down by Recency, Frequency, Monetary (RFM) segments. Typically, “Champions” are high spenders and frequent buyers. They show much higher customer loyalty metrics. “At-risk” customers are infrequent segments with lower loyalty.
- Channel/Source: Evaluate loyalty by acquisition channel or channel of purchase, for example, web vs. mobile app vs. in-store. Some channels deliver stickier customers.
- Demographics/Geography: Different markets behave differently. In APAC, loyalty programs and mobile engagement are huge. For example, 92% of shoppers in Southeast Asia say loyalty programs influence their purchase decisions.
- Product/Category: In retail, some product lines inspire more loyalty. Break metrics out by category to find where cross-selling or retention is strongest.
Use cohort analysis to see how each segment’s customer loyalty metrics change over time. For instance, measure the 30-day and 90-day retention of customers acquired in each month. This reveals shifts in loyalty trends early on.
CleverTap empowers you to run this analysis and make strategic optimizations to increase retention. Let’s explore ways CleverTap helps measure and build loyalty.
How CleverTap Helps Track and Act on Loyalty
CleverTap offers a loyalty management platform that allows marketers to measure, segment, and optimize customer loyalty metrics in real time.
Unified customer analytics lets you calculate KPIs like retention, purchase frequency, CLV, etc., at a segment or individual level. With this insight, targeting key user segments with hyper-personalized messaging becomes easier for significantly higher conversion and retention.
Let’s hear from customers about how CleverTap helps them measure and build customer loyalty. After integrating CleverTap, Canifa, a Vietnamese retailer, saw a 20% increase in retention rate and a 7% increase in revenue per user. Here’s a quick feedback from their MarTech expert:
Similarly, Ooredoo Oman, a leading telecommunications provider in the Middle East, uses CleverTap’s automation and Journeys to drive loyalty behavior. The technology allows them to automate lifecycle campaigns, including onboarding flows, win-back campaigns, reward reminders, or tier upgrade prompts.
Here’s the impact Ooredoo observed with CleverTap:

Overall, CleverTap’s all-in-one engagement platform supports marketers with:
- Segmentation and RFM Analysis: Using behavioral data, cleverTap buckets users into segments via RFM (recency-frequency-monetary) models. You can then track metrics like retention and CLV per segment.
- Personalization and A/B Testing: The platform’s AI and experimentation tools help optimize messaging based on customer data. A/B testing rewards or incentives lets you see which approaches actually influence customer loyalty metrics.
- Engagement Scoring: CleverTap computes engagement or loyalty scores while weighting actions like app opens, purchases, and clicks. While not a standard industry metric, this composite score helps identify loyal users who can be prime advocates or upsell targets.
Get in touch with a CleverTap expert and get personalized tips on improving your customer loyalty metrics.
Let Your Brand Inspire Love
Reaching the adoration phase takes a lot of work. This is when customers return to purchase from you because of the emotional connection established throughout their experience with the brand.
Every little touchpoint matters, and how you treat customers in those touchpoints matters even more. CleverTap lets you make the most of these little events in a customer journey and make them feel supported. This creates a supportive and memorable customer experience, returning them whenever they can make purchases.
Kiran Pius 
Leads Product Launches, Adoption, & Evangelism.Expert in cross-channel marketing strategies & platforms.
Free Customer Engagement Guides
Join our newsletter for actionable tips and proven strategies to grow your business and engage your customers.
