


Table of Contents
Categories
Most Popular


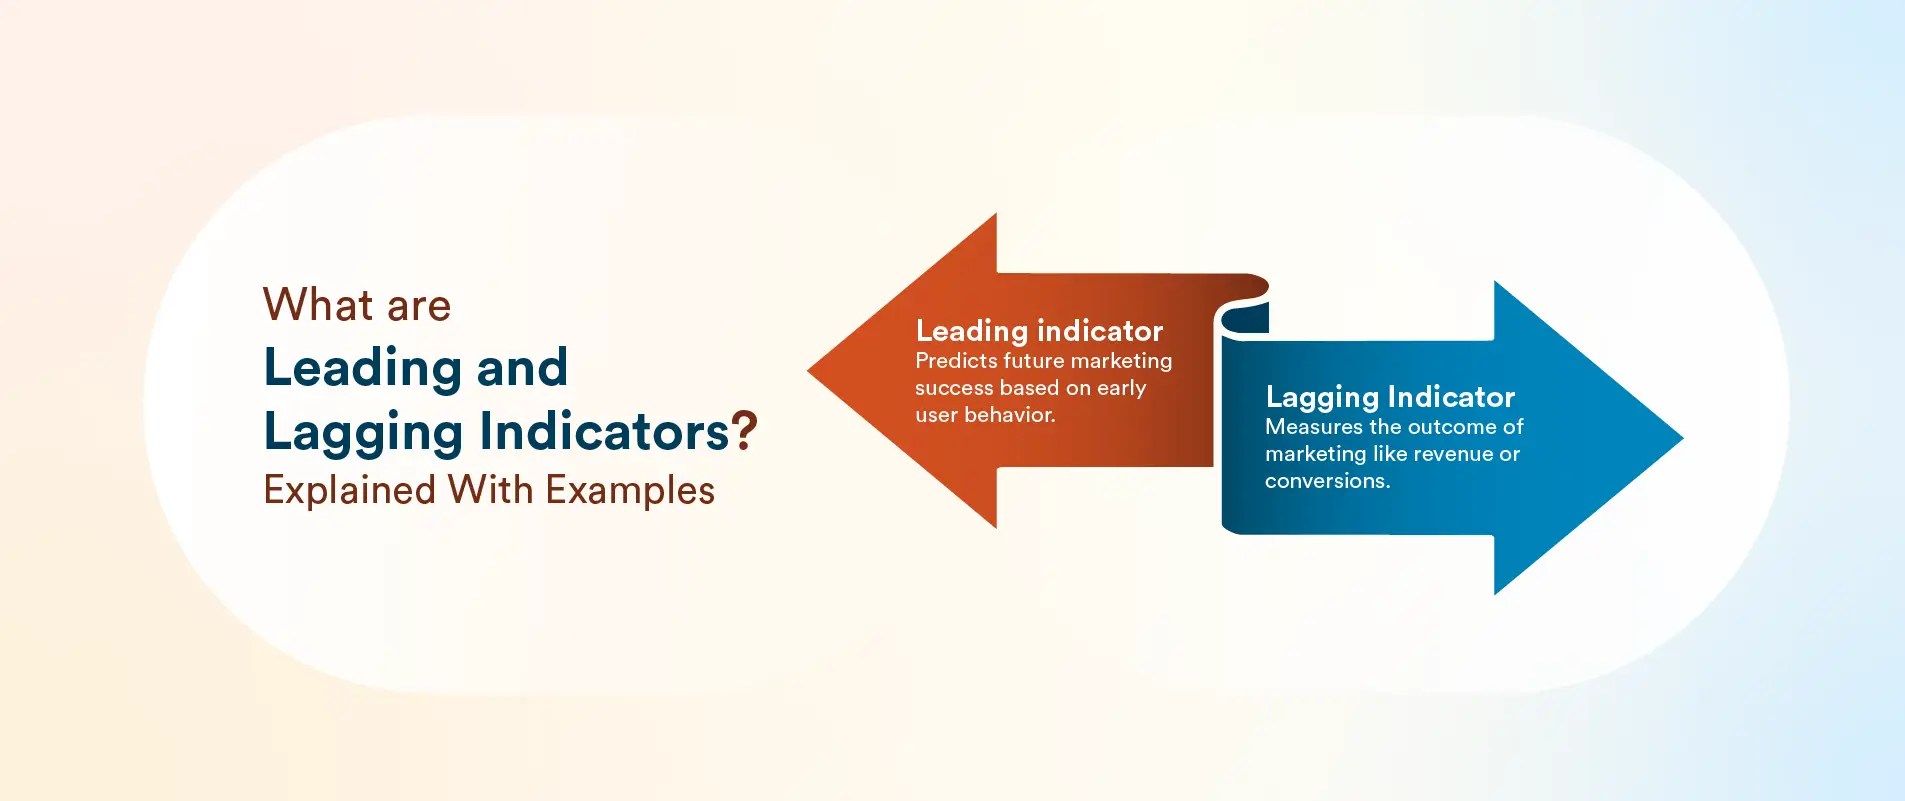
Leading indicators look forward and are predictive, signaling future performance. Lagging metrics reflect results after the fact, confirming the result. For a marketer, the leading indicators will be new demo requests. On the other hand, revenue or profit is a lagging indicator as it measures past outcomes.
If we’re to put it objectively, you find leading metrics to be more operational or behavioral, such as impressions, time-on-site, etc. Their lagging counterparts include the final result in sales volume or churn rate.
In this article, we’ll discuss leading vs. lagging metrics in detail and explore their examples in the real world. Before we proceed, let’s review their fundamentals quickly.
Leading vs. Lagging Indicators: What Are They?
Let’s compare the meanings of leading and lagging indicators to understand the difference theoretically first.
What are Leading Indicators?
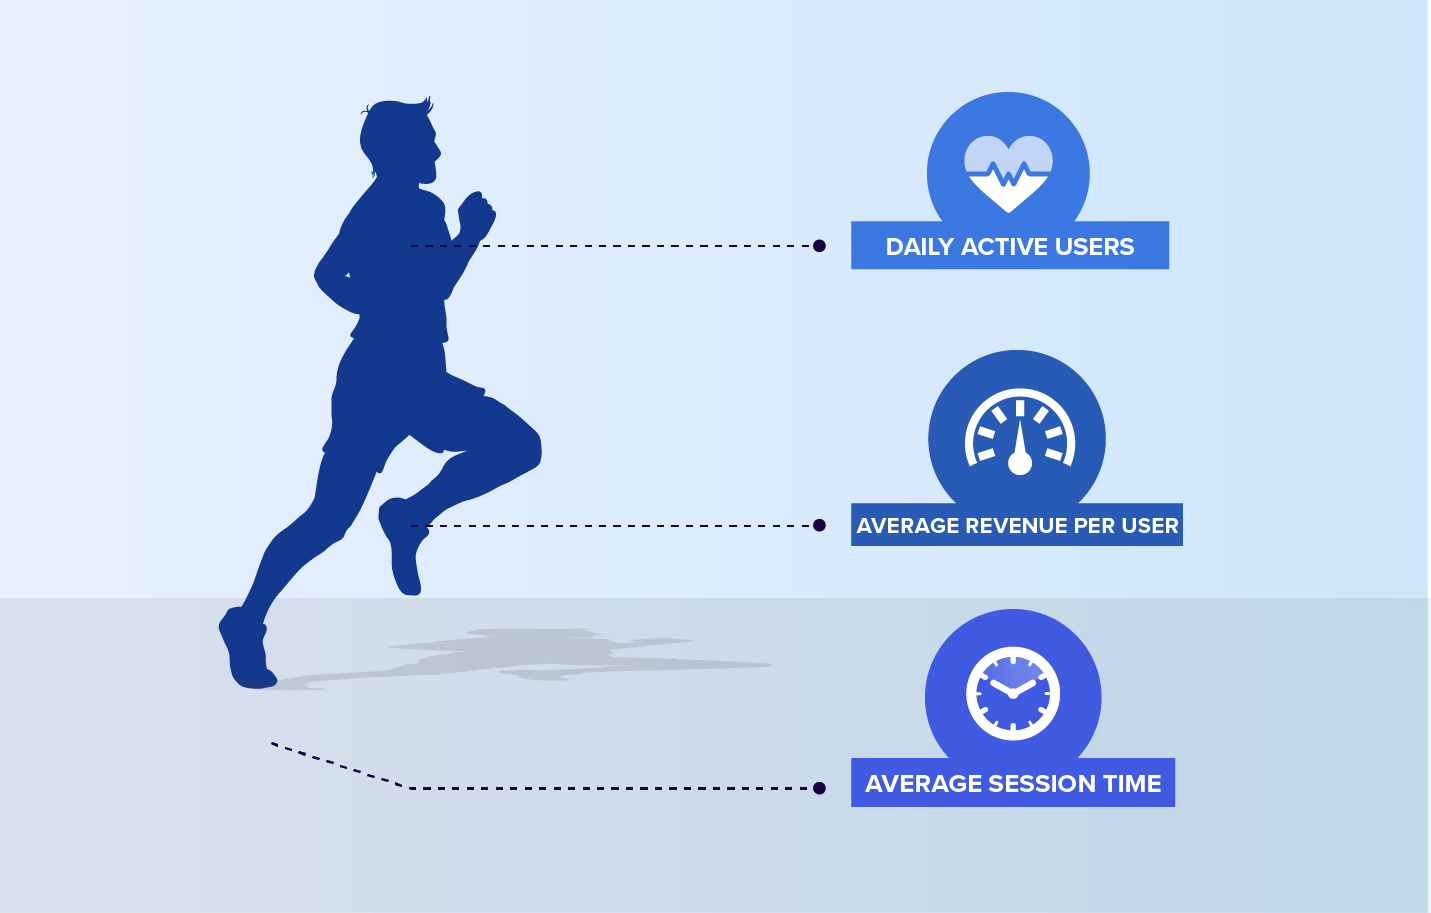
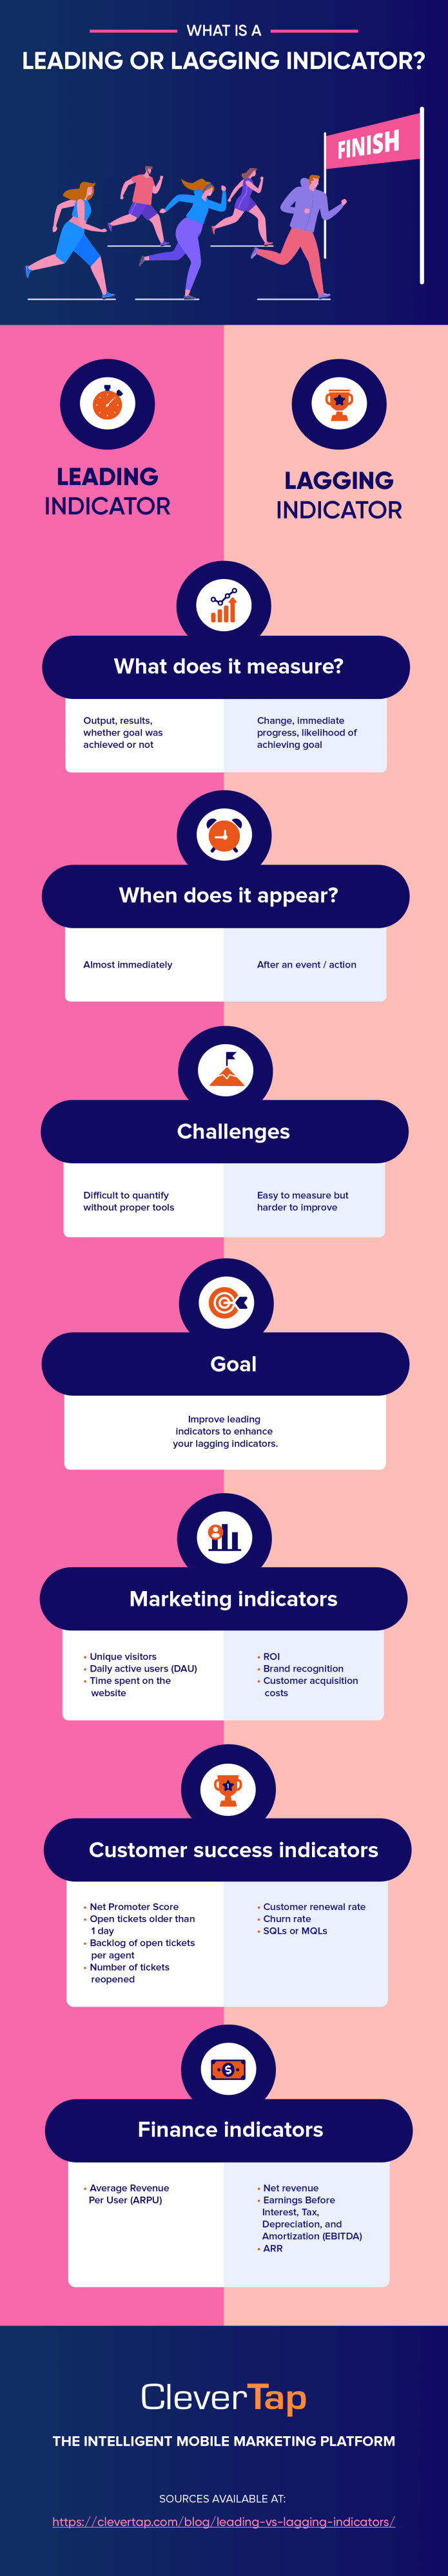
Leading indicators drive outcomes. Marketers use these KPIs to predict future results. Examples of leading indicators in marketing include social media engagement or daily active users. Improvements in these indicators often lead to better lagging results, but do not guarantee them.
Think of these like early warning signs.
Leading indicators give you clues about what may happen in the future. They’re like seeing dark clouds and knowing it might rain soon — they help you predict.
For example, if a company sees that more people are visiting its website or signing up for free trials, that’s a leading indicator that sales might increase soon.
Basic examples of leading indicators:
- Website traffic
- Free-trial signups
What are Lagging Indicators?
Lagging indicators confirm results. They are easy to measure but tricky to influence directly as they capture outcomes after actions have already been taken.
These are after-the-fact results.
They tell you what has already happened. Like looking outside and seeing puddles — that’s a sign it already rained.
For instance, if a company reports its revenue from last quarter, that’s a lagging indicator — it shows how well the company did, not what’s going to happen next.
Basic examples of lagging indicators:
McKinsey notes that relying too much on lagging outputs is risky. It might be too late to influence the consequences when the final results arrive. It’s best to track leading indicators to detect early signs that could result in positive or negative lagging outcomes.
- Businesses use leading indicators to plan and make decisions early.
- They use lagging indicators to measure past performance and see if their decisions worked.
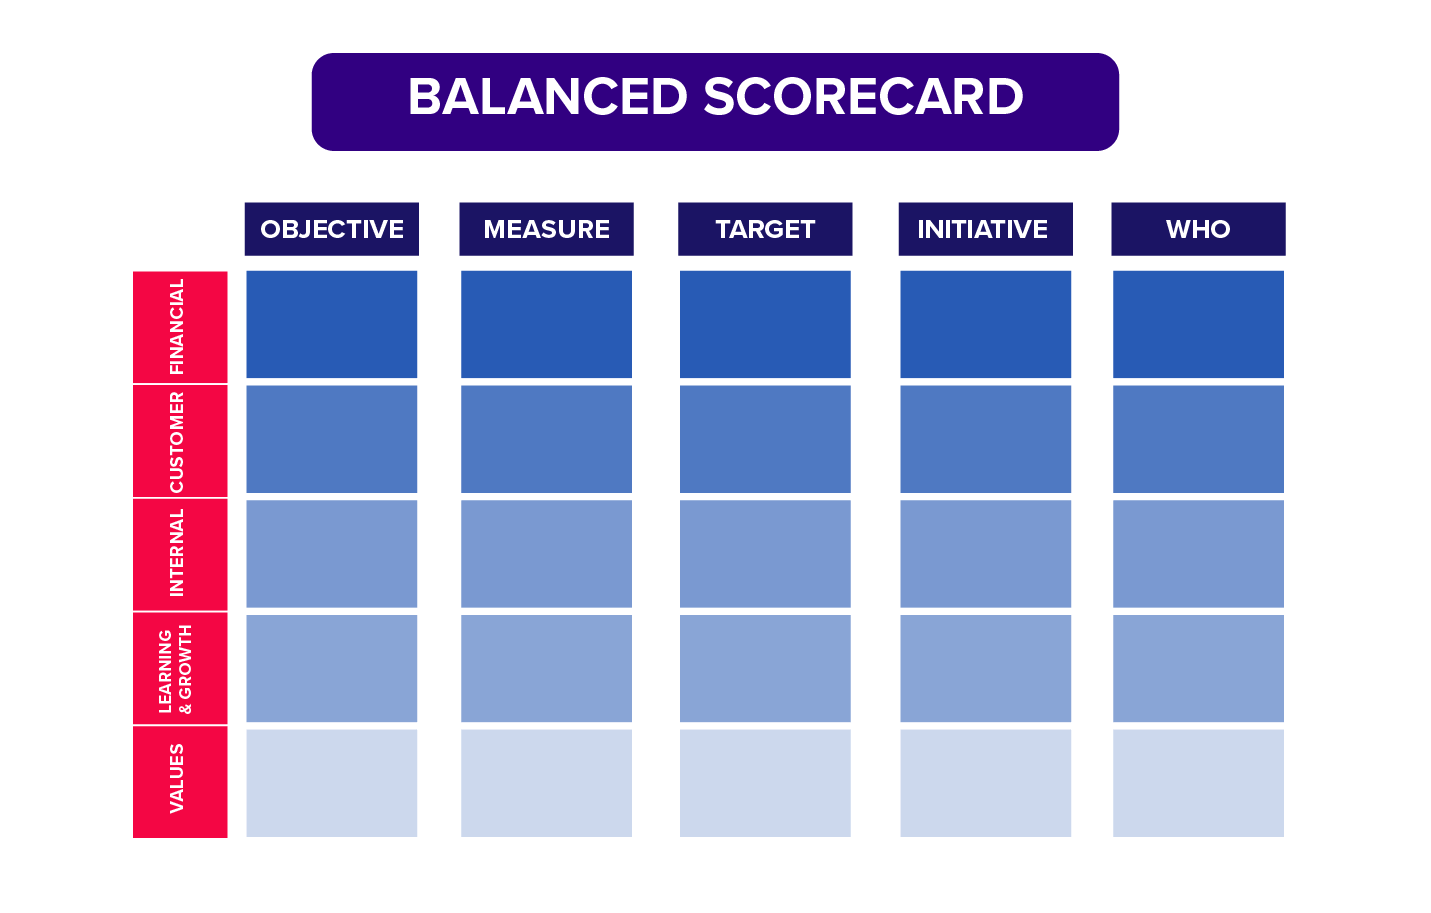
Here’s an example of how a balanced scorecard (BSC) framework allows managers to link leading process metrics to lagging goals from Investopedia.
| Perspective | Key Focus Areas | Representative Metrics |
| Financial or stewardship | – Financial health – Efficient resource use | – ROI (Return on Investment) – Growth in revenue – Cost-efficiency improvements – Profitability trends – Asset utilization rate – Cash management performance |
| Customer and stakeholder | – Customer loyalty – Market competitiveness | – Market penetration – Customer lifetime value – Net Promoter Score (NPS) – Customer satisfaction index – Repeat customer ratio – Rate of new client onboarding |
| Internal processes | – Efficiency and innovation – Process quality | – Speed to market for new products – Defect frequency – Timely order fulfillment – Operational cost savings – Six Sigma or equivalent quality benchmarks – Average process cycle time |
| Learning and growth | – Workforce capability – Tech readiness – Company culture | – Employee morale and satisfaction – Staff retention statistics – Investment in training initiatives – Digital system uptime – Innovation submissions by staff – Performance of product innovation pipeline |
The BSC framework above shows how objectives across different areas influence each other. For example, learning feeds into processes, which feed the customer, ultimately feeding into financial results.
Why Are Leading and Lagging Indicators Important?
Distinguishing lead vs. lag metrics is critical for agile marketing. Leading indicators allow marketers to take corrective action early, while lagging indicators confirm performance after implementation.
Lagging metrics, like quarterly revenue, ROAS, LTV, and CAC, are necessary to verify that goals were met. They hold teams accountable and reveal which strategies have worked best historically. However, lag metrics alone don’t explain why results occurred. They’re more of a starting point that helps you set realistic goals. From there, you reverse engineer to modify the process, acting behind the leading metrics.
This helps you effectively tie your team’s work to strategic outcomes, the lagging goals. When the team sees the influence, it feels motivated and aligned, keeping them proactive in their processes that drive results.
Examples of Leading and Lagging Indicators in Practice
Below are some examples of leading and lagging indicators in different types of businesses.
| Industry | Leading Metrics | Lagging Metrics |
| SaaS Marketing | – Website visits – Time-on-site – Social engagement – Webinar attendance – Lead volume | – Sales revenue – Customer lifetime value – Churn rate |
| E-commerce | – Visitors – Email sign-ups – Add-to-carts – Time between purchases – Pop-up shop visitors | – Orders placed – Repeat purchase rate – Average order value – Net Promoter Score |
| Mobile Apps | – Installs/downloads – App opens – Active sessions – Features usage – Daily active users – Time spent per user | – In-app purchase revenue – Subscription count – Churn rate |
How to Use Leading and Lagging Indicators Strategically
Effectively leveraging lead and lag metrics requires a systematic approach. Marketers should:
- Define Clear Objectives (Lagging Goals): Start with your end goal, a lagging KPI. Your performance target can be to “increase quarterly SaaS revenue by 10%” or “reach 50k MAU this quarter.”
- Identify Relevant Leading Drivers: Determine which upstream activities move the needle toward that goal. For example, if the lagging goal is higher revenue, the leading drivers might be the number of qualified leads or the trial conversion rate.
- Set Measurable Metrics and Targets: For each chosen indicator, set SMART targets. McKinsey advises keeping metrics limited (3–8 per level) and actionable. Ensure each metric has an owner.
- Monitor Continuously and Correlate: Use dashboards or analytics platforms to watch lead metrics in real time. Plot leading and lagging KPIs together to spot correlations. Cross-analyze whenever required.
- Act and Iterate: When a leading metric moves away from the target, adjust tactics immediately. For example, if funnel drop-off spikes, run an A/B test on your landing page. The right technology is indispensable to identify such events. CleverTap offers funnel analytics and real-time user insights to help marketers detect performance gaps early and take timely action.
- Review and Learn: After a campaign or period ends, evaluate outcomes. Use lagging metrics to assess if objectives were met, and analyze which leading indicators were on or off track. Use those insights to refine metric choice and targets for the next cycle.
Best Practices for Choosing and Tracking Leading and Lagging Indicators
Save this in your bookmarks to revisit when you select the lead vs. lag KPIs for your brand.
Dos: Follow These Best Practices
The key recommendations are:
- Align Metrics to Objectives: Tie every indicator to a specific goal. Use the lagging objective to guide your choice of leads. For example, if the aim is to grow retention, your leading metric might be “weekly active users” or “feature adoption rate.” McKinsey recommends choosing metrics that are specific, measurable, actionable, relevant, and timely (SMART).
- Maintain Balance (Lead and Lag): Always include both types. A dashboard should span from top-of-funnel impressions or sign-ups to the bottom line, highlighted by revenue or profit. Track them together so you can see the whole funnel. Use a Balanced Scorecard or strategy map to enforce this balance.
- Limit the Number of KPIs: Too many metrics dilute accountability. The metrics chosen should be “the few critical ones that drive performance,” not every possible vanity metric.
- Ensure Data Quality and Accessibility: Choose metrics with reliable data sources. If measuring something is impossible or expensive, find a proxy or skip it. The process of metric selection should also factor in data availability and cost.
- Review and Update Regularly: Metrics should evolve as strategy and market conditions change. To ensure coherence, involve cross-functional teams when setting and revising KPIs.
Don’ts: Pitfalls to Avoid
It’s best to keep these pointers in mind when selecting leading and lagging indicators or measuring them.
- Don’t Rely Solely on Lagging Metrics: If you only report end results like sales or profit without early indicators, you’ll always be reacting. This creates a “reactive culture” where problems are discovered too late.
- Don’t Use Vanity Metrics: Metrics like total page views or “likes” can be misleading if they aren’t tied to deeper outcomes like conversions or engagement. If they don’t move the bottom line or lead to something that does, they’re not worth focusing on. For example, tracking just ad impressions without correlating them to conversions gives a false sense of progress.
- Don’t Set Unattainable Targets: Overly ambitious benchmarks demotivate teams. Targets should stretch the team but be within reach with effort. Cultural context matters. Some regions (e.g., parts of APAC) may view missing targets as deeply disappointing, leading managers to set them at a lower level. Setting a lower target than what’s been achieved may not be acceptable in the US. Find a balanced approach.
- Don’t Change Metrics Impulsively: Frequent shifts in what you measure can confuse teams. Once you choose a leading indicator, give it enough time to trend before concluding. Of course, if a chosen lead proves irrelevant, replace it. But generally, metrics should be stable for a quarter or two, so you can spot actual trends.
- Don’t ignore the Story Behind the Numbers: Even perfectly chosen KPIs can mislead without context. Always accompany metrics with insights. For example, why did the conversion drop? Consider qualitative feedback. The data should guide inquiry, not be the final answer.
How CleverTap Helps In Tracking Leading vs. Lagging Indicators In App Marketing
CleverTap empowers app marketers with a customer engagement platform to capture both types of indicators. Its analytics platform ingests real-time user data and offers built-in reports and dashboards.
You get cohort charts and funnel analytics to visualize indicators that really matter. For example, a retention cohort chart would show how often new users return and funnels to visualize step-by-step drop-offs. This makes capturing early signals easy and relating them to later results.
The platform also offers flow analysis and Recency, Frequency, and Monetary value (RFM) analysis that help answer key questions like “Which user actions lead to churn or loyalty?” The flow analytics highlight the screens or features that lead to eventual churn. Moreover, RFM analysis allows marketers to identify high-value users early and target at-risk ones before they uninstall the application, making targeting more prioritized.
CleverTap tracks engagement KPIs (like daily sessions and in-app events) and ties them to business KPIs within the same platform. This allows you to optimize leading metrics on the fly and validate their impact on lagging results.
Predict future behavior and optimize outcomes with CleverTap analytics
Use Lagging and Leading KPIs intelligently
When you balance these metrics, you deliver data-driven marketing success. CleverTap offers the technological support you need to be vigilant about the strategies and tactics at play.
The platform lets you measure engagement metrics and tie them to business outcomes. It helps the team visualize the complete journey toward conversion while delivering targeted messaging at the right time.
Explore CleverTap in detail and discover insights waiting in your data. Book a demo today!
Mrinal Parekh 
Leads Product Marketing & Analyst Relations.Expert in cross-channel marketing strategies & platforms.
Free Customer Engagement Guides
Join our newsletter for actionable tips and proven strategies to grow your business and engage your customers.
