


Table of Contents
Categories
Most Popular


It’s certainly an exciting time for the mobile gaming industry. Popular (albeit divisive) revenue models like GaaS continue to open doors for developers to further monetize in-game purchases, and the ongoing rollout of 5G means gamers can enjoy low latency rates and faster speeds.
But progress is a double-edged sword. On the one hand, the evolution of the industry has resulted in better games, dedicated (paying) gaming communities, and mobile gaming trends that spectators and insiders can get behind. On the other hand, the marketplace is saturated. Marketers can no longer second-guess their strategies. By investing in game analytics tools, you can improve retention, engagement, and monetization.
To help you with your mobile gaming strategy in 2021, we’ve rounded up 21 mobile game analytics tools, metrics, and resources that we believe are worth your time and money. In this post, we outline mobile app metrics to track, tools to make tracking easier, and useful resources for game marketers and developers.
5 Mobile Analytics Tools To Make Tracking Easier
Who doesn’t want to save time? Not to mention maximize opportunities to lower acquisition costs, improve user engagement, and, ultimately, drive more purchases? We’ve listed five analytics tools that we believe make tracking easier and offer a wide range of plans and options for all strategies.
Firebase
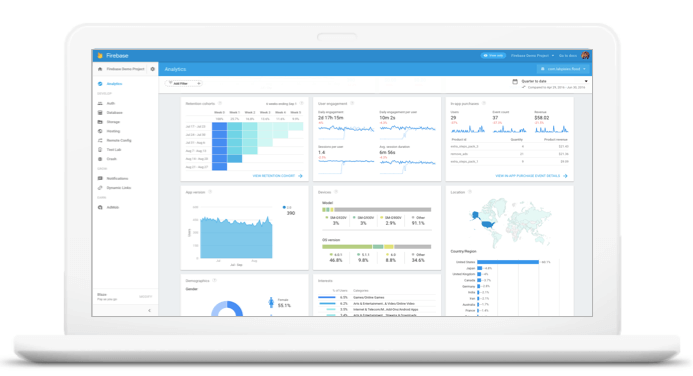
- What it does: A mobile platform from Google that aggregates user data and shares it on a dedicated dashboard.
- Cost: The Spark Plan is a free, basic plan, and the Blaze Plan is a PAYG with charges for database storage, application storage, and additional operational charges.
- Platform: iOS, Unity, and Android
App Analytics
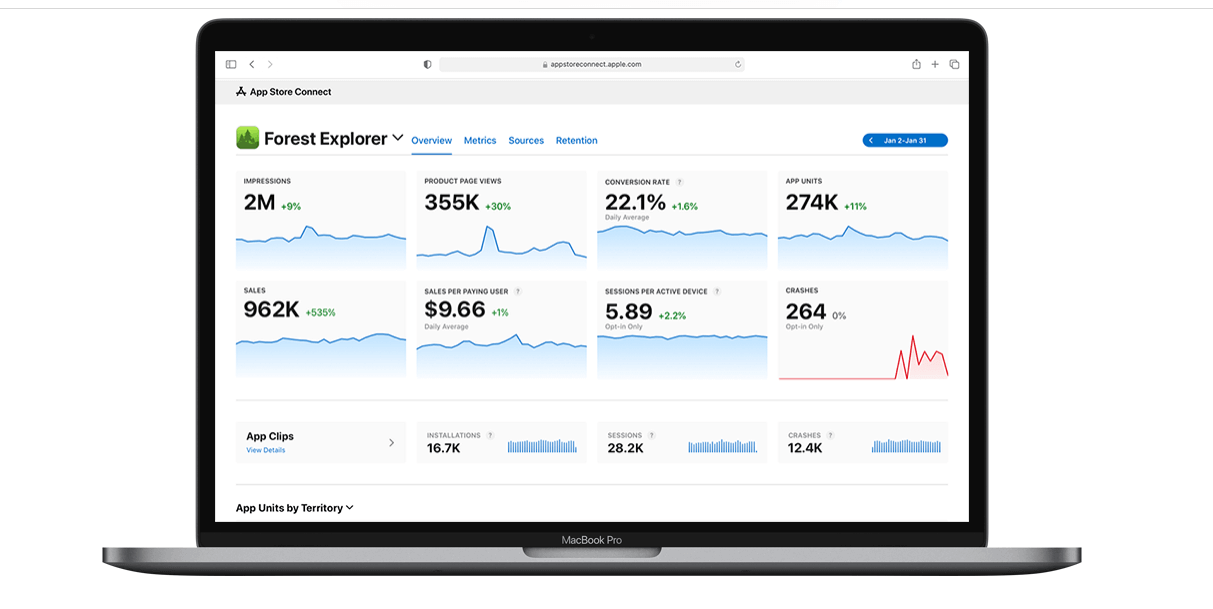
- What it does: A mobile platform from Apple that offers specialized analytics for apps published in the app store.
- Cost: Free (included with the Apple Developer Program membership)
- Platform: iOS
Flurry

- What it does: An extension of Yahoo’s Develop Network, the platform tracks user behavior across all platforms.
- Cost: Free to use as Flurry shares data anonymously with third parties
- Platform: iOS, Android
CleverTap
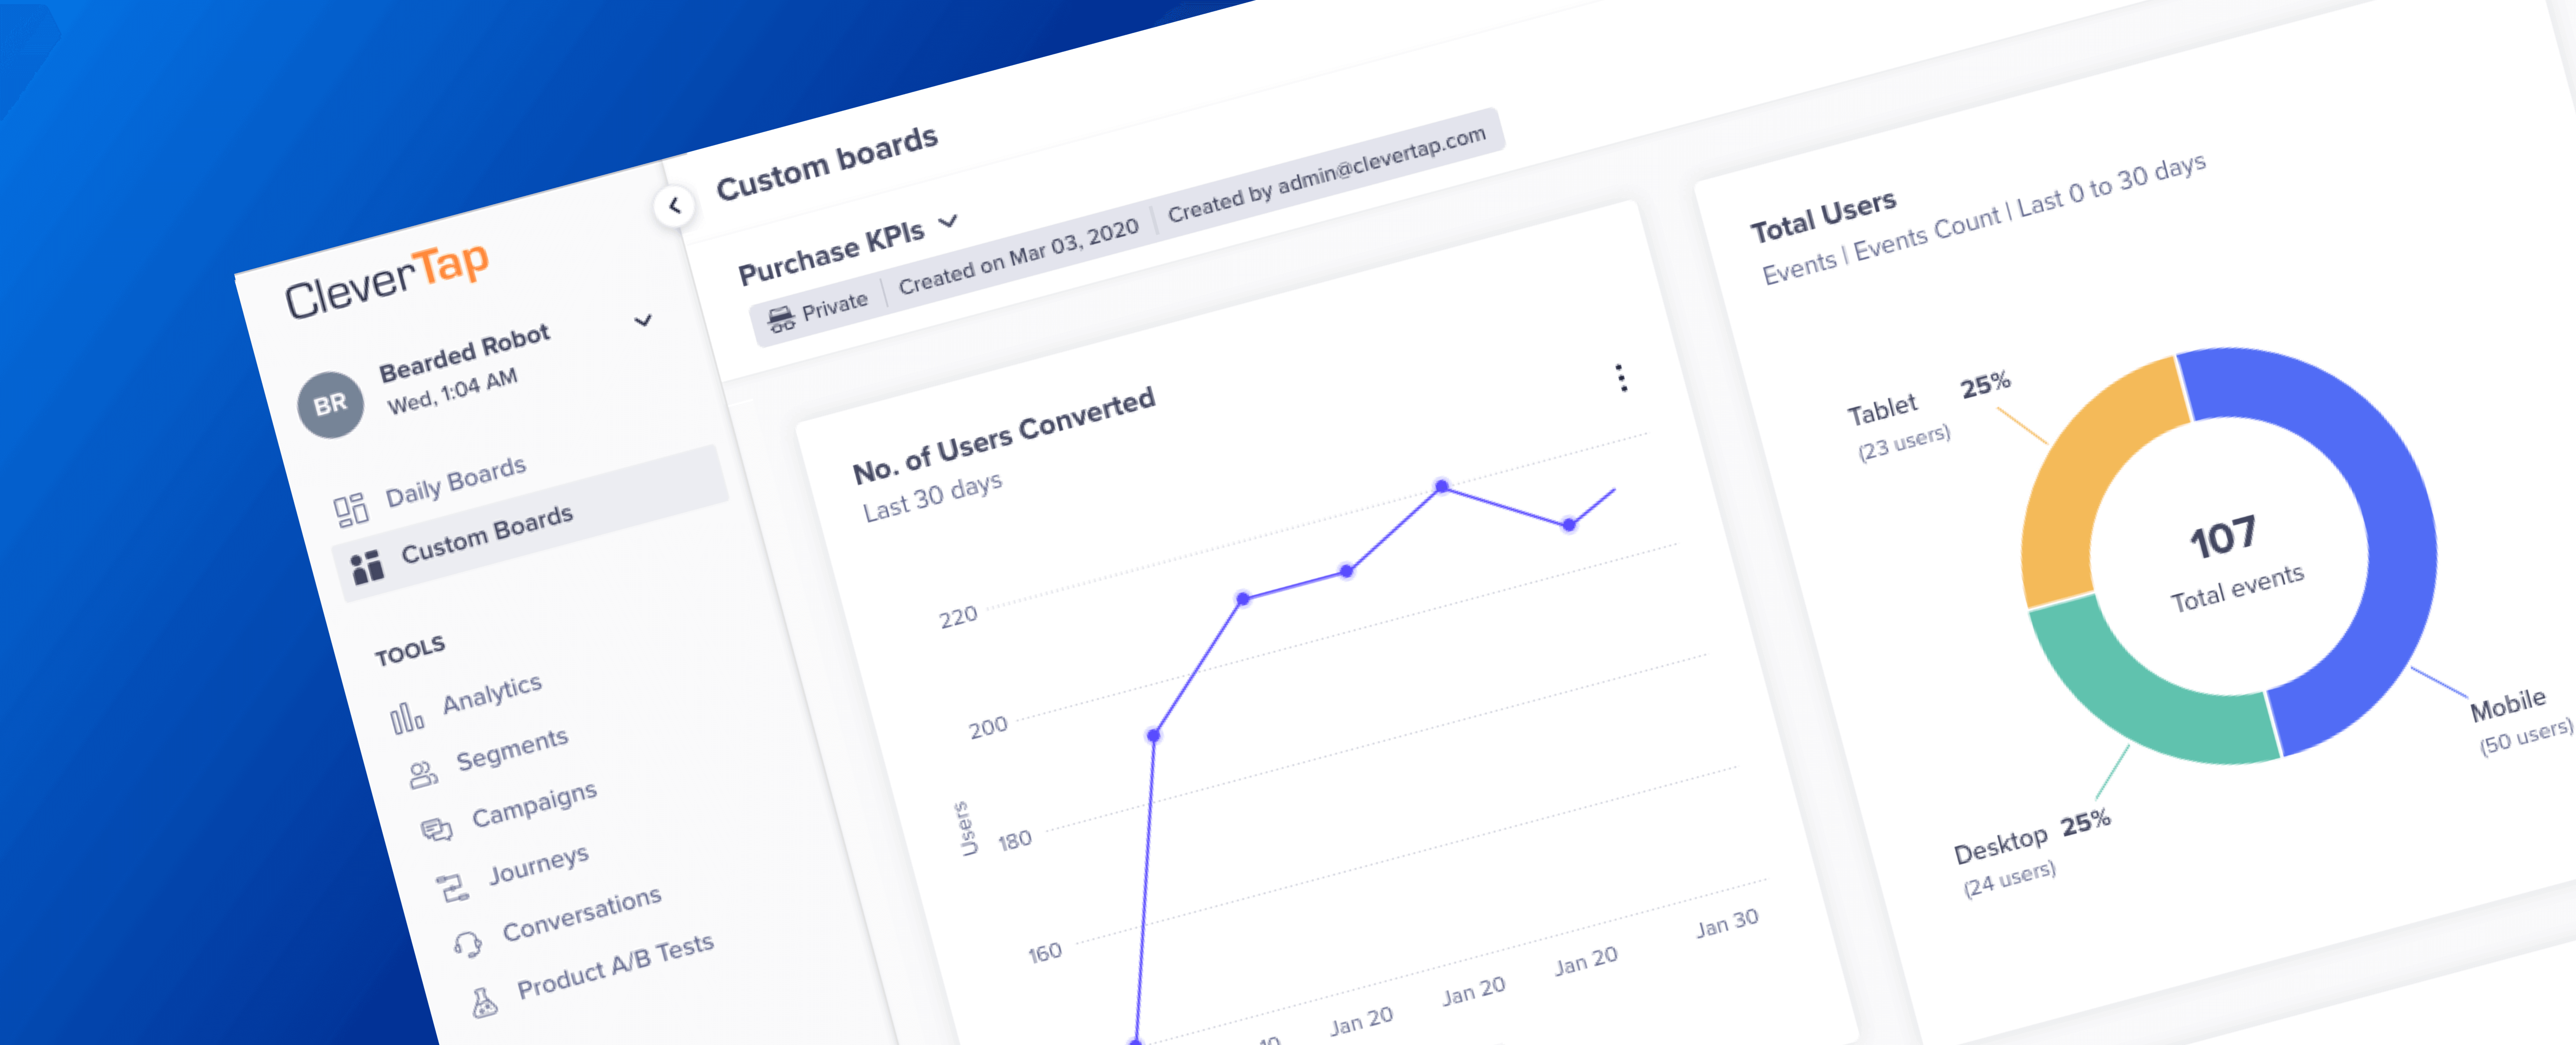
- What it does: An all-in-one platform that combines behavioral analytics with a suite of engagement tools to help mobile brands drive long-term growth.
- Cost: For startups looking at 20,000 Monthly Active Users (MAU), pricing is $200 a month and includes everything analytics and engagement. Advanced and Enterprise options available. Free 14-day trial offer.
- Platform: iOS, Android
12 Important Game Analytics Metrics for Marketers & Developers
In the world of mobile game metrics, it’s about what and who you know. Having the right metrics in place is important, but ensuring that you track them properly is even more important. Here are 12 metrics that every developer and marketer should watch.
1. Installs
What it is: A game’s installs are a key metric for benchmarking acquisition success
Why it is important: This number will be used to calculate all the other metrics mentioned
How to track: Actual installs, i.e., downloaded the app and completed the setup process
Bottom line: Be sure to track installations per device to see where your players are playing
2. Cost Per Install (CPI)
What it is: Pricing model used in mobile user acquisition campaigns, i.e., the amount spent on marketing activities in order to acquire a new user
Why it is important: A metric that can grow audiences, increase revenue, and inform your advertising budget
How to track: Ad spend divided by number of installs = CPI
Bottom line: The average CPI will differ by a number of factors such as country, platform, and ad format. It’s important for developers as it allows them to create targeted campaigns.
3. Daily Active Users (DAU)
What it is: Total number of unique players who complete an action in an app on a given day
Why it is important: A way to understand user retention or ”stickiness” of a game
How to track: Count the number of unique players in a 24-hour period
Bottom line: Use this metric to check whether your mobile game is part of a user’s daily life
4. Monthly Active Users (MAU)
What it is: Total number of unique players who complete an action in an app (at least once) in the last month (30-day period)
Why it is important: A way to understand signs of growth or ”stickiness” of a game
How to track: Count the number of unique players in a 30-day period
Bottom line: A user simply has to log in to qualify as an MAU so a high MAU doesn’t equate to high user engagement
And now, here’s how you calculate DAU/MAU ratio, AKA the Stickiness Ratio
DAU/MAU = Stickiness Ratio
Example: If an app has 200,000 MAU and an average DAU of 25,000, the Stickiness Ratio would be 12.5%. This means that the average user logged on 12.5 days of that month.
5. Session Length
What it is: The amount of time a user spends playing a mobile game in a single session
Why it is important: A way to track a single continuous gameplay experience
How to track: Subtract time when a user becomes inactive from time the game was opened
Bottom line: compare average session length to learn more about your user base and find those high-value, highly-engaged players who have longer than average session length
6. App Load Time
What it is: The time it takes for your app to load
Why it is important: Slow load times = short sessions, drop-offs, and uninstalls
How to track: Regularly open your app in iOS and/or Android to see load time
Bottom line: Keep an eye on app load time regularly to prevent uninstalls, poor app store reviews, and shorter sessions with players. According to Think with Google*, the probability of bounce increases 32% as page load time goes from one second to three seconds.
7. Drop-off Rates
What it is: players that are dropping off and not engaging with a game
Why it is important: A way to understand why and where players are losing interest
How to track: Look at analytics data for ”bounce rate” or ”number of exits”
Bottom line: Eliminate weak points by examining why a user might drop off. For example, is your game too complicated or are instructions unclear?
8. Retention

What it is: The number of players that return after the first launch of a game. Day 0 is commonly used to signify the day of download.
Why it is important: A way to track how the app is performing and the overall user experience
How to track: Separate players into groups, based on when they downloaded the app. Example: If a user opens your app on Day 1, they are a retained user. If they don’t, they are not. Common days to track: Day 1, 3, 7 and 30.
Number of players who use app in a set period of time / Number of players who use app in a previous time period
Bottom line: Day 1 is about first impressions, Day 7 is about regular players crossing the threshold, and Day 30 shows how many players play daily or weekly.
9. Average Transaction Value (ATV)
What it is: Average amount a user is willing to pay for an in-game upgrade or purchase
Why it is important: A way to gauge the “sweet spot” of how much players are willing to pay
How to track: Divide “total value of transactions” by number of transactions and sales
Bottom line: Higher value purchases = higher value players. Just be sure to measure ATV on a weekly and bi-monthly bias in case adjustments to your pricing model are needed.
10. Average Revenue Per Daily Active User (ARPDAU)
What it is: Daily amount brought in by each regular user
Why it is important: A way to understand how a game performs on a daily basis
How to track: Divide revenue by with number of players in a day
Bottom line: Be sure to track before and during user acquisition campaigns. During a campaign, segment new users by acquisition source so you can gauge which channels and campaigns perform best.
11. Average Revenue Per Paying User (ARPPU)
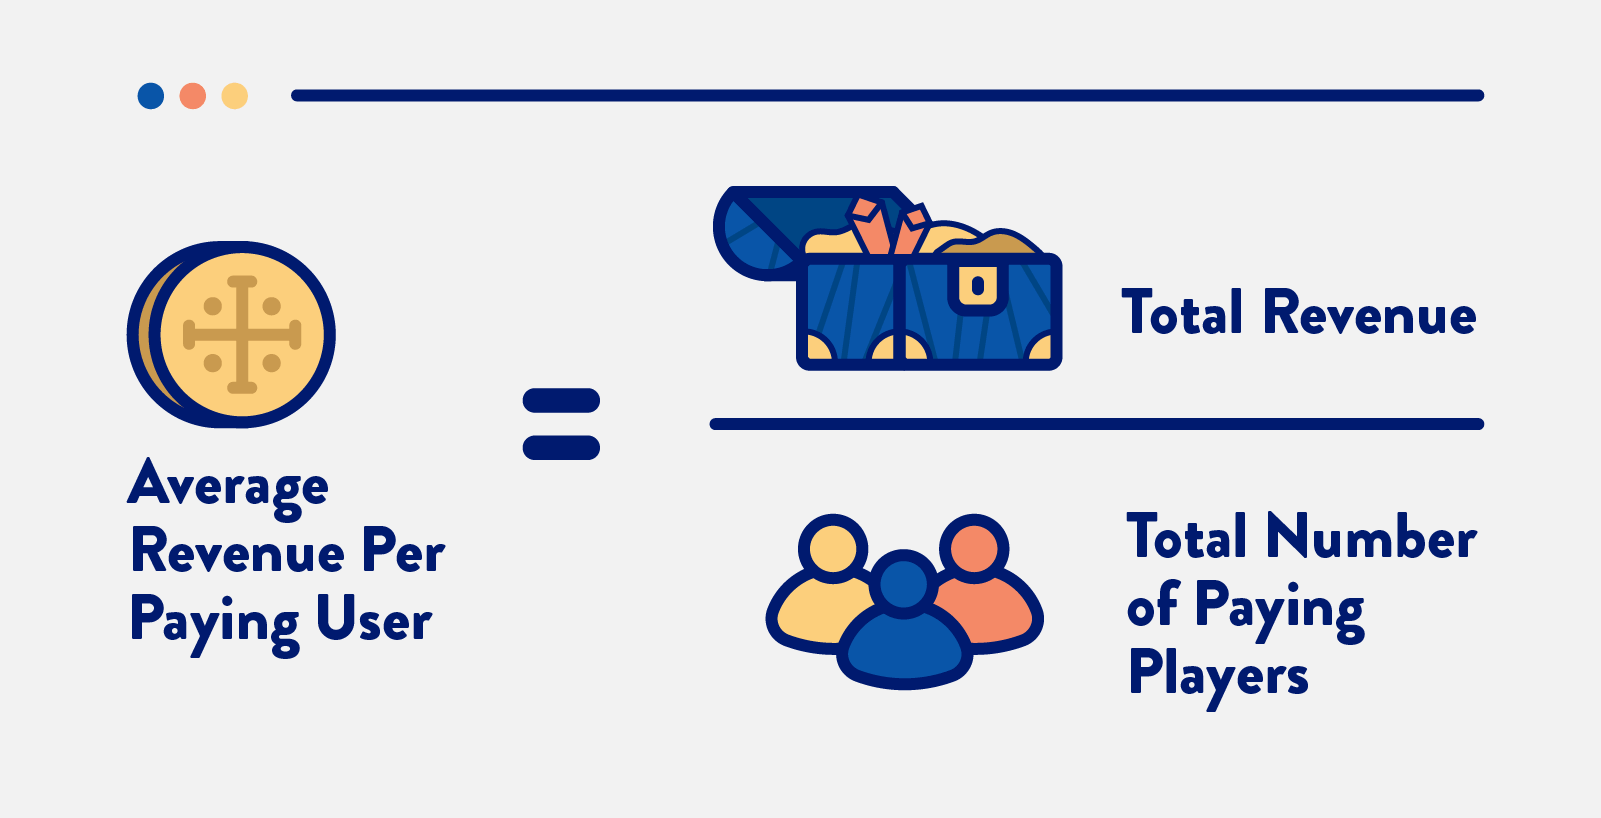
What it is: The subset of players who completed a purchase in a game
Why it is important: A way to understand your “whales” or % of people responsible for revenue
How to track: Divide total revenue by total number of paying players
Bottom line: Don’t be alarmed if your daily and monthly numbers vary greatly. This number is as much about how much a user is willing to pay as it is about their reaction to your price model.
12. Churn Rate
What it is: Measures % of players that stop playing your game over a period of time
Why it is important: A way to understand the number of lost players, i.e., those who uninstalled the game
How to track: 100% minus retention rate = churn rate
Bottom line: As mentioned above, Day 7 is a pivotal moment for your app. From Day 1 to Day 7, you tend to see the largest churn. This churn will increase until you get to Day 30 when the rate is likely to stabilize and you meet your loyal players.
Five Resources Mobile Game Developers and Marketers Should Bookmark
Get ready to add a few more bookmarks to your browser because these five resources offer great advice, gaming analytics, app strategy, and ways to increase revenue and engagement through apps. They are worth a read and reread as you evolve your strategy.
App Annie Blog
App Annie is a global, trusted source for market trends. Its blog is a great place for news, market data, product announcements, and mobile app strategy.
Game Analytics Book
This is the first book on the topic of game analytics. A collaboration between more than 80 people across the gaming industry and games academia (800 pages with more than 200 illustrations), Game Analytics – Maximizing the Value of Player Data is the ultimate resource and a great read.
Lecture 15: Game Analytics from Cornell University
A 34-slide lecture designed by The Game Design Initiative at Cornell University that covers big data, how to harness meaningful data, and gaming analytics.
Blog post: Churn Rate: How to Define and Calculate Customer Churn
A common question amongst marketers: how do I reduce our churn rate? According to Quettra₁, the average app loses 77% of its DAUs within the first 3 days after install. Check out our blog post for tips on how to reduce churn rate as well useful benchmarks for mobile apps.
Blog post: Five Ways to Increase Revenue and Engagement with Mobile Apps
This blog post from Adobe offers five ways to create a strong path for players to convert. It encourages an approach that turns new players into purchasers.
However you choose to utilize these 22 metrics, resources, and tools, we hope you find them useful on your path to further understanding mobile game analytics. Here at CleverTap, we remain excited about the prospects of mobile gaming and how 2021 trends will accelerate the demand from gamers, innovation from developers, and strategies for marketers.

See how today’s top brands use CleverTap to drive long-term growth and retention
Recommended reads for you:
10 Best Customer Segmentation Tools to Know Your Audience and Drive Results
Top 15 Customer Engagement Platforms Every Marketer Should Know
Top 10 Email Marketing Platforms to Boost Your Campaigns
Top 14 Push Notification Platforms to Boost User Engagement
Top 21 AI Email Marketing Tools to Boost Engagement & Conversions
Subharun Mukherjee 
Heads Cross-Functional Marketing.Expert in SaaS Product Marketing, CX & GTM strategies.
Free Customer Engagement Guides
Join our newsletter for actionable tips and proven strategies to grow your business and engage your customers.
