


Table of Contents
Categories
Most Popular


In the previous article, we discussed how sampling could turn your Big Data to Smart Data and briefly laid out few sampling techniques. Let’s now discuss the techniques in detail.
Probability Sampling
Probability Sampling is one in which every element of the population has a chance or a probability (greater than zero) of selection, and this probability can be determined.
Types of Probability Sampling:
i) Simple Random Sampling
This is the easiest sampling method. Suppose you need to sample data from 10 observations. Each of the observation will have the selection probability of 1/10.
Example: You put 10 balls numbered 1 to 10 in a bowl. Each ball has a uniform probability or 10% chance of being selected. Shake the bowl vigorously, close your eyes and pick any 2 balls. This is simple random sampling.
If you had to run this experiment over larger sample size, you will be using a computer algorithm to efficiently run random sampling. Simple random sampling is very easy to accomplish but not a highly efficient method. There may be sub-groups in the dataset like gender, geography, etc. for which you might require a balanced representation in the sample. Random sampling may not be able to guarantee the balanced representation.
ii) Stratified Sampling
Stratified Random Sampling, also sometimes called proportional or quota random sampling, involves dividing your population into homogeneous subgroups and then taking a simple random sample in each subgroup with equal or unequal weights.
Equal weights
Equal weights would imply that the fraction of the observations you would sample for each sub-group will be the same.
Example: Assume you have a dataset with information on Gender.
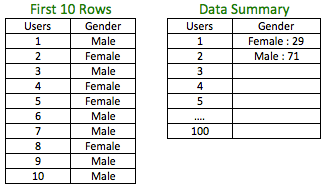
The above data has 100 users with 71% male and 29% female. If you had to sample 30% i.e. 30 observations from the above dataset, a simple random sample may not guarantee the proportion of 71:29 for male:female in the sample.
In order to maintain the proportion, you could sample 30% from Male (71 * 30%) and 30% (29 * 30%) from Female and combine them. This way you have retained the proportion of males and females in the sample.
Unequal weights
Unequal weights would imply that the fraction of the observations you would sample for each sub-group is not the same.
Example: Suppose you are building a predictive model to detect fraud. Your training set or the set on which you would be building the model will typically have extremely low cases of actual fraud. Let’s assume we are working with the data below:
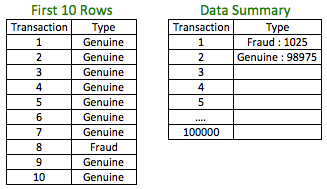
The percentage of fraud is 1.03%. Just building your model based on the available dataset may not give you a good model as it will be extremely difficult for any technique to capture the signal from the data due to very low cases of actual fraud. In such a case, it could be a good idea to build a new dataset for training, which has a higher percentage of fraud observations. The way we can do it is by taking all the cases of fraud observations and a random sample of genuine observations.
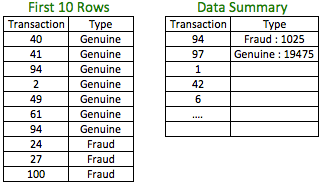
The above dataset is a stratified sample of the original dataset with the fraud observations accounting for 5% of the observations. This percentage could be higher or lower based on the quantum of fraud cases needed. The transaction number indicates the random nature of the sample selected from the population.
In the example, we have used unequal weights (100% for fraud cases and 19.7% for genuine cases) for sampling.
iii) Cluster Sampling
Suppose you run a hyper-local grocery business, and you need to run a marketing campaign for users based in a city. Due to budget and logistical constraints, the campaign can’t go out to the entire customer base and has to be restricted to only few regions. In such a case, neither a simple random sample nor a stratified sample with sample from each of the region will work due to the constraints involved. Instead, you could use Cluster sampling by:
Step 1: Selecting regions that are close and probably with high density.
Step 2: Randomly sample the users within those regions.
This way you would be able to satisfy the constraints.
iv) Systematic Sampling
Systematic sampling is almost like the simple random sampling but with a subtle difference. An ecommerce app might use systematic sampling to analyze its visitors. It might randomly select the first visitor after which it might select the 50th, 100th, 150th, and so on – visitor to create the sample. This way it incorporates the time dimension to analyze the visitor behavior.
Steps Involved:
Step 1: You start with an integer, which is a number less than the total number of observations in the dataset. This number could be generated with a random number generator. This observation corresponding to this number is the first data point in the sample.
Step 2: The next step is to pick another integer, which will serve as the constant difference between any two consecutive numbers in the progression.
Example: You have a dataset of 100 individuals and need 11 subjects. Say the first observation of the sample is the 5th observation of the population and the interval is say 9. The members of the population included in the sample will be 5th, 14th, 23rd, 32nd, 41st, 50th, 59th, 68th, 77th, 86th and 95th observation. Some use a modified systematic sampling technique wherein they first identify the needed sample size. Then, they divide the total size of the population with the sample size to obtain the sampling fraction. The sampling fraction is then used as the constant difference between subjects.
v) Multistage Sampling
It is combination of any of the above sampling techniques. In Cluster sampling, we discussed the example of hyper-local shopping where we randomly sampled the targets after identifying the clusters. During sampling, there is a chance that we don’t get the geographical diversification within the clusters due to random sampling. It may so happen that the sampling results in users who are very close to each other geographically within those clusters. The alternative is to create additional clusters within such clusters based on a fixed geographical distance (i.e. stratified sample using geographical distance) and then randomly sample within those newly created clusters to get a more diversified sample base.
vi) Multiphase Sampling
Suppose you run an event-ticketing business and would like to survey your users offline. But the cost and the quality of participants matter to you and hence, a blanket survey of users won’t make sense to you. Based on the constraints, you devise a strategy that any visitor who spend ‘x’ amount of session time in your app for next 30 days would be selected, after which only those users who have transacted ‘y’ times historically or in future gets surveyed. In this manner, you could have achieved the constraints.
A multi-phase sample collects basic information from a large sample of units and then for a sub sample of these units, collects more detailed information. The most common form of multi-phase sampling is two-phase sampling (or double sampling), but three or more phases are also possible.
Non-Probability Sampling
Non-Probability sampling is one where some elements of the population have no chance of selection or where the selection probability cannot be accurately determined.
Types of Non-Probability Sampling:
i) Accidental/Convenience Sampling
Assume you have a business catering to national as well as international audience and you wish conduct an in-person survey with a sample of your users. Due to cost and time constraints, you choose to select participants in your home country or rather your city, which is most accessible to you. This is a case of Convenience sampling where subjects are selected because of your convenient accessibility and proximity.
ii) Purposive/Judgmental Sampling
Sometimes, you might take the opinion of a domain expert to arrive at the sample. Instead of scientifically choosing a sample, you might rely on the qualitative judgment of a few to arrive at such a sample.
iii) Quota Sampling
Quota and Stratified random sampling are almost the same but with one key difference. The subjects in Quota sampling are not chosen from random or systematic sampling from sub-groups like in Stratified random sampling.
Conclusion
As an analyst, it is easy to get carried away with the deluge of big data and to rely on its abundance to deliver better models. However, use of data without context and objective could prove counterproductive and result in poor analysis and models. Contextual and objective driven samples from the large volume and variety of data that are important tenets of big data could prove to be an extremely effective tool to deliver better analysis and robust models.
Jacob Joseph 
Heads Data Science.Expert in AI, Data & Analytics and awarded 40 under 40 Data Scientists in India.
Free Customer Engagement Guides
Join our newsletter for actionable tips and proven strategies to grow your business and engage your customers.
