


Table of Contents
Categories
Most Popular


We at CleverTap, strongly believe that your marketing engagement strategy needs to be backed by powerful, real-time and actionable analytics. This is why we built a platform that unifies analytics and engagement under one roof. Thriving from the same ethos, we are extremely excited to roll out our brand new analytics feature ‘Pivots’ – the champion of insights!
What are Pivots?
Pivots is an industry first data-exploration tool that summarizes your data and helps you slice it and dice it with the help of tables and other meaningful data visualizations.
Historically, event analysis has been used by marketers and product owners to look at event counts and how they trend over time, or to explore the values of a single event property. With Pivots, you can now correlate data across multiple properties and get additional insights that can help them to make better business decisions.
Your analysis can be pivoted on any event or user property, demographics, technographics, session fields, etc. This data can be viewed in multiple different visualizations, with each visualization having it’s own significance. While being completely exploratory, it enables data to speak to you directly, without any assumptions or biases!
What makes Pivots cool?
Let’s say that you own a flight booking travel business. You have your tickets purchase data (Charged event) flowing into CleverTap. With Pivots, you will be able to get instant answers to:
The most active window for transactions
Popular booking class in various cities
Revenue made across cities with various booking class
Trend of revenue from different cities
Popular category of flight bookings made from the app
By pivoting on day of the week and on time of the day, you can spot the golden window for the highest number of transactions on your platform.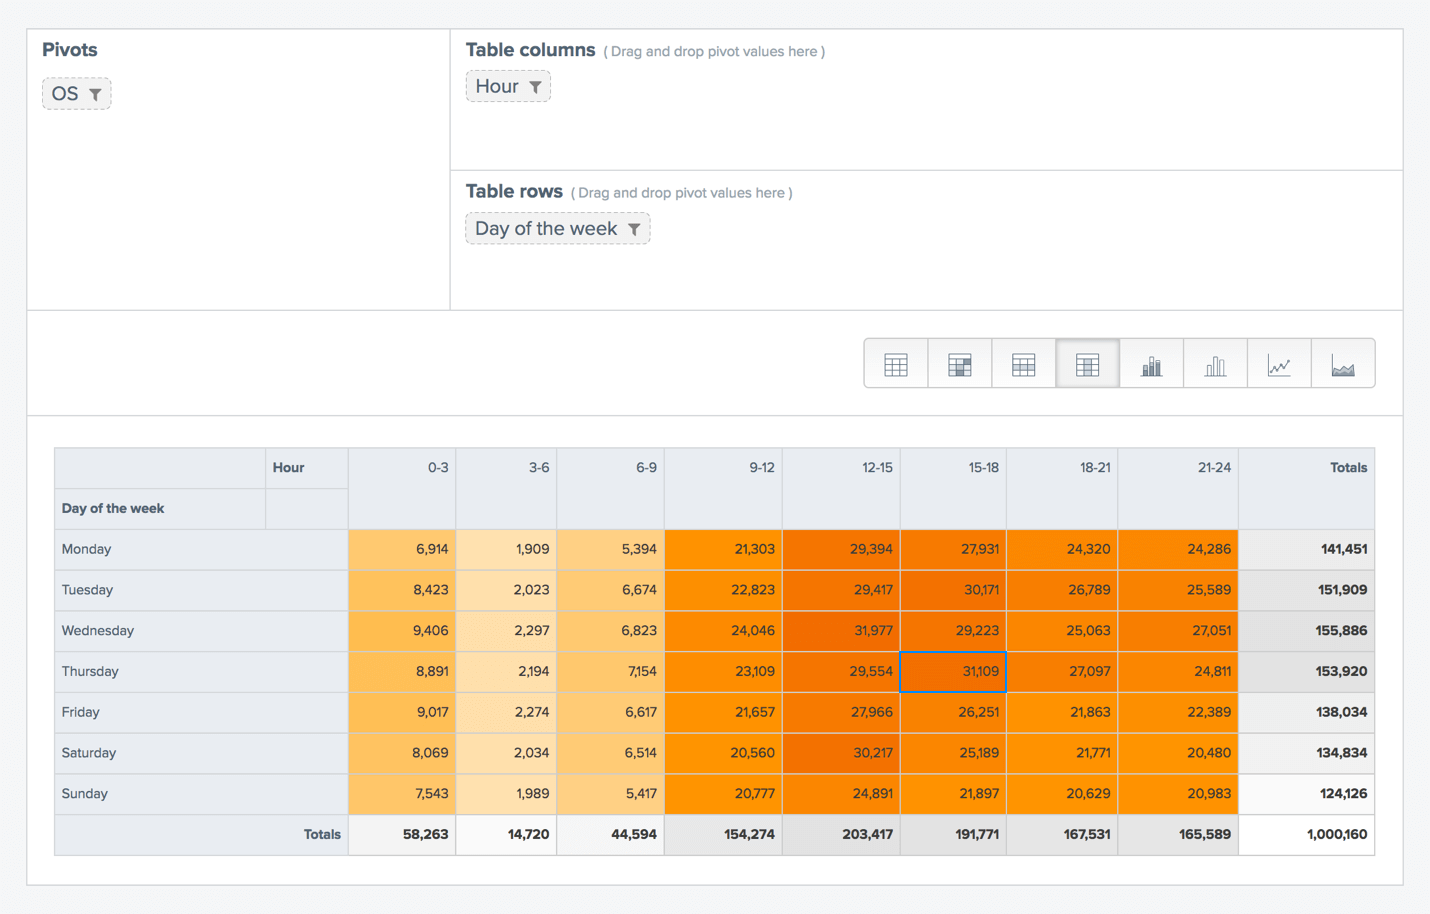
Thus, based on the heatmap above, you can infer that Thursdays between 3 pm and 6 pm in the evenings is when your users convert the most. Based on this insight, you can act faster on cart abandonments in this period to ensure conversions.

By pivoting on cities and booking class, you can infer that the economy class is popular in New York City, whereas the business class is not.
You can pivot the results on the sum of a particular integer property of an event (price in case of Charged event)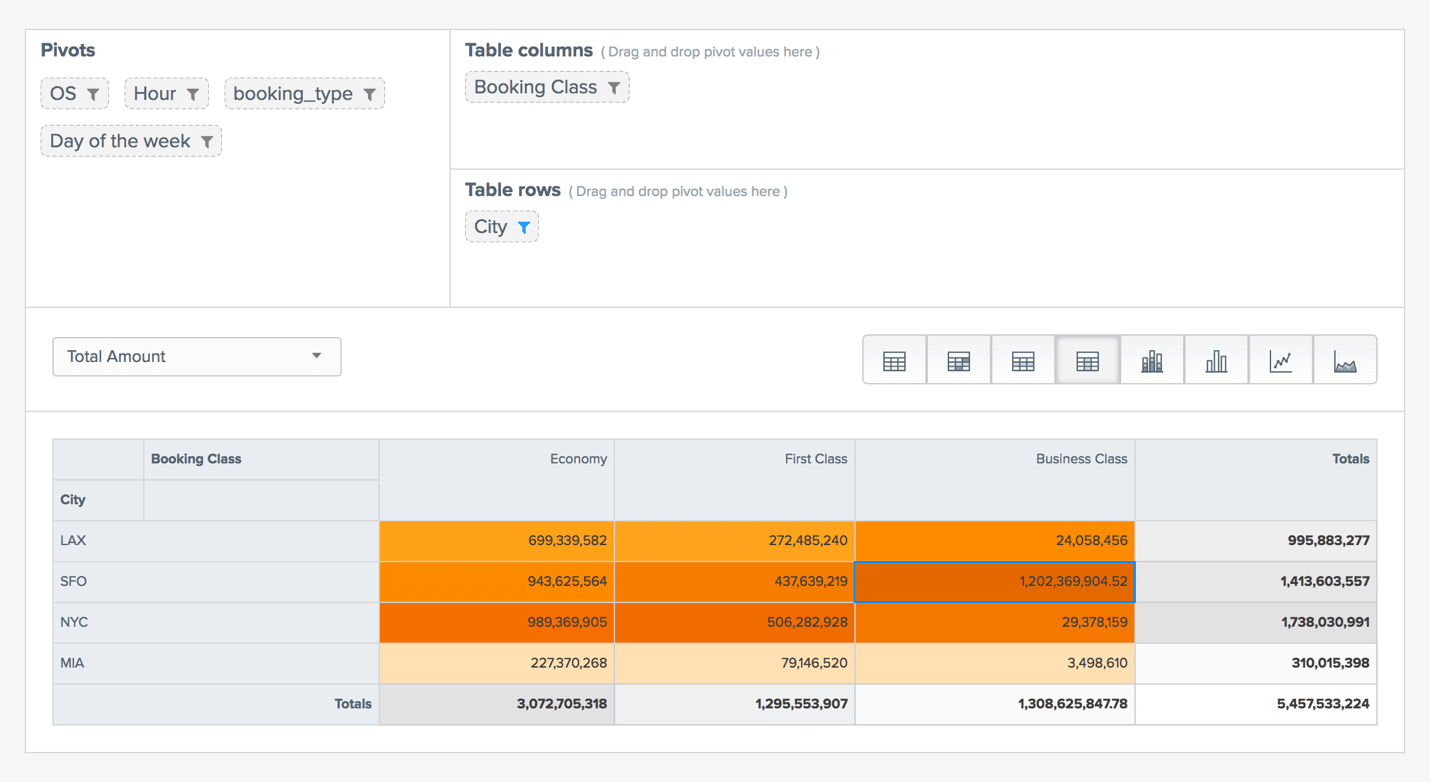
Albeit having higher transactions in New York City overall, San Francisco has generated higher revenue even with lesser number of business class bookings.
You can view the trend of revenue from different cities over time by pivoting on cities and time of the week.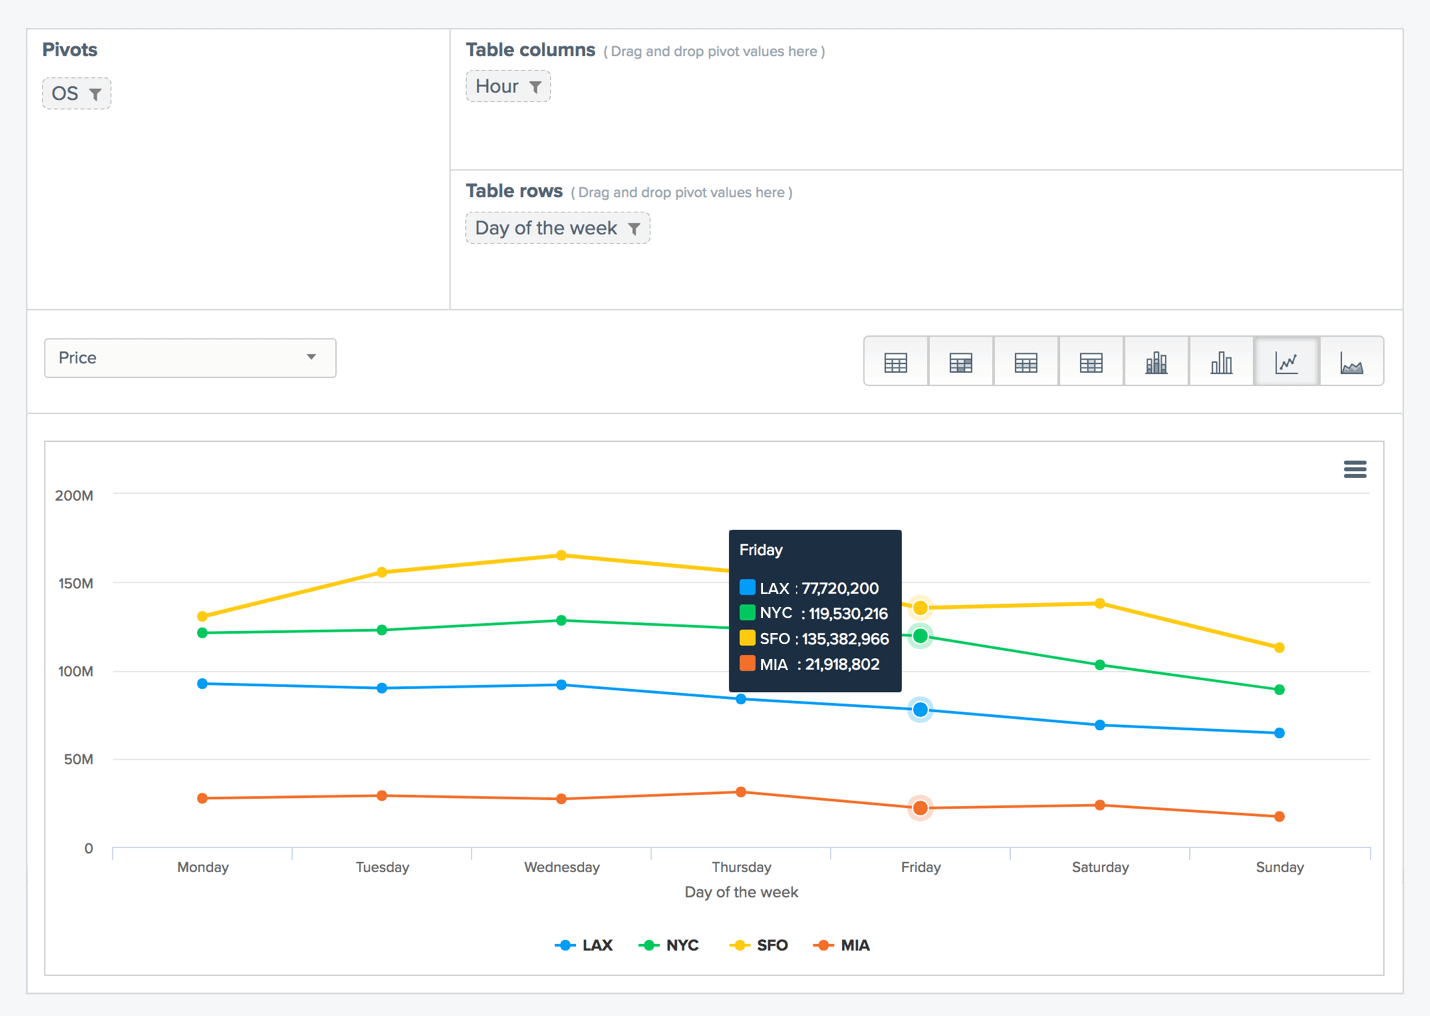
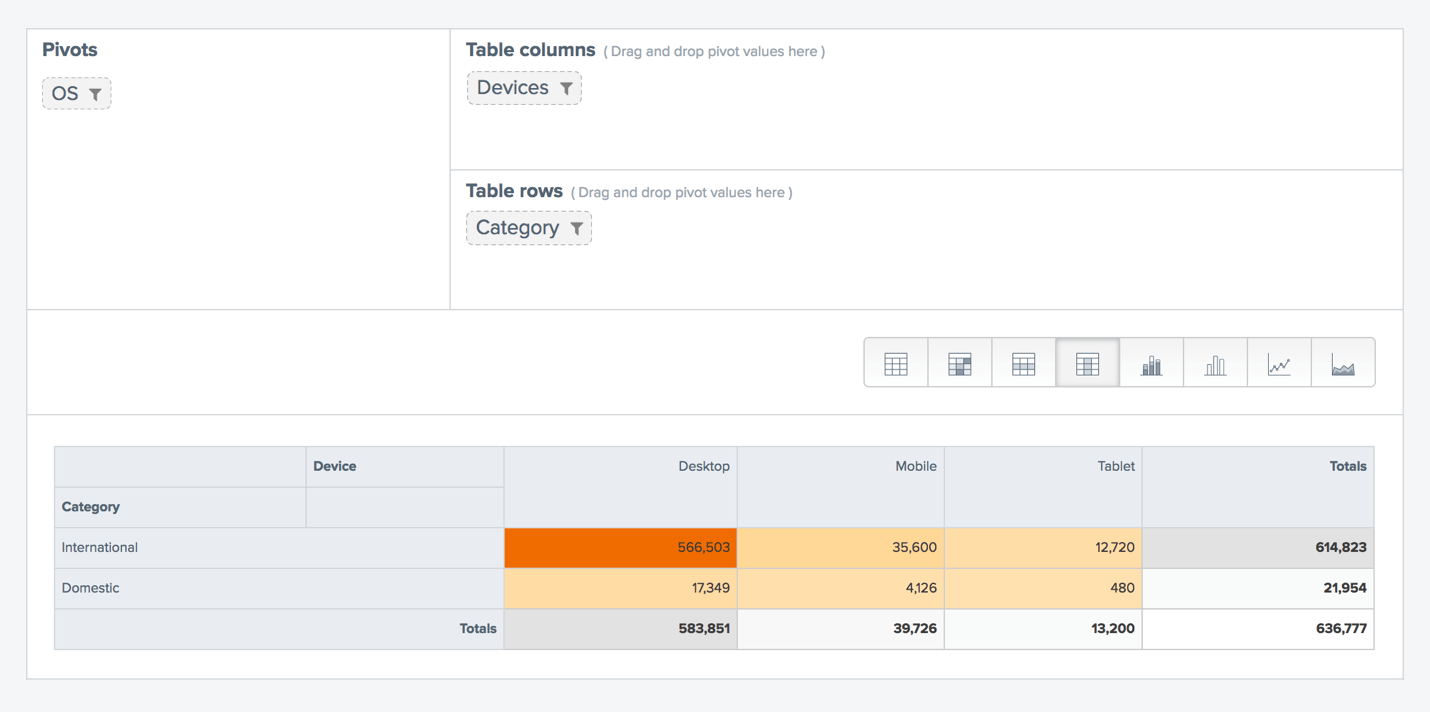
By pivoting on category of the booking, and the device used for the booking, you can analyse whether international bookings are made from the app or website.
You can do all this, in less than 10 minutes with CleverTap Pivots (no more formulas and no more offline data crunching!)
We want to help our clients ease their workload and increase their efficiency. Pivots allow product managers and marketers with a reporting tool for drilling down large volumes of data by creating and viewing custom reports that help glean valuable insights. And oh, did we mention that all of the above data can be directly exported into a .csv file if you wish to do you own analysis?
But here’s the best part: Pivots, with all its beauty and dynamism, is completely horizontal. Whether you are an ecommerce store or a food tech company, Pivots empower all marketers to make decisions based on insights and visualisations.
We hope you play around with this feature and love it as much as we do! We’d love to hear what you think about this. It is available in beta for all our clients for a limited duration.
Meanwhile, go ahead and play with your data, let it speak to you and get to know those essential truths about your app users that really matter!
Read more on our docs.
The Intelligent Mobile Marketing Platform
Subharun Mukherjee 
Heads Cross-Functional Marketing.Expert in SaaS Product Marketing, CX & GTM strategies.
Free Customer Engagement Guides
Join our newsletter for actionable tips and proven strategies to grow your business and engage your customers.
