


Table of Contents
Categories
Most Popular


Experienced mobile marketers know: real success isn’t about getting someone to download your app.
It’s about convincing them to come back.
Vanity metrics like downloads and active users don’t give you the whole picture. It’s easy to look at these numbers and think you’ve got healthy growth. But in reality, you’re losing most of your users after just a few days.
You’re spending precious time and resources acquiring new customers — all for nothing.
So how do you find out exactly what makes some users leave while others stay?
Don’t resort to guesswork!
To find the answers, dig deeper into your app’s metrics using a method called Cohort Analysis.
What is Cohort Analysis?
Cohorts? Segments? Shifting curves? We get it — this stuff gets confusing fast.
But here’s the deal:
It’s actually pretty simple.
To start, we’ll strip away the jargon and define cohort analysis in plain English.
“Cohort” is just a fancy word for group.
Instead of looking at all users in one broad view, cohort analysis breaks them down into groups. Think platform, acquisition date or channel, specific user behavior — anything you want.
Cohort analysis measures user engagement over time, making it easy to spot friction points and behavioral patterns.
Essentially, it gives you a data-driven approach to understanding exactly what makes users fall in love with your app — so you can keep making it happen.
Cohort analysis is a powerful way to see how users are engaging with your app — and get actionable insights into specific changes you can make to dramatically improve user engagement.
Here’s an example: create a cohort (group) of new users who have launched an app for the first time. Then see how many of them come back to the app over the next 10 days.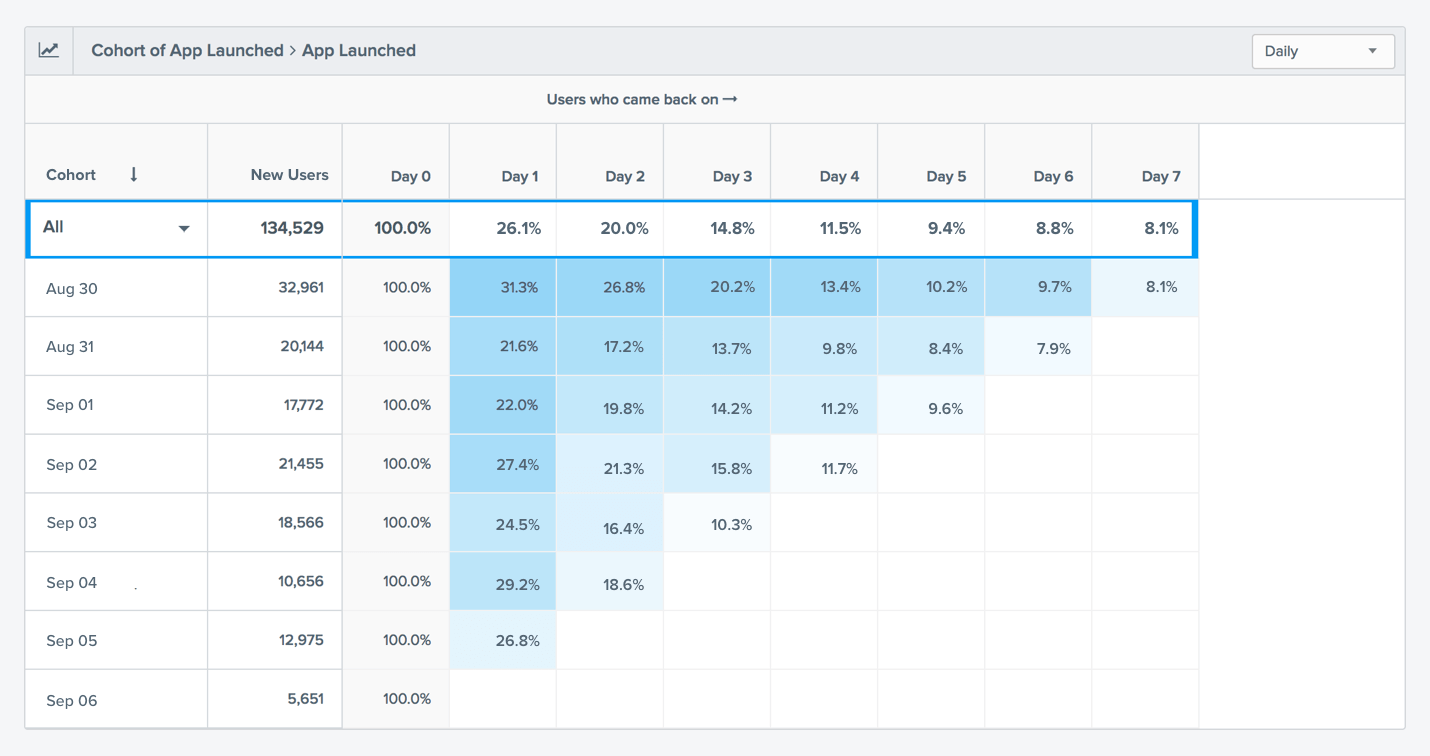
This retention table may look complicated, but stick with me!
We can see that:
- 32,961 users launched the app on August 30. Of these users, 31.3% came back on Day 1, 22% on Day 4, and 8.1% on Day 7. That means on the 7th day after using the app, only 1 in 12 users are still active.
- Out of all new users acquired between August 30 and September 6 (134,529 total), only 26.1% of them are retained on Day 1, 11.5% on Day 4, and 8.1% on Day 7. That means we’re losing 92% of our hard-earned customers in the first seven days.
- Retention by Acquisition Day: By comparing different cohorts, we can see trends about how many users are coming back to the app after 4 days, 7 days, etc. This data can give you important insights into your onboarding experience, product quality, user experience, and product/market fit.
- Retention Over Time: By looking at the number of days that people in each cohort are coming back to your app, you can see how healthy each cohort is not only in the first few days but over the long term.
From there, you can pinpoint where users are dropping off. And you can see what your most engaged user groups are doing, so you can influence new users to follow the same path.

Mobile Engagement & Retention
How to Do Cohort Analysis to Improve User Retention Rates
As we’ve discussed, cohort analysis involves looking at groups of users to:
- see how their behavior changes over time
- look for patterns of behavior that influence retention
- compare user groups to identify best practices and use cases
But when it comes to using cohorts to improve your user retention, where should you start?
We recommend beginning with two types of cohorts:
- Acquisition Cohorts: Group users by the day, week, or month that they first downloaded your app. By measuring retention for each of these cohorts, you can determine how long people are using your app and where you’re losing them.
- Behavioral Cohorts: Group users by the specific behaviors they have (or haven’t) taken in your app within a given time frame. (For example, App Install, App Launch, Complete User Profile, Add a Friend, Complete a Purchase, etc., — or any combination of these actions.)
You can then track how long different cohorts stay active in your app after they perform certain actions, and see which actions have a positive or negative effect on retention.
We’ll look at a couple of ways you can use acquisition and behavioral cohorts to improve user retention.
Strategy 1: Uncover Your App’s Friction Points with Acquisition Cohorts
Let’s revisit our trusty daily cohort chart, which is also an acquisition cohort.
Another helpful way to visualize this information is to chart out a retention curve. This makes it easier to see exactly when most users are leaving your app.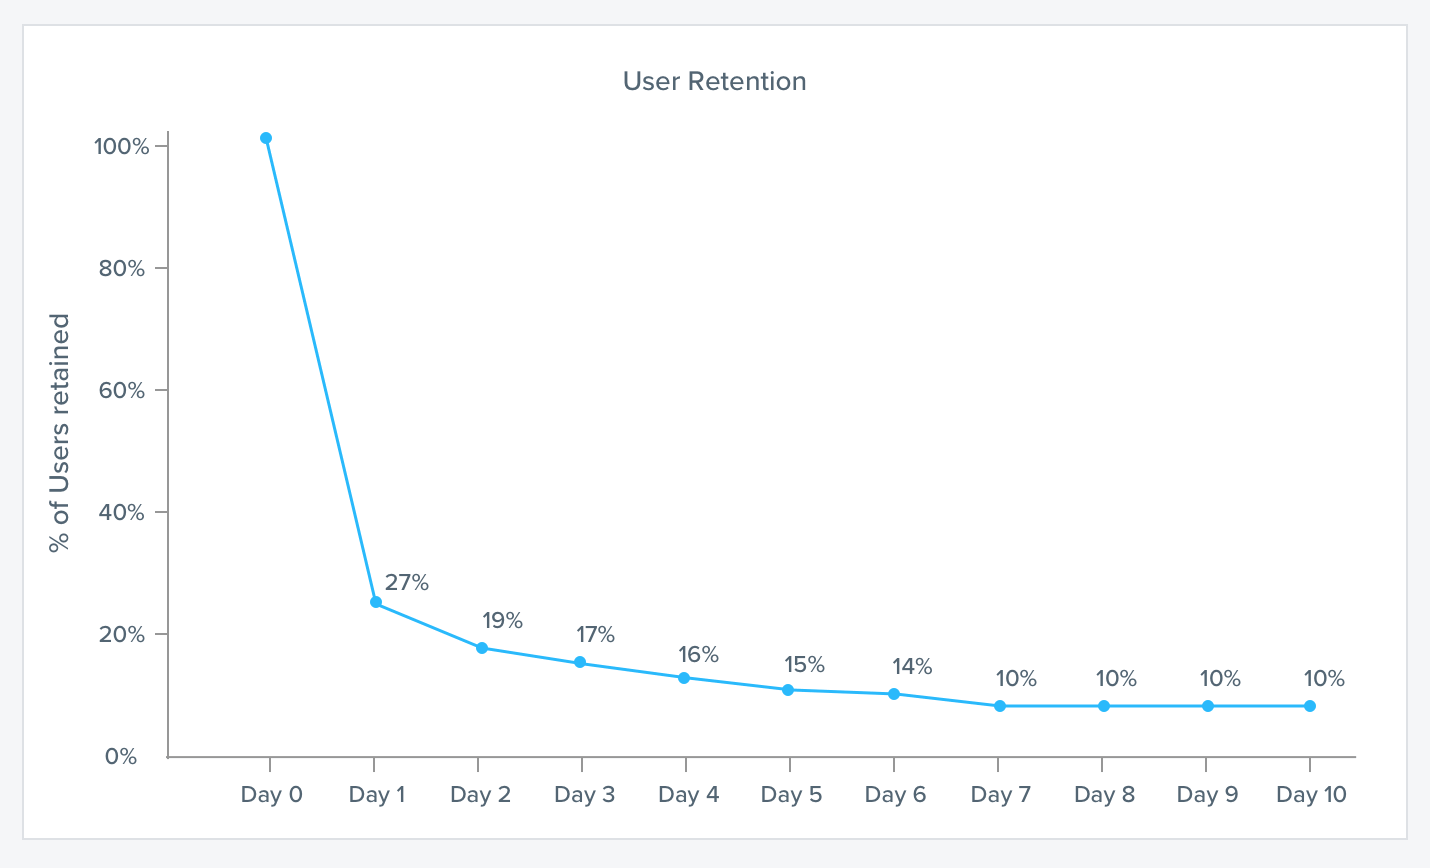
We can see immediately that the biggest drop off occurs after the first day: almost 75% of users stop using the app.
A second significant drop occurs on day 7, falling to 10% before the curve levels off.
Obviously, the onboarding experience needs to be revamped to get users to experience the app’s core value as fast as possible.
But how do you know which aspects of the onboarding process to change?
Instead of making changes based on whichever of your team members argue the loudest, cohort analysis lets you use hard data to answer these questions.
Acquisition cohorts are great for identifying trends and pinpointing where customers churn, but they don’t provide insights into why they’re leaving.
This brings us to our second type of cohort:
Behavioral cohorts.
Strategy 2: Discover Which Actions Drive Retention with Behavioral Cohorts
Each of your users makes countless decisions about how to interact with your app: using feature Y vs. feature Z, commenting on content vs. passively consuming it, completing a profile vs. leaving it blank, etc.
And each of these decisions affects whether they stay or go.
Here’s another example to help simplify how behavioral cohorts can uncover opportunities for improvement. Using a movie ticketing app as an example, we’ll look at all users who launched the app and made a purchase.
Then we can compare with all users who’ve connected their PayPal accounts to purchase movie tickets in one click.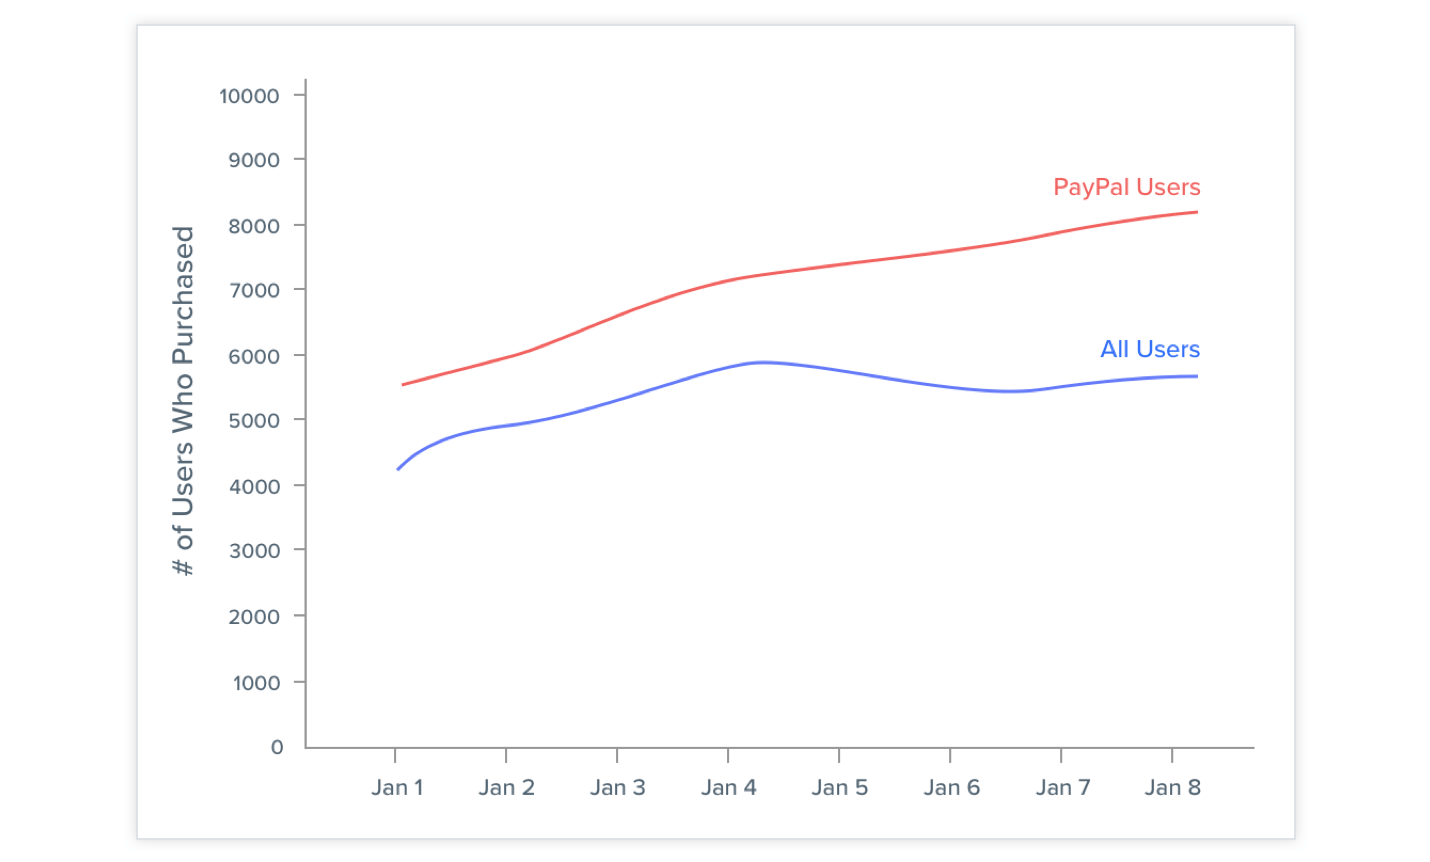
This can answer interesting questions, like:
- Do users who enable PayPal have a higher retention rate?
- Are these users more engaged? (I.e., Higher purchase frequency or order value?)
Next, test user behavior by looking at a cohort analysis example that compares users who purchased tickets and those who abandoned their shopping cart.
Cohort analysis can answer questions like:
- How long did it take for successful purchasers to check out after adding tickets to their cart?
- When is the best time to target those who abandoned their carts with a remarketing campaign?
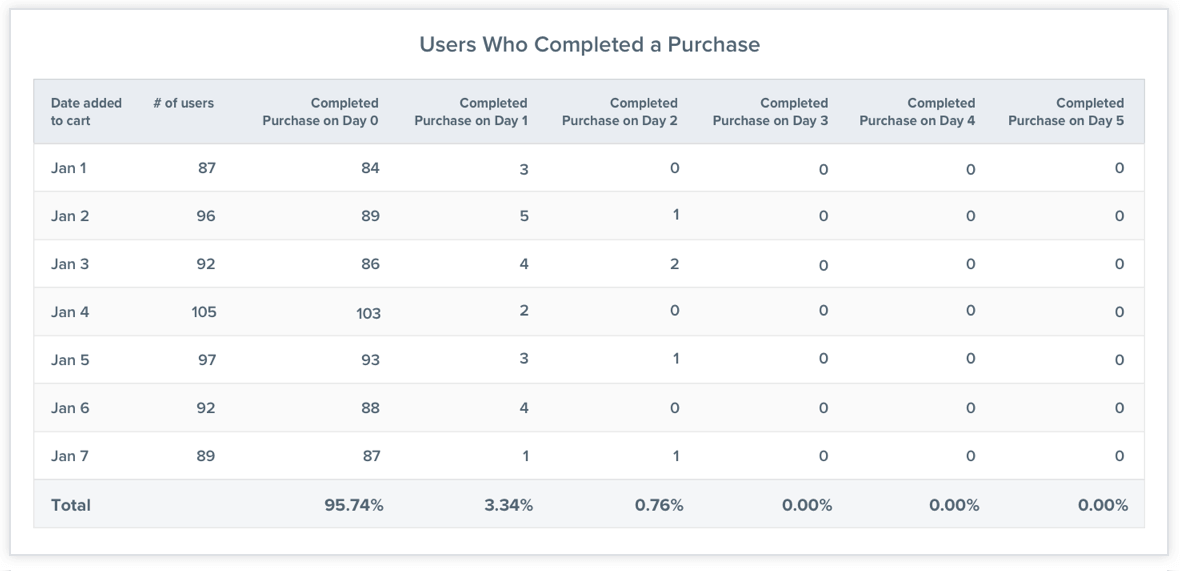
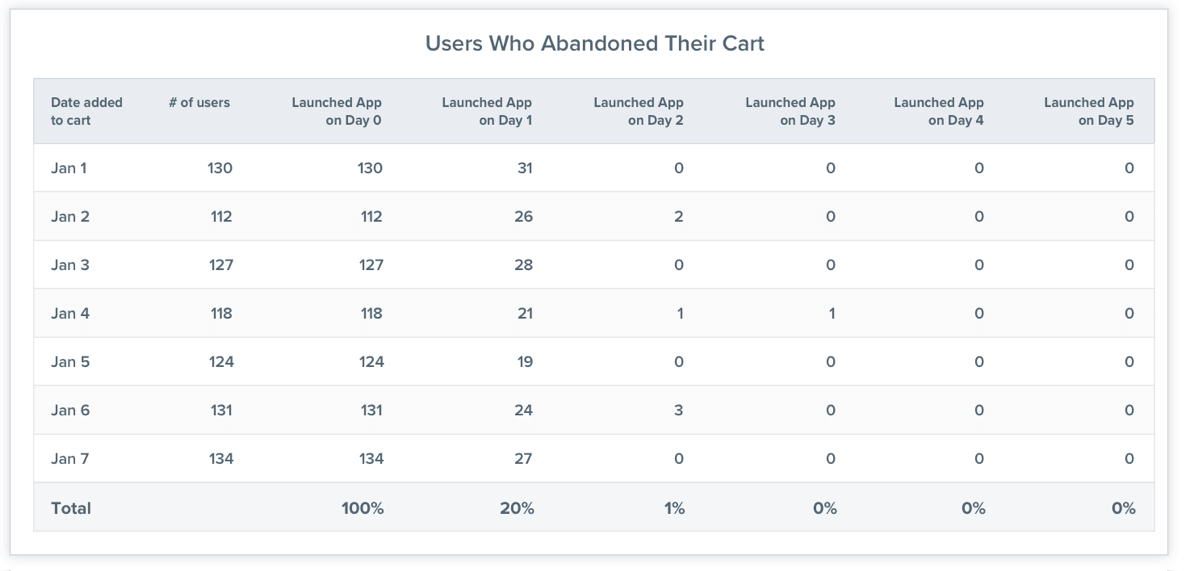
Using this cohort analysis retention table, we can see that most users who purchased did so on the same day they added the item to their cart (95%).
And users who abandoned their cart on day 1 didn’t come back to the app…
…Ever.
So put all your remarketing efforts into recapturing their interest within the first 24 hours.
You could send a push notification with a 20% off promo code good for today only, with a deep link that takes them straight back to their cart. Or send an email on Friday afternoon featuring that movie’s “Certified Fresh” rating on Rotten Tomatoes.
Combining Cohorts for Even Deeper Insights
Now that you’ve identified certain user behaviors that seem to affect engagement, where do you go from there?
Say your cohort analyses show that 78% of all users of your movie ticketing app churn within the first day. But only 65% of users who save a “Favorite” theater churn within the first day.
Should you start bombarding your users with prompts to designate a favorite theater?
First, you need to verify your findings. Correlation does not equal causation!
Take a look at all your users who didn’t mark a favorite theater to see where their churn rate stands.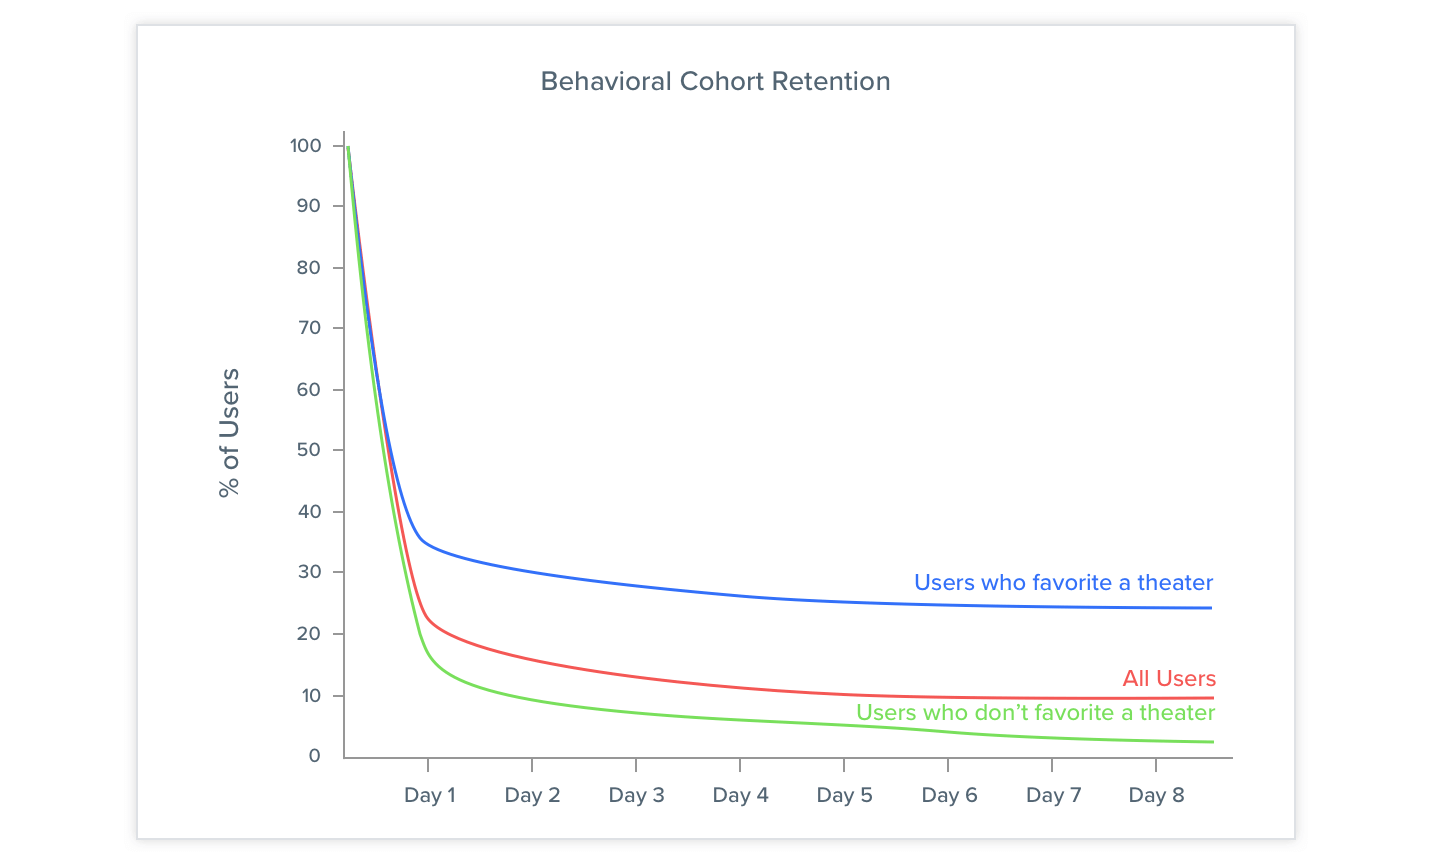
In this case, users who didn’t favorite a theater within the first day churn at 85%, an even higher rate than our baseline of 78%. Getting people to list a favorite theater as fast as possible does appear to entice them to keep using your app.
Where cohort analysis really starts to get fun? All the possible combinations you can create.
What about users who mark a favorite theater and enroll in a rewards program?
Say that when users sign up via Facebook, they’re prompted to post a short movie review to their profile after a showing.
Does that feature improve retention, or does it annoy people?
Let’s look at users who marked a favorite theater and enrolled in a rewards program within the first 7 days.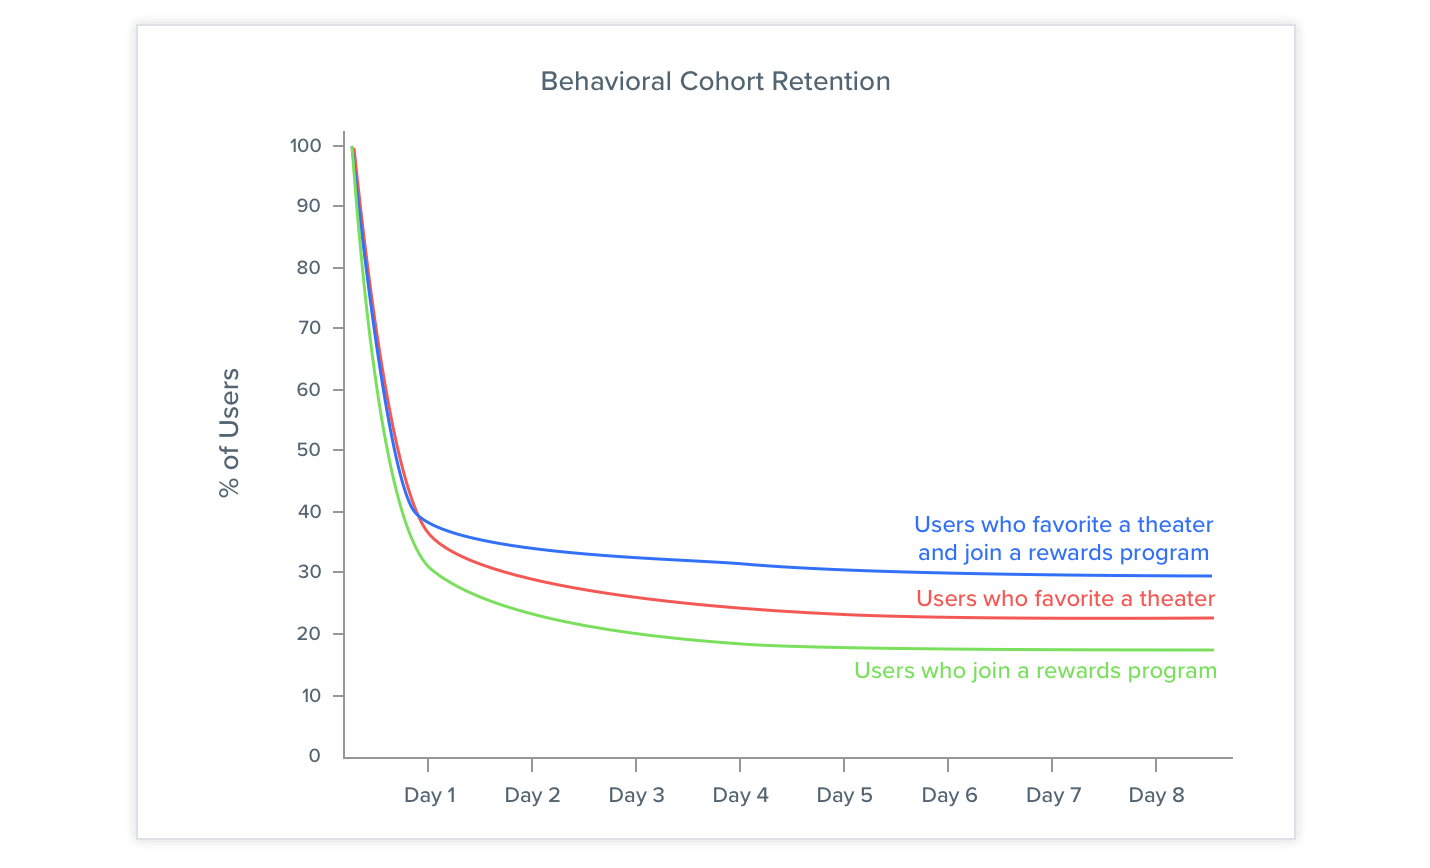
It’s obvious that these users are far more likely to keep using your app. They’re even more likely to stick with your app than users who only favorite a theater.
Now you can start to see the magic formula of actions that help users fall in love with your app.
From there, you can start running precise experiments to really move the needle on user retention.
Things like:
- A/B testing the onboarding or checkout experience
- Experimenting with different calls to action and push notifications
- Tweaking your email campaigns
You’ll see exactly which changes entice users to come back, and know where to further refine.
Get Started Running Your Own Cohort Analysis
The power of cohort analysis is that it not only lets you see exactly which customers leave and when, but also understand why.
This knowledge is the foundation for driving sustainable growth, user engagement, and long-term success for your mobile app.
Read Next:
- Using Cohort Analysis in Marketing
- How to Conduct Cohort Analysis in CleverTap
- How to Compare Cohorts to Identify Trends

See how today’s top brands use CleverTap to drive long-term growth and retention
Shivkumar M 
Head Product Launches, Adoption, & Evangelism.Expert in cross channel marketing strategies & platforms.
Free Customer Engagement Guides
Join our newsletter for actionable tips and proven strategies to grow your business and engage your customers.
