CleverTap recently answered a question on our Quora channel. The developer is a creating a mobile app that will eventually have a web interface. The App is being built off of the API and they have already created a”Web” Back-end (They decided to pivot to a mobile first apporach).
The developer is seeking a comprehensive solution where they can own all their data and can conduct Cohort and Segmentation Analysis. The developer is a big advocate of Lean Analytics and he/she would love to know what is the best solution to fit their development needs.
At CleverTap, we have comprehensive tools packaged in a real-time, neat UI to represent your data (we are merely its custodians!) for segmentation and cohort analysis for a selected date range:
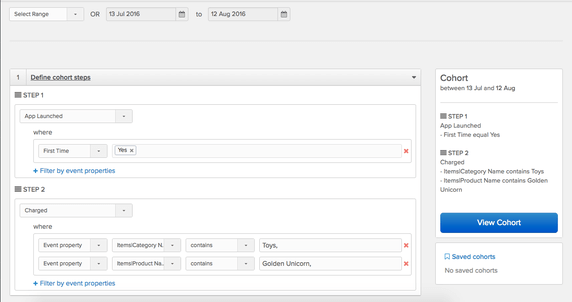
For cohorts, simply add your ‘step 1’ (cohort of users) and ‘step 2’ (how many of the users in the step 1 group came back for step 2 later on)? For each step, you can filter the chosen event by event properties, as shown below for users who “App Launched” for the first time (i.e., app downloaded) who came back to do the “Charged” event for a selected product in a selected category:
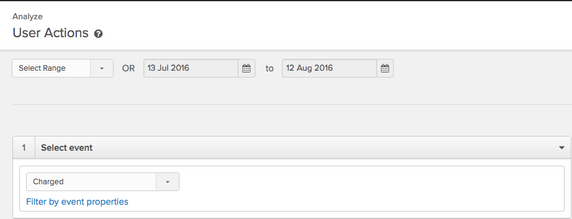
For segmentation analysis, just choose the user event you are interested in analyzing. Again, you can filter by its event properties here:
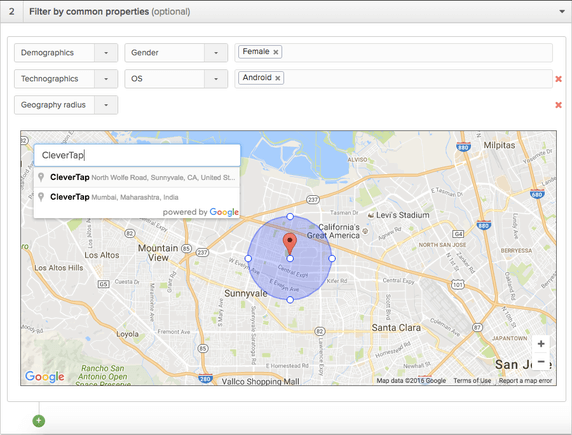
Next, you can choose what user properties you would like to filter based on – we can track user location (IP/device lookup), device information, and UTM attribution automatically. Other information such as demographics, exact geographical radius (hyper-local analysis), and other custom user properties you define can also be used for geographic segmentation:
You can also choose to hone your analysis by further filtering by pre-created or new segments based on user action/inaction, as shown below:
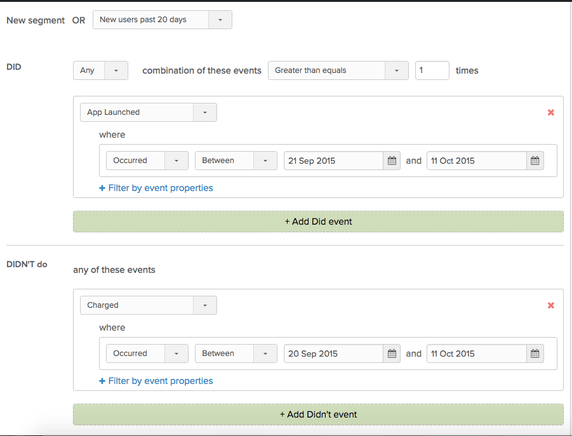
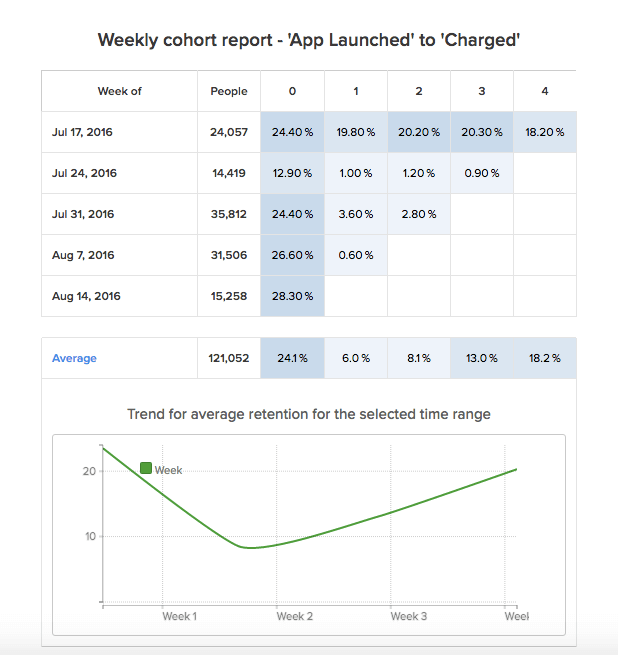
As simple as that. Here is how a sample result of cohort analysis looks (weekly view). You can also select a day-by-day or monthly view. Additionally, you can see how the resulting cohort looks across different user geographies, UTM ad parameters, devices, or user types if needed:
For segmentation analysis, you can see a rich list of histograms representing interesting insights across event and user properties, user sessions, geographies, and devices, such as your top-performing product, the time of day at which users purchase the most, or the ads that lead to maximum user sessions, just to name a few among many:
If you’re curious to see more, you can sign up for an account for free at CleverTap here and play with our demo account to see all of this in action. Once you’re convinced to integrate your app or website with CleverTap, all of your data belongs solely to you.
Shivkumar M 
Head Product Launches, Adoption, & Evangelism.Expert in cross channel marketing strategies & platforms.
Free Customer Engagement Guides
Join our newsletter for actionable tips and proven strategies to grow your business and engage your customers.


