Funnels are among the most powerful analytic tools for Product Managers or Marketeers to understand how users navigate your app.
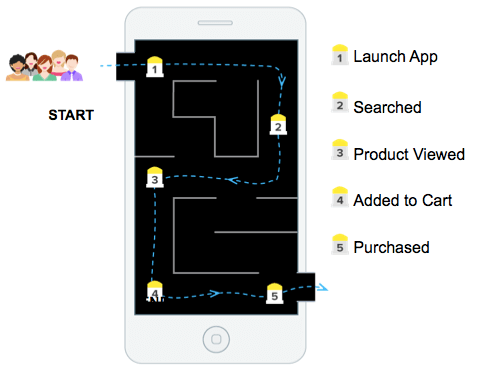
Most apps have a sequence of steps you’d ideally like your users to follow. For example eCommerce apps often push users along a transactional flow from product discovery to purchase.
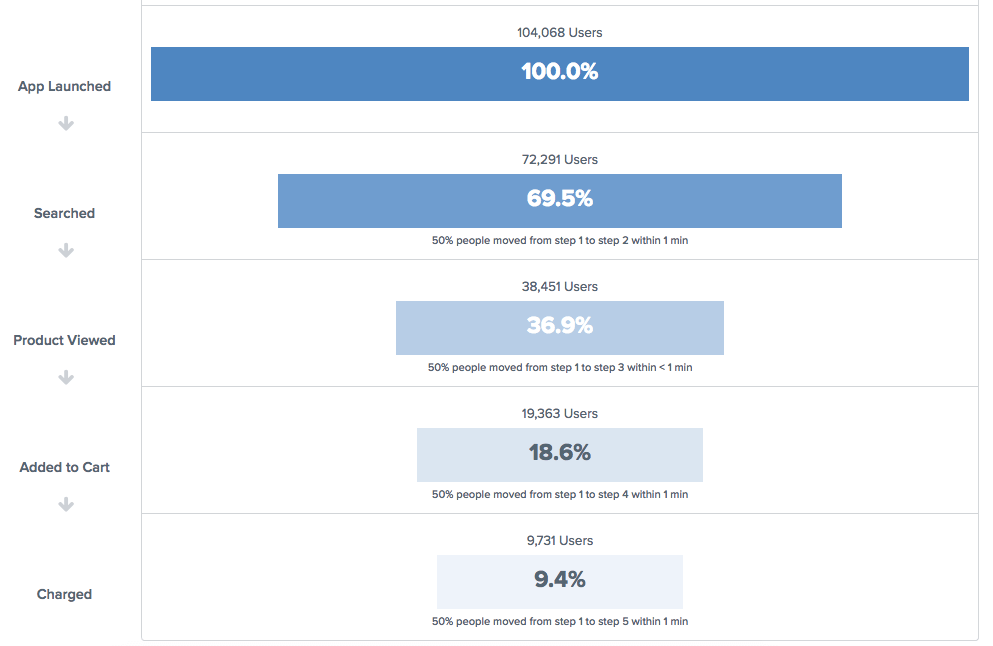
A funnel is a great way to tell how many users are progressing from one step to the next, in that order. So for the user journey above, a funnel view may quickly show that 9700+ users (or about 9.4%) who launched the app ended up purchasing.
Funnels are calculated over a specified date range. The Funnel above was calculated for Jan 1 to Jan 31, 2017 and shows the total number of users who progressed between steps for those dates.
Useful – but only part of the story. What you also want to know is – “How are these conversions trending over time. Are they getting better or worse?”
Here’s where our new Funnel Trends come in.
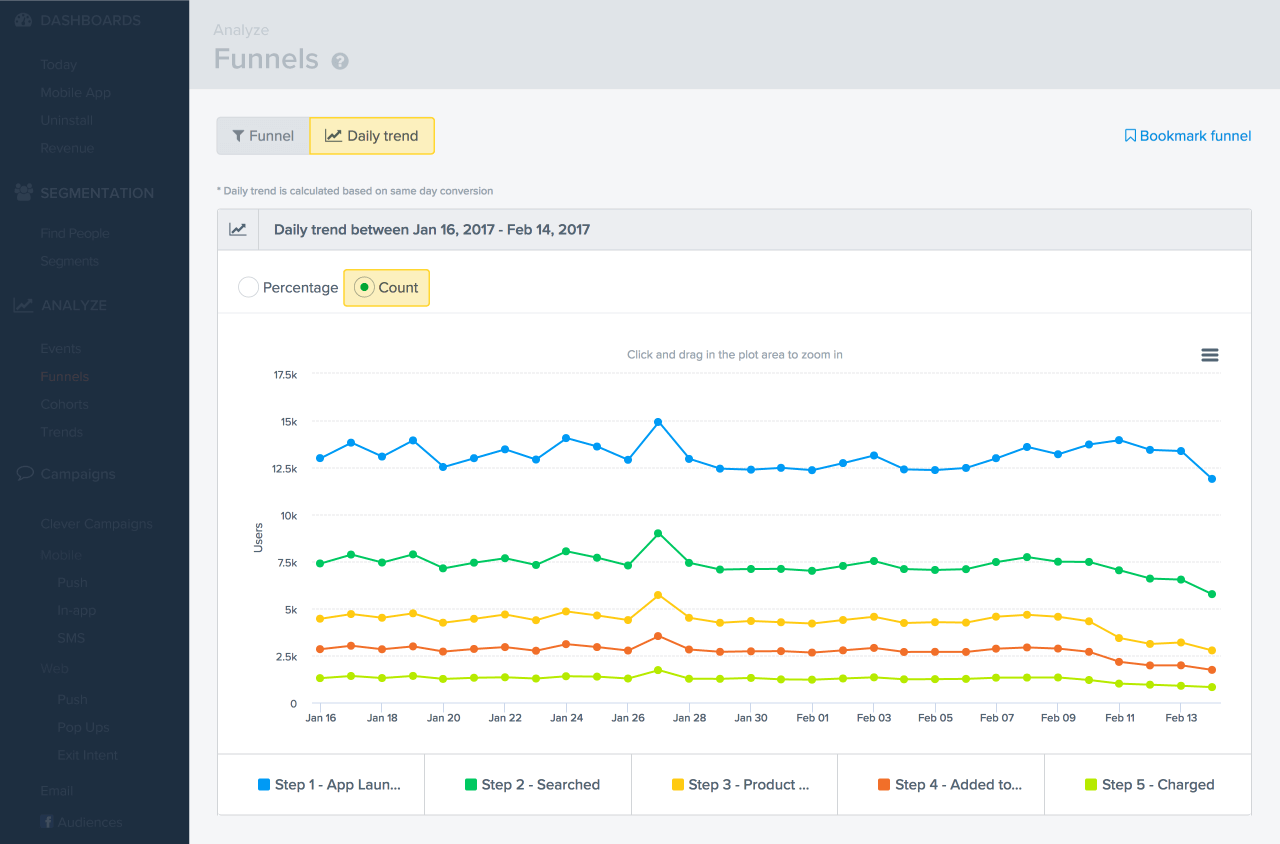
For any Funnel you create in CleverTap, just click on the Trend tab and we automatically provide a Daily Trend View for your Funnel across the selected Date Range.
We trend the absolute users converting for each step in your Funnel, or the percentage of users converting for each step. Trending even works in the comparison mode where you are comparing conversions across the properties of the first event in the funnel.
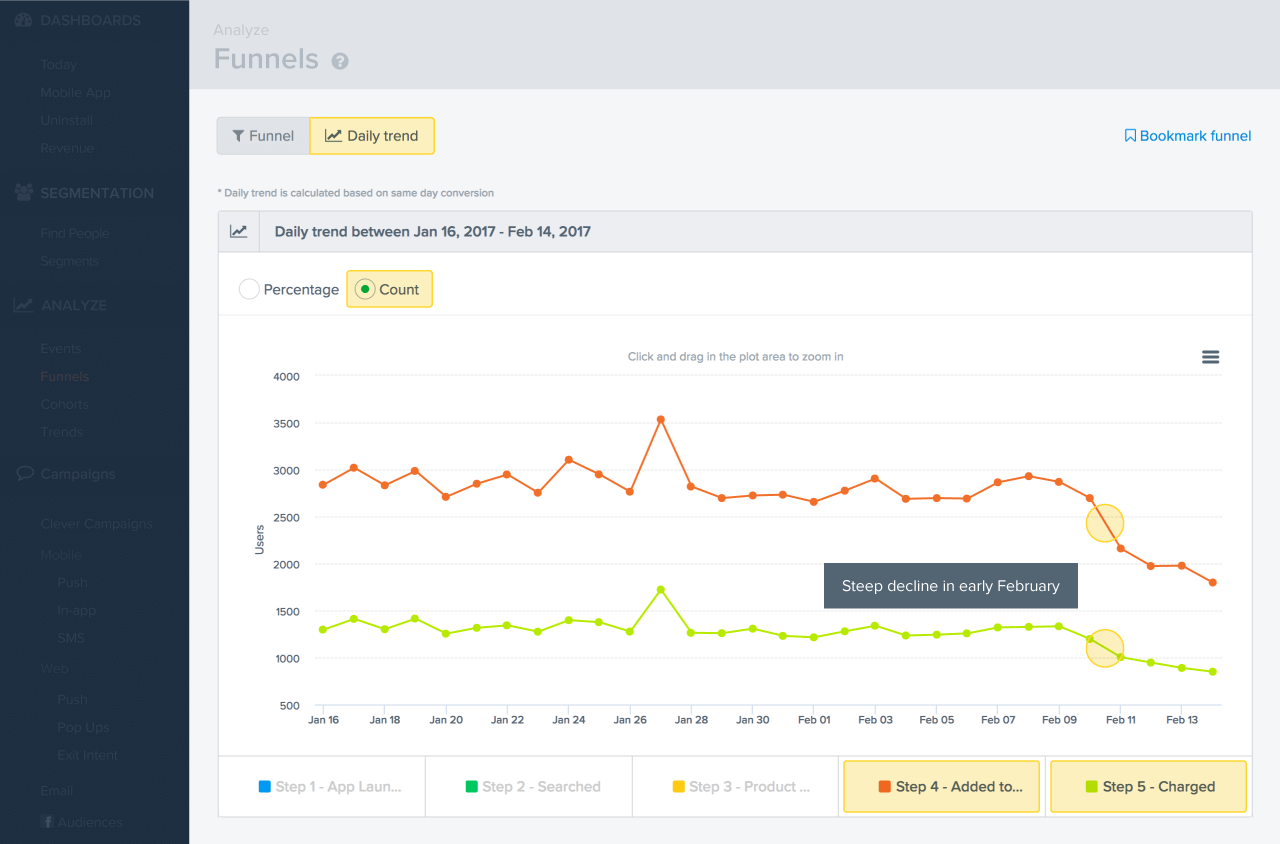
Trend Views allow you to readily pinpoint anomalies. The steep decline in early-February purchases jump right out when looking at a graph.

Uncover Your App Drop-offs and
Increase Conversions with CleverTap
Shivkumar M 
Head Product Launches, Adoption, & Evangelism.Expert in cross channel marketing strategies & platforms.
Free Customer Engagement Guides
Join our newsletter for actionable tips and proven strategies to grow your business and engage your customers.


