


Table of Contents
Categories
Most Popular


Big Data is the buzzword of our current times. A majority of the firms either use or wish to use Big Data on their analytics platform and discover actionable insights from their data. The two key requirements to deliver such insights is 1) the presence of intelligent infrastructure to process the data and 2) the data so collected should be either the population or its representative.
What is Population?
Suppose you are an app selling fashion products. The population set for you would be the entire dataset of users who have visited the app in the past, present or could visit in the future. Even if you collect massive amounts of data every second, part of your population involves the future, which you cannot collect data on. This is the case with most of the businesses collecting data from internal or external sources.
What is a Sample?
Sample is just a subset of the data from the population. The sample data captured on your platform is generally assumed to be representative of the population to make it consumable for meaningful analysis.
Even if you have state-of-the-art infrastructure to store and process the high volume and variety of data, the model performance may not improve with additional data and plateau after a certain point of time. Hence, building your predictive models on such huge datasets may not be beneficial.
Let’s look at the example below that compares datasets.
i) Datasets with 100 observations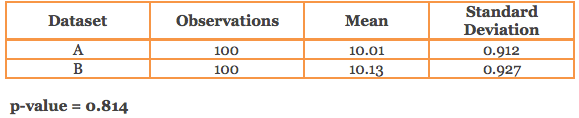
ii) Datasets with 1,000,000 observations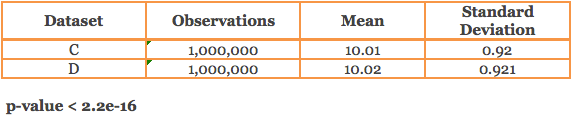
The above datasets have similar mean and standard deviation, but when we compare whether there is a statistical difference between the means of 2 datasets having the same number of observations, we get totally different conclusions. The statistical test (t-test) spits out a p-value based on which we can conclude if the difference in mean is statistically significant or not.
What is p-value?
Assuming you have a hypothesis (in the above case, both the means are the same), the p-value helps you evaluate if the default hypothesis is true. It measures how compatible your data is with your default hypothesis or the chance that you are willing to take in being wrong. For example, a p value of 0.05 and 0.1 means you are willing to let 5% and 10% of your predictions be wrong respectively.
In other words, p-value is the probability of observing the effect by chance in your data, assuming the null hypothesis is true. So, lower the p-value, lower the probability of observing the effect by chance or at random, and higher the probability of rejecting your default or null hypothesis. In practice, depending on your area of study, generally you have cut-off levels like 1% and 5% for p-values below which you could conclude that the effect is not random or by chance and the null hypothesis could be rejected.
It is surprising to know that in (ii) above, the p-value is so small and is statistically significant even if we assume a 1% cut-off for significance. This is despite the fact that the mean and standard deviation is almost the same. Such behavior of p-value is not observed in (i) above.
So why did this happen? Is the mean difference of 0.01 important? Is it because the measurement unit of the observations is unusual or large? Does the study relate to some field like medicine where small differences matter? But generally, you would tend to agree that the observed mean difference is quite small. What made the difference is the large sample size and the small variation or standard deviation seen in the datasets that made the p-value sensitive to the slightest departures from the mean, causing it to be statistically significant.
Now, suppose you think of building a Regression model on large dataset and select the important variables based on the p-value. The model might suffer the same issue faced above with p-value. The variables with spurious correlation may get selected due to low p-values.
Sampling
Picture yourself cooking your favorite soup. Do you taste the whole soup to check the flavor or just a spoonful? If you taste a spoonful, you are sampling.
Can one benefit from sampling? The answer is YES, if done the right way. The right sample will not only be able to capture the pattern in the data but also be computationally inexpensive to analyze compared to a large dataset.
A good sample could make your Big Data smart. A good sample should be representative of the population, objective-driven, flexible on the size depending on the circumstances, generated with right unit – i.e. if your study is to measure job satisfaction of bank employees, the universe should comprise of only bank employees, and generated using the right sampling techniques.
Sampling Techniques
Assume that you are the marketing manager of an ecommerce app selling a variety of products and you need to run a campaign for a lingerie brand. At the most you could reach 10% of your customer base considering the budget in hand. Would you be randomly selecting your target audience or would you be randomly selecting the target audience from the female customers? Hence, the right sampling technique is one of the key ingredients to generate a good sample.
Sampling techniques broadly fall into 2 main classes, Probability and Non-Probability.
Probability sampling is one in which every element of the population has a chance or a probability (greater than zero) of selection, and this probability can be determined.
Non-Probability sampling is one where some elements of the population have no chance of selection or where the selection probability cannot be accurately determined.
For example: Suppose you are standing in front of your wardrobe and you need to select a dress from 20 different dresses based on either of the 2 rules:
Rule A: Select any one from the 20 dresses OR
Rule B: Select the 3rd dress to your right
Rule A is akin to Probability sampling since the chance of any one dress getting selected is 1/20. Rule B is akin to Non-Probability sampling since 19 dresses have no chance of selection.
Probability Sampling includes
- Simple Random Sampling
- Systematic Sampling
- Cluster Sampling
- Stratified Sampling
- Multistage Sampling
- Multiphase Sampling
Non-Probability Sampling includes
- Accidental/Convenience Sampling
- Purposive/Judgemental Sampling
- Quota Sampling
Conclusion
Analyzing Big Data without paying attention to its characteristics and objective could lead to dumb results. The panacea for this bane may lie in correct and effective sampling, which will transform your Big Data to Smart Data.
In the next part, we will discuss few of the relevant and popular sampling techniques listed above in detail.
Jacob Joseph 
Heads Data Science.Expert in AI, Data & Analytics and awarded 40 under 40 Data Scientists in India.
Free Customer Engagement Guides
Join our newsletter for actionable tips and proven strategies to grow your business and engage your customers.