


Table of Contents
Categories
Most Popular

If you’re looking to better understand your customers, the truth is in the numbers. We break down 14 key customer engagement metrics that turn data into actionable insights, empowering smarter decisions and building stronger customer relationships.
If you are looking to build solid and lasting relationships with your customers, tracking customer engagement metrics can be a game-changing addition to your marketing strategy.
A study by the Aberdeen Group found that companies that actively track and manage their customer engagement see a 63% higher customer retention rate, and a McKinsey study found that companies that use engagement metrics to personalize their outreach saw a 20% sales increase. Keeping a sharp eye on how customers interact with your brand across various channels can unlock valuable insights that will help you craft innovative marketing strategies and more personalized customer journeys. By tracking key metrics and learning from real-world customer engagement examples, brands can craft strategies that drive lasting relationships and measurable results.
In this blog, we’ll examine some of the key benefits of tracking customer engagement metrics and cover the 14 most commonly tracked metrics so you can see just how impactful this practice can be. Whether you’re looking to refine your current approach or start fresh, understanding these metrics is crucial for making the most of your customer relationships.
Benefits of Tracking Customer Engagement Metrics
Tracking customer engagement metrics involves measuring how customers interact with your brand across various channels. This can yield valuable insights that can shape your marketing strategies and campaigns and build stronger customer relationships.
One major advantage of tracking these metrics is the ability to personalize experiences. McKinsey found that 71% of consumers expect companies to deliver personalized experiences, and when the brand doesn’t, 76% get frustrated and look elsewhere for what they need. Once you understand your customer’s behaviors and preferences, you can tailor your communications, offers, and products to meet their specific needs. Suddenly, your brand comes across as more relevant and relatable. Personalization leads to stronger relationships with your customers, which grows organically into longer-term loyalty.
Customer engagement metrics also help you run your business more efficiently. They let you know where your marketing spend is paying off and where you might be wasting money and resources. For example, if your email campaigns have high open rates but low click-through rates, it’s a signal that you may need to adjust your content to hold your customers’ interest better.
Another critical benefit is risk management. Metrics like customer churn rate and customer effort score can alert you to potential issues before they escalate. By catching these red flags early, you can take proactive measures to retain customers and reduce turnover.
Lastly, keeping an eye on customer engagement metrics gives you a clearer picture of long-term trends. Are your customers getting more loyal over time? Do particular channels drive more conversions? This kind of information helps you make informed decisions and allows you to adjust your approach accordingly. Keep in mind that tracking engagement isn’t just about numbers; it’s about using data to foster more profound, more meaningful connections with your users.
14 Customer Engagement Metrics
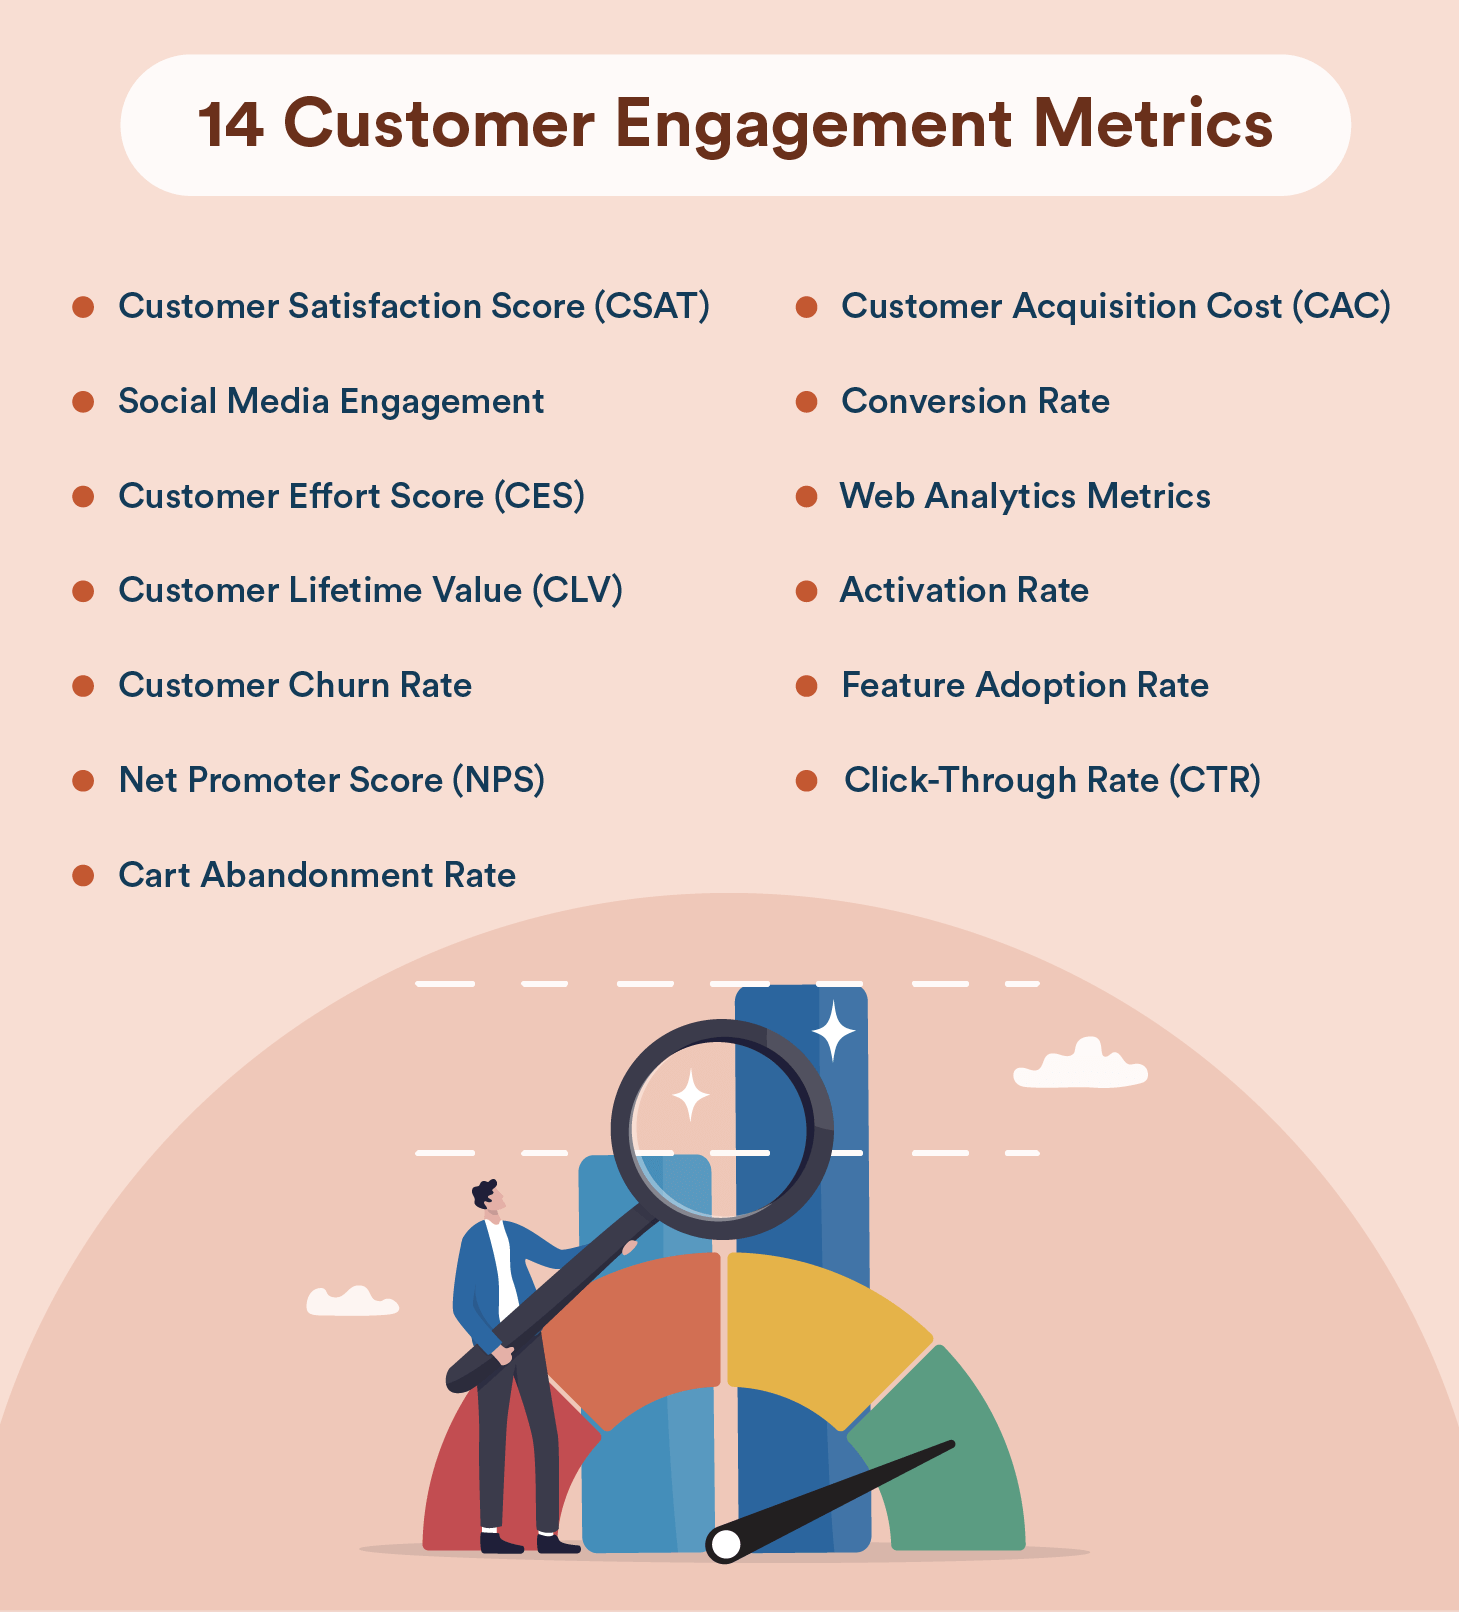
There are well over 30 customer engagement metrics you can track, but we’ll focus on the 14 most common foundational metrics that businesses rely on. The size of your company and the kind of goals you set will determine which metrics make the most sense. If you’re just starting out, you might only track 5-7 of these markers and add others as your customer base and business goals evolve.
1. Customer Satisfaction Score (CSAT)
The Customer Satisfaction Score (CSAT) lets you know how satisfied customers are with a particular interaction or overall experience. It’s usually gathered through a simple survey question like, “How satisfied were you with your experience?” Customers rate their satisfaction on a scale, typically from 1 to 5.
To calculate CSAT:
CSAT = (Number of Satisfied Customers / Total Number of Responses) x 100
So, if 80 out of 100 customers rate their experience as satisfactory (4 or 5 on the scale), your CSAT score would be 80%. CSAT is a quick and easy way to gauge customer satisfaction and identify areas for improvement.
2. Social Media Engagement
Social Media Engagement gauges how effectively your brand interacts with its audience on platforms like Facebook, Instagram, Twitter, and LinkedIn. Key metrics to look at include likes, shares, comments, and follower growth. A high level of engagement means your content is hitting its mark with your audience and encouraging interaction.
To calculate basic engagement rates:
Engagement Rate = (Total Engagements / Total Followers) x 100
If a post receives 600 likes, comments, and shares combined, and you have 10,000 followers, the engagement rate would be 6%. Social media engagement helps build brand awareness, foster community, and drive traffic to your website. Consistently posting relevant, high-quality content and interacting with your audience can boost your engagement levels.
3. Customer Effort Score (CES)
Customer Effort Score (CES) measures how easy it is for customers to interact with your company, whether it’s making a purchase, resolving an issue, or finding information. It’s typically gathered by asking customers to rate the ease of their experience on a scale from “very difficult” to “very easy.”
CES Formula:
CES = (Sum of All Scores) / (Total Number of Responses)
If your CES survey results in a total score of 400 from 100 respondents, your CES would be 4. A low CES shows that your process is smooth and user-friendly, while a higher CES suggests your customers are encountering friction along the way. Keep your CES low to maximize customer satisfaction and loyalty.
4. Customer Lifetime Value (CLV)
Customer Lifetime Value (CLV) is a vital metric that gives you an idea of the total revenue a single customer will likely generate throughout their entire relationship with your brand. It’s not just a measure of how much they spend; it’s a way to assess how valuable that customer is over the long term. Tracking CLV helps businesses to strategize better by focusing on keeping high-value customers and channeling their marketing spend where it will matter most.
The formula to calculate CLV is:
CLV = (Average Purchase Value) x (Average Purchase Frequency Rate) x (Customer Lifespan)
A customer who typically spends $30 per purchase, makes around ten purchases per year, and stays with you for five years would have a CLV of $1,500. If you can increase any of those factors, whether it’s more frequent purchases or retaining customers for longer, you can significantly boost your CLV.
5. Customer Churn Rate
Customer Churn Rate is one of the most important metrics to track, as it lets you know the percentage of customers who stop doing business with you over a specific period, directly impacting your revenue and growth. A high churn rate reflects a mass exodus of your customers leaving, which could signal problems with product quality, customer service, or engagement tactics.
Use this formula to calculate your Customer Churn Rate:
Churn Rate = (Number of Customers Lost during a Period) / (Number of Customers at the Start of the Period) x 100
Keeping an eye on this metric helps you identify potential problems early on and take steps to retain more customers, like improving your product or enhancing customer support.
6. Net Promoter Score (NPS)
Net Promoter Score (NPS) is a popular metric that measures customer loyalty by asking one key question: “On a scale of 0 to 10, how likely are you to recommend our product or service to others?” Based on their responses, customers are categorized into three groups: Promoters (9-10), Passives (7-8), and Detractors (0-6).
To calculate NPS:
NPS = % of Promoters – % of Detractors
If 75% of your customers are happy to recommend your brand and 30% would decline to recommend it, your NPS would be 45. This score gives you a good snapshot of customer sentiment and the overall health of your customer relationships. A high NPS means your customers are mostly satisfied and loyal, and a low NPS suggests that some retooling is needed.
7. Cart Abandonment Rate
Cart Abandonment Rate is an indispensable metric for an e-commerce business. It measures the percentage of shoppers who add items to their cart but leave without making the purchase. A high cart abandonment rate can mean problems with your check-out process, pricing, or shipping costs.
Cart Abandonment Rate Formula:
Cart Abandonment Rate = (Number of Completed Transactions) / (Number of Shopping Carts Created) x 100
Remember that customers often abandon carts for reasons other than a complicated or poor checkout experience. A simple distraction like an incoming call or email can easily make a user forget a purchase they were making. This is where tactics like reminder emails or offering additional discounts can provide helpful nudges to users and help lower cart abandonment.
8. Email Engagement Metrics
Email engagement metrics are essential for understanding how well your email campaigns are performing. These metrics include open, click-through, bounce, and unsubscribe rates. Each of these provides insights into different aspects of your email strategy.
- Open Rate: The percentage of recipients who open your email
- Click-Through Rate (CTR): The percentage of recipients who click on a link within your email
- Bounce Rate: The percentage of emails that could not be delivered
- Unsubscribe Rate: The percentage of recipients who opt out of your mailing list.
Monitoring these metrics helps you refine your email marketing strategy. A low open rate might mean that your subject lines need work, while a low CTR suggests that the email content or call-to-action isn’t compelling enough.
9. Customer Acquisition Cost (CAC)
Customer Acquisition Cost (CAC) is the total cost of acquiring a new customer, including all marketing and sales expenses. This metric provides a window into how much you’re spending to grow your customer base and whether that investment is sustainable.
To calculate CAC:
CAC = (Total Marketing and Sales Expenses) / (Number of New Customers Acquired)
If your marketing and sales spend in a month was $17,500, and you acquired 70 new customers, your CAC would be $250. Keeping your CAC in check is critical to staying profitable, especially compared to your CLV. Ideally, your CLV should be significantly higher than your CAC.
10. Conversion Rate
Conversion Rate reflects the percentage of users who take a desired action, such as making a purchase, signing up for a newsletter, or downloading an app. There is a direct correlation between your conversion rate and the effectiveness of your marketing strategy.
Conversion Rate is calculated with the following formula:
Conversion Rate = (Number of Conversions / Number of Visitors) x 100
A higher conversion rate shows that your engagement strategies are paying off, successfully driving customers to take action. Optimizing your website, calls-to-action, and personalized content are all proven ways to increase your conversion rate.
11. Web Analytics Metrics
Web Analytics Metrics are a broad category that includes page views, bounce rate, average session duration, and unique visitors. These metrics provide insights into how users interact with your site and can help you zero in on areas for improvement.
- Page Views: The total number of pages viewed by visitors
- Bounce Rate: The percentage of visitors leaving your site after viewing only one page
- Average Session Duration: The average time a visitor spends on your site
- Unique Visitors: The number of distinct individuals visiting your site
Web analytics help you understand user behavior, optimize your site’s performance, and enhance the user experience, which in turn can lead to higher engagement and conversion rates.
12. Activation Rate
Activation Rate measures the percentage of users who take a key action that indicates they’ve experienced the value of your product or service. This metric is particularly important for SaaS companies and apps because it reflects the effectiveness of your onboarding process.
To calculate the Activation Rate:
Activation Rate = (Number of Users Who Complete the Key Action / Total Number of Users) x 100
If 2,000 users download your fitness app and 400 complete a crucial step like setting up their profile or doing a workout, your activation rate is 20%. A higher activation rate suggests that your onboarding process is effective; users can quickly understand and gain value from your product.
13. Feature Adoption Rate
Feature Adoption Rate measures how many users are utilizing a specific feature of your product or service. This metric is useful for understanding which features are most valuable to your customers and which might need more promotion or improvement.
Feature Adoption Rate Formula:
Feature Adoption Rate = (Number of Users Who Use the Feature / Total Number of Users) x 100
If only 350 of your 7000 users use a cutting-edge new feature you’ve added to your app or website, the feature adoption rate would be 5%. A low feature adoption rate indicates that your users are either unaware of the feature or that the user experience for the feature is poor and could use some tweaking. Tracking this metric helps you identify which features are most popular and which need to be retooled.
14. Click-Through Rate (CTR)
Click-Through Rate (CTR) measures the percentage of people who click on an ad, an email link, or a call-to-action button out of the total number of people who view it. CTR is a key indicator of your content’s effectiveness in driving engagement.
Use this formula to determine CTR:
CTR = (Number of Clicks / Number of Impressions) x 100
A high CTR shows that your messaging is compelling and relevant to your audience, while a low CTR might suggest that you need to refine your copy, design, or targeting strategy.
Which Customer Engagement Metrics Should You Track?
In this guide, we focused on 14 key customer engagement metrics, but it’s important to note that businesses can use many more metrics to gauge their success. The specific metrics a company tracks will vary based on size, industry, goals, and customer base. Smaller brands might focus on metrics like conversion rate and customer satisfaction. At the same time, larger companies might track more complex metrics such as Customer Lifetime Value (CLV) and Net Promoter Score (NPS) to gain deeper insights into their customer relationships.
Whatever metrics you track, CleverTap can dramatically simplify the process. CleverTap centralizes customer data and provides real-time insights and automated reporting to help you easily monitor and analyze your metrics. With features like behavioral analytics, personalized messaging, and multi-channel tracking, CleverTap makes tracking engagement easier and helps you optimize your strategies for better results. Visit our Demo Center to see how CleverTap can help you keep track of the metrics that matter most to your brand.
Agnishwar Banerjee 
Leads content and digital marketing.Expert in SaaS sales, marketing and GTM strategies.
Free Customer Engagement Guides
Join our newsletter for actionable tips and proven strategies to grow your business and engage your customers.
