


Table of Contents
Categories
Most Popular


Have you ever been in a productive meeting that came to a screeching halt because you were digging into multiple reports or dashboards to find that one metric?
Save yourself from the tedium of digging for that data in order to collaborate with your team. With CleverTap’s Custom Dashboards, you can now create the dashboards you need with all the metrics that matter most to you.
Why Custom Dashboards are Useful
Consider the case of multiple stakeholders having different KPIs to track. A VP of Marketing will need a high level overview of overall marketing performance, whereas a campaign manager may need to zoom in to see campaign level customer engagement metrics.
With Custom Dashboards, we bring you the power of creating your own analytics dashboards inside CleverTap. All you have to do is pick the necessary metrics and pin the visualization to your Custom Dashboard.
You can create multiple dashboards – both private and public – to consolidate critical data points that measure the performance of your app. These also give you the ability to share metrics so you can collaborate seamlessly with your team.
Visualize Crucial KPIs so You Can Do More
CleverTap’s Custom Dashboards are a powerful reporting tool to help you easily organize, share, and monitor all the crucial metrics for your app. CleverTap’s simple drag-and-drop interface makes it easy to pin, clone, and rearrange any report.
- Get a snapshot of the metrics important to you by bringing them into a single dashboard. Forget searching through a list of campaigns/segments/analytics reports to view key metrics.
- Save yourself from the tedium of digging into multiple reports in order to collaborate during team meetings.
- Quickly compare metrics in a single view and prioritize engagement metrics that affect your marketing strategy.
- Spot trends and patterns in your data by changing date range directly within the Custom Dashboard screen.
- Define who sees the dashboards you create by granting access to everyone in your organization or limiting it to just yourself. Moreover, drive collaboration within your team and beyond by sharing dashboards so everyone gets on the same page.
Custom Dashboard Showcase
Using Custom Dashboards you can keep your reports organized by geography, user segments, top-line business performance, or app user engagement.
For instance: you can set up a geography-specific dashboard to save reports by region, or an app activity dashboard for marketers to track activity of specific promotional campaigns and an app performance dashboard for management to monitor the overall health of the app.
Here are a few examples of how customers make the most of our custom dashboards:
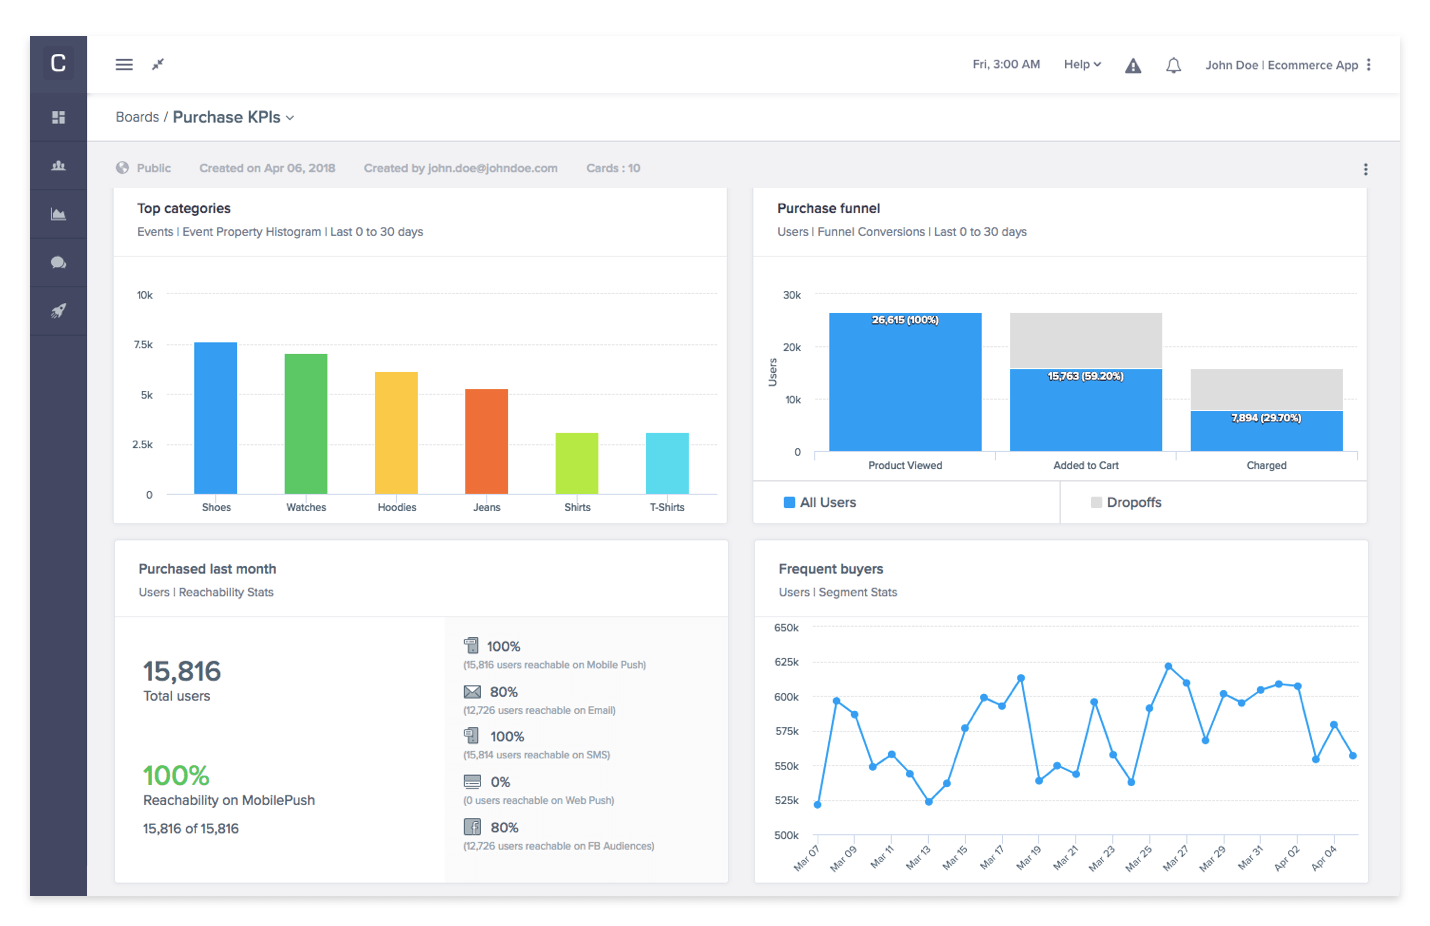
- Ecommerce: Monitor those sales numbers
In e-commerce, business transactions reflect directly on the top line. Hence, it’s important for e-commerce app marketers to track key metrics such as the number of transactions, average order value, and orders by category. Take for instance the dashboard below, intended to be used by Marketing Head of an e-commerce app. A quick glance gives a sense of the category performance, dropoffs in the purchase funnel, count of users who purchased at least once, and count of frequent buyers.
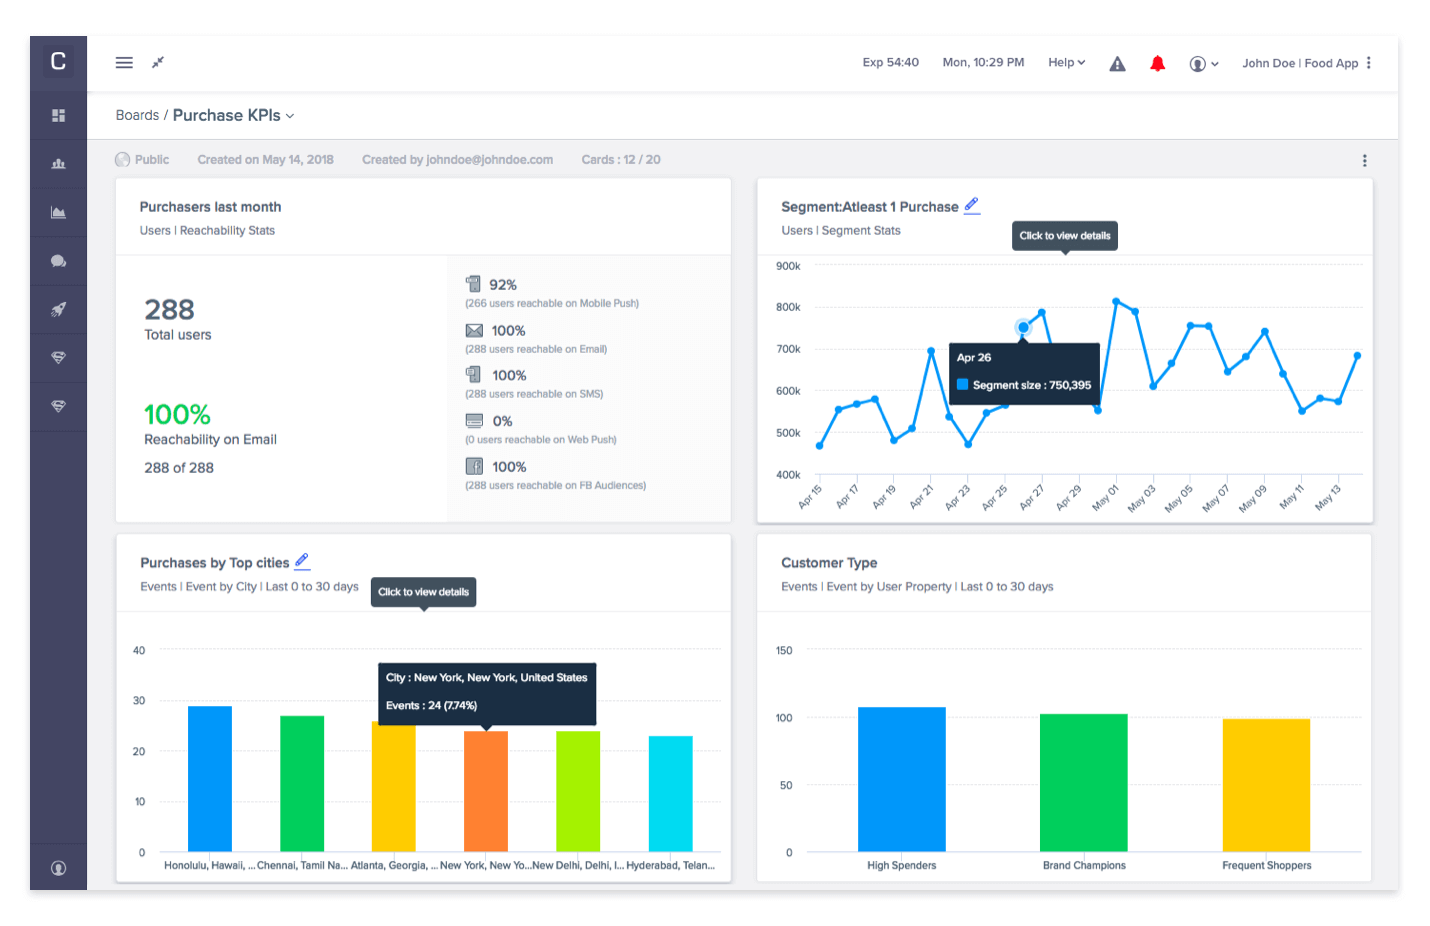
- Food Tech: Segment users on purchase behavior
Mobile apps in the food category have seen tremendous adoption, bringing conventional restaurant menus to our mobile screens. From the viewpoint of a food tech app marketer, comparing segments of users is critical for running targeted promotions that propel growth. For instance, keeping a close eye on different segments of users, such as high spenders, frequent shoppers, brand champions, and split of purchases by cities. - Travel: Track booking abandonment
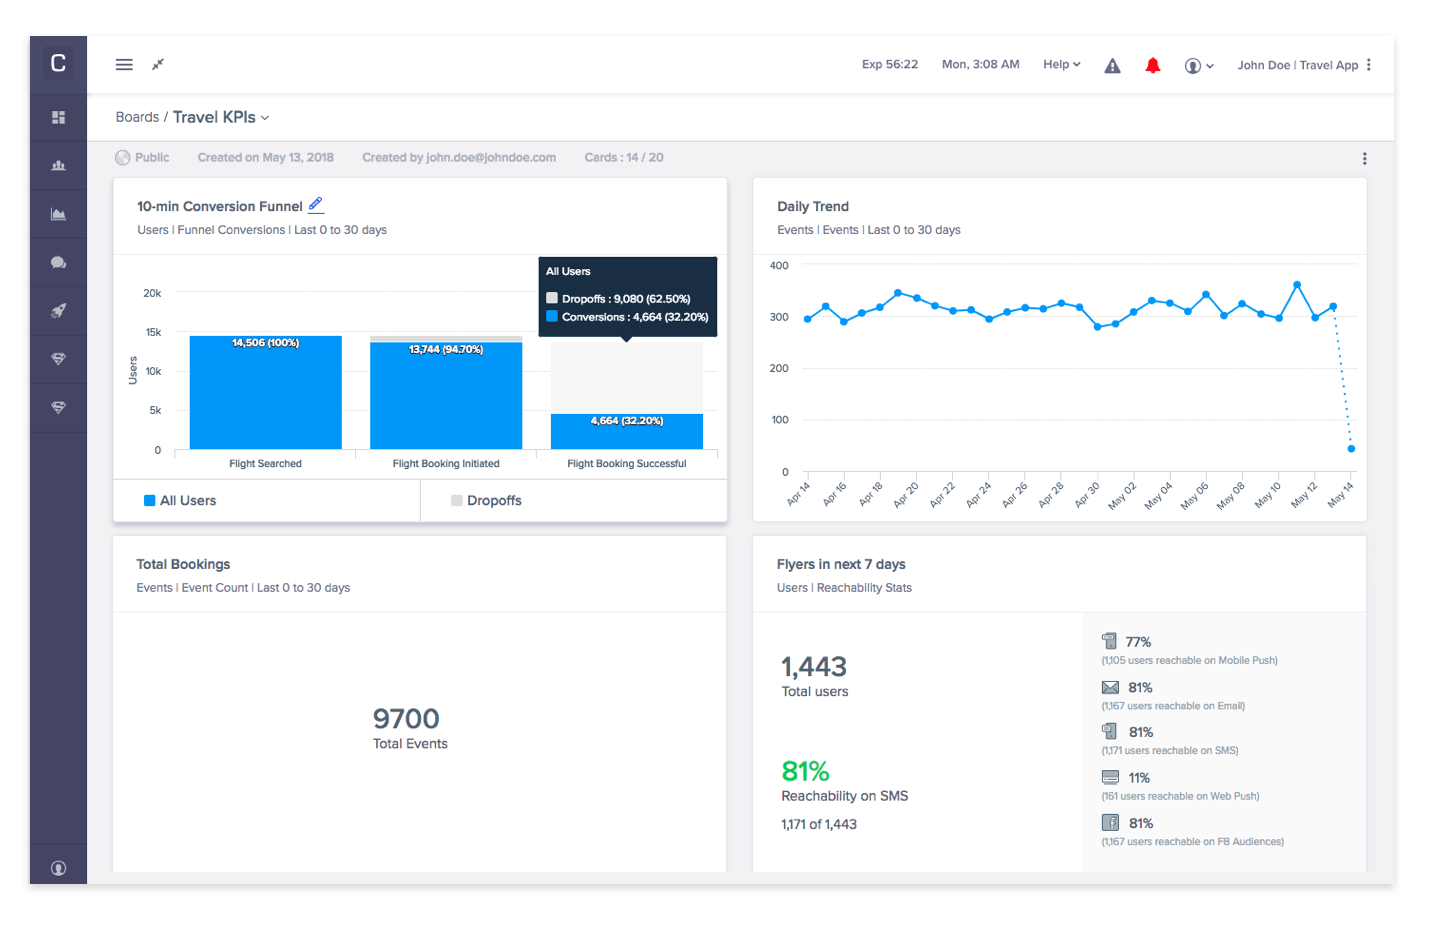
Travel apps face a major challenge with booking abandonment – when users search for flights, add them to the shopping cart, but don’t end up booking. A dashboard for tracking the abandonment rate and similar metrics is a must for any travel app marketer. Take a look at the dashboard for Travel App Marketer, tracking the live metrics starting with conversion funnel for booking abandonment, the daily trend of bookings, total bookings, and flyers in next 7 days.
What Do You Think of Custom Dashboards?
If you’re already a CleverTap user, try Custom Dashboards in your account. If not, sign up for an account to give the feature a spin.
Check out this video on how to use CleverTap’s Custom Dashboard:
Moreover, let us know your thoughts on the feature by hitting the comments below.
The Intelligent Mobile Marketing Platform
Subharun Mukherjee 
Heads Cross-Functional Marketing.Expert in SaaS Product Marketing, CX & GTM strategies.
Free Customer Engagement Guides
Join our newsletter for actionable tips and proven strategies to grow your business and engage your customers.
