The average US smartphone user gets 46 push notifications every day,1 and that number is only growing. With users being bombarded by more and more messages, how can mobile marketers stand out on their crowded lock screens?
To find out what works when engaging mobile app users — and what doesn’t — our data science team took a magnifying glass to successful push campaigns.
We analyzed over 40 billion push notifications to learn how mobile marketers can build the perfect messaging campaign.
Want to skip right to the goods? Download the entire push notification report now.
Understanding Current Open Rates
How does your push notification CTR compare with other apps in your vertical? Evaluate your campaign performance with the latest benchmark open rates, broken down by platform and vertical.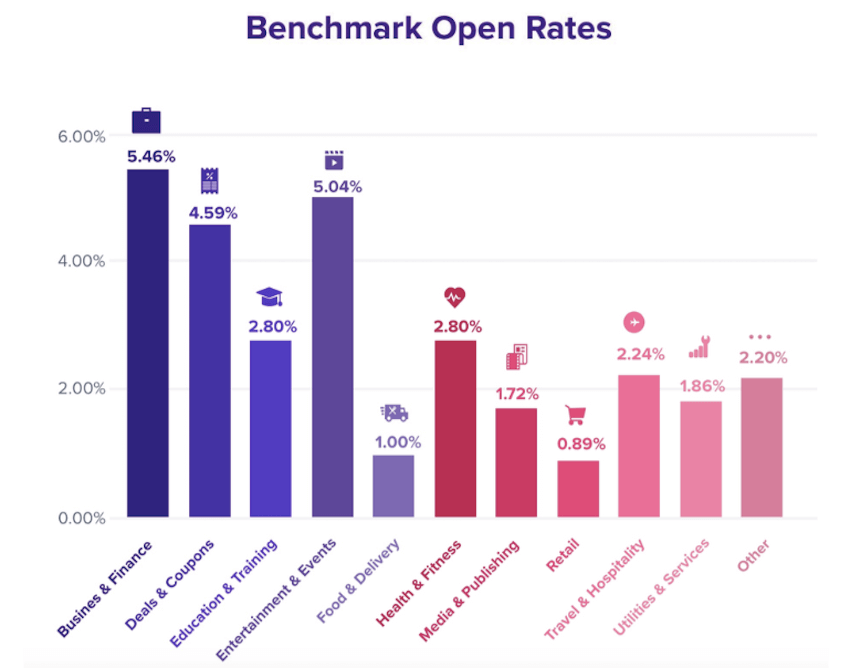
Business & Finance and Entertainment & Events apps see the highest engagement, while Food & Delivery and Retail apps typically see the lowest push notification open rates. This may be due to the fact that users for these apps get utility from the push notification content itself without having to click. Think: order status or delivery updates. 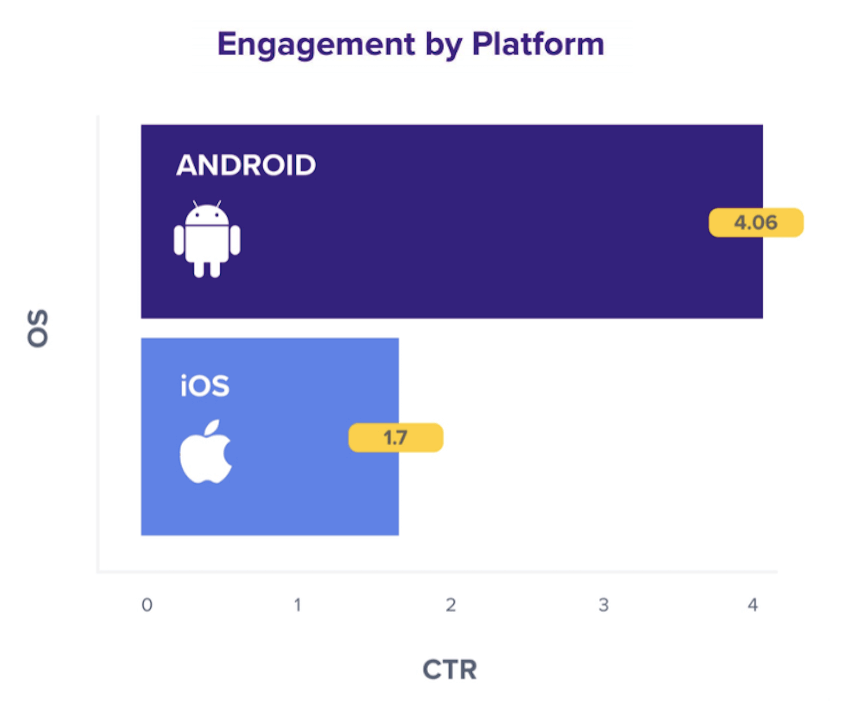
Android sees much higher push engagement than iOS. Push notifications stay on the Android lock screen until a user dismisses them, whereas, iOS push notifications disappear as soon as a user unlocks their phone.
Explore More: 45 Ready-to-use Push Notification Templates!
Writing the Perfect Push
Copywriting an effective push message always boils down to this: understanding your users. Who they are, and what they want from your app. Writing for your specific user base means taking general push notification best practices with a grain of salt.
That said, we found three factors that consistently bump up engagement rates across the board: adding personalization, using emojis, and including a few key power words.
Personalization
Addressing recipients by name, referencing their location, or noting their purchase/content history has a significant impact on push notification retention and engagement. Even basic personalization results in a nearly 10% increase in open rates.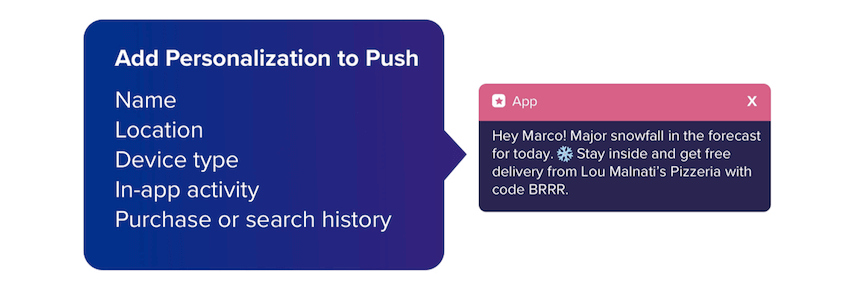
Emojis
Push notifications that include emojis see a 70% increase in CTRs. Based on our analysis, the 25 emojis in the graphic below are associated with the highest CTRs across all app verticals. 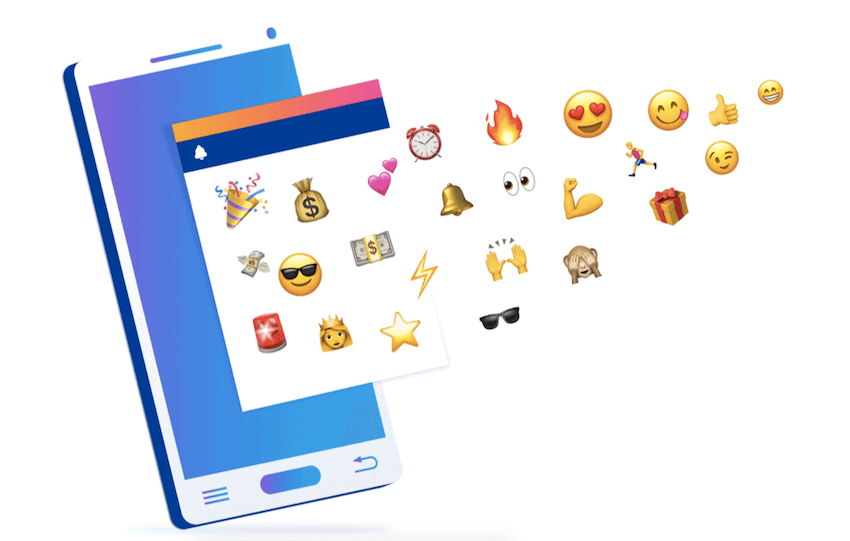
Power Words
Writing creative push notifications isn’t easy. You need to be innovative, entertaining, and persuasive — not to mention concise. Which words should you use in your messages? We found that these push notification power words and phrases were the most effective in prompting users to click. 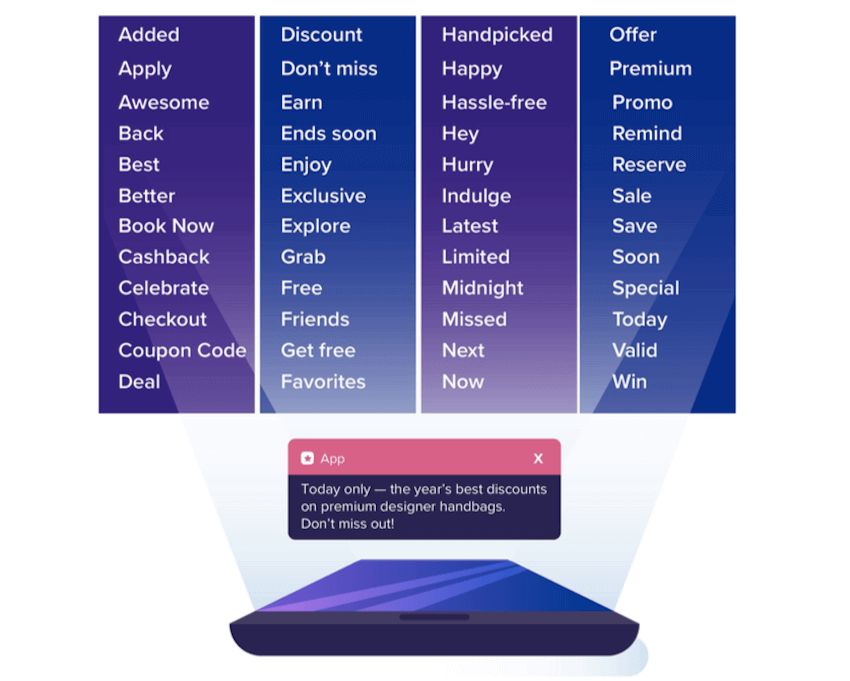
Explore More: What is the Push Notification Character Limit?
Getting the Timing Right
Even a perfectly written push notification won’t be opened if it’s sent at the wrong time. So, finding the best time to send push notifications is essential.
Our analysis identifies peak engagement times between 7-8 a.m., when users are just starting their days or are on their daily commute. Another lift from 10 a.m.-2 p.m. shows that lunch and early afternoon is also a high time for engagement.
Unsurprisingly, 1-7 a.m. sees the lowest engagement rates, showing that most users don’t want to be disturbed from their beauty sleep. However, a spike between midnight – 1 a.m. shows that night owl users are checking their phones before bed.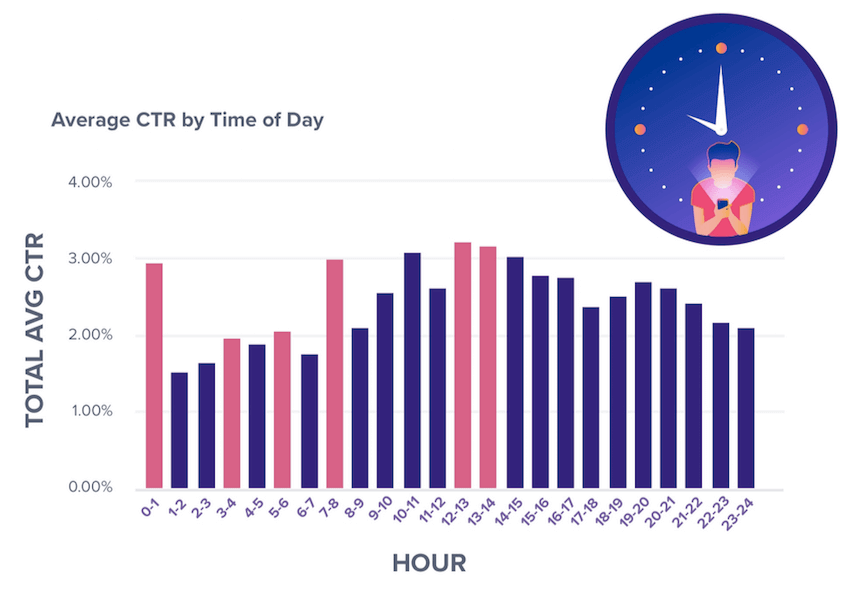
Read More: Top push notification platforms to boost user engagement!
Get the Complete Push Notification Report
Our data science team came up with a lot more info and recommendations. For more insights, including specific best practices for 10+ app verticals, download the full report:
See how today’s top brands use CleverTap to drive long-term growth and retention
Shivkumar M 
Head Product Launches, Adoption, & Evangelism.Expert in cross channel marketing strategies & platforms.
Free Customer Engagement Guides
Join our newsletter for actionable tips and proven strategies to grow your business and engage your customers.


