


Table of Contents
Categories
Most Popular


Increased technology has brought mobile payment methods to the forefront of many businesses and consumers, as evidenced by a 50% drop in cash use in the United States from 2010 to 2020.*
The U.S. isn’t the only nation to see a steep decline in cash payments. Sweden and the Netherlands have both also seen a drastic dip in cash use, with less than 20% of transactions involving traditional paper money.
The COVID-19 pandemic is another factor in the increased usage of mobile payments. In 2020, sales at businesses capable of accepting Apple Pay increased $6 trillion from the previous year.*
In this post, we’ll take a closer look at various mobile payment statistics in the United States and around the globe. To see the statistics compiled visually, jump to the infographic.
Table of contents:
- Mobile Payment Methods
- North American Mobile Payment Usage Statistics
- Global Mobile Payment Statistics
- Mobile Payment Growth
- Mobile Payment Security
Mobile Payment Methods
Coca-cola was the first company to implement mobile payments in 1997*. This technology has since evolved into what we know today, with mobile payment options such as Apple Pay and Venmo. Other fintech apps include:
- Starbucks
- Paypal
- Samsung Pay
- Google Wallet
- Afterpay
- Affirm
- Facebook Pay
- Zelle
While each of these apps work differently, they all serve one purpose: to enable cashless, touchless payments. There are also obvious differences in fan favorites, as some of these apps are far above others when it comes to number of users.
Mobile Payment Usage Statistics
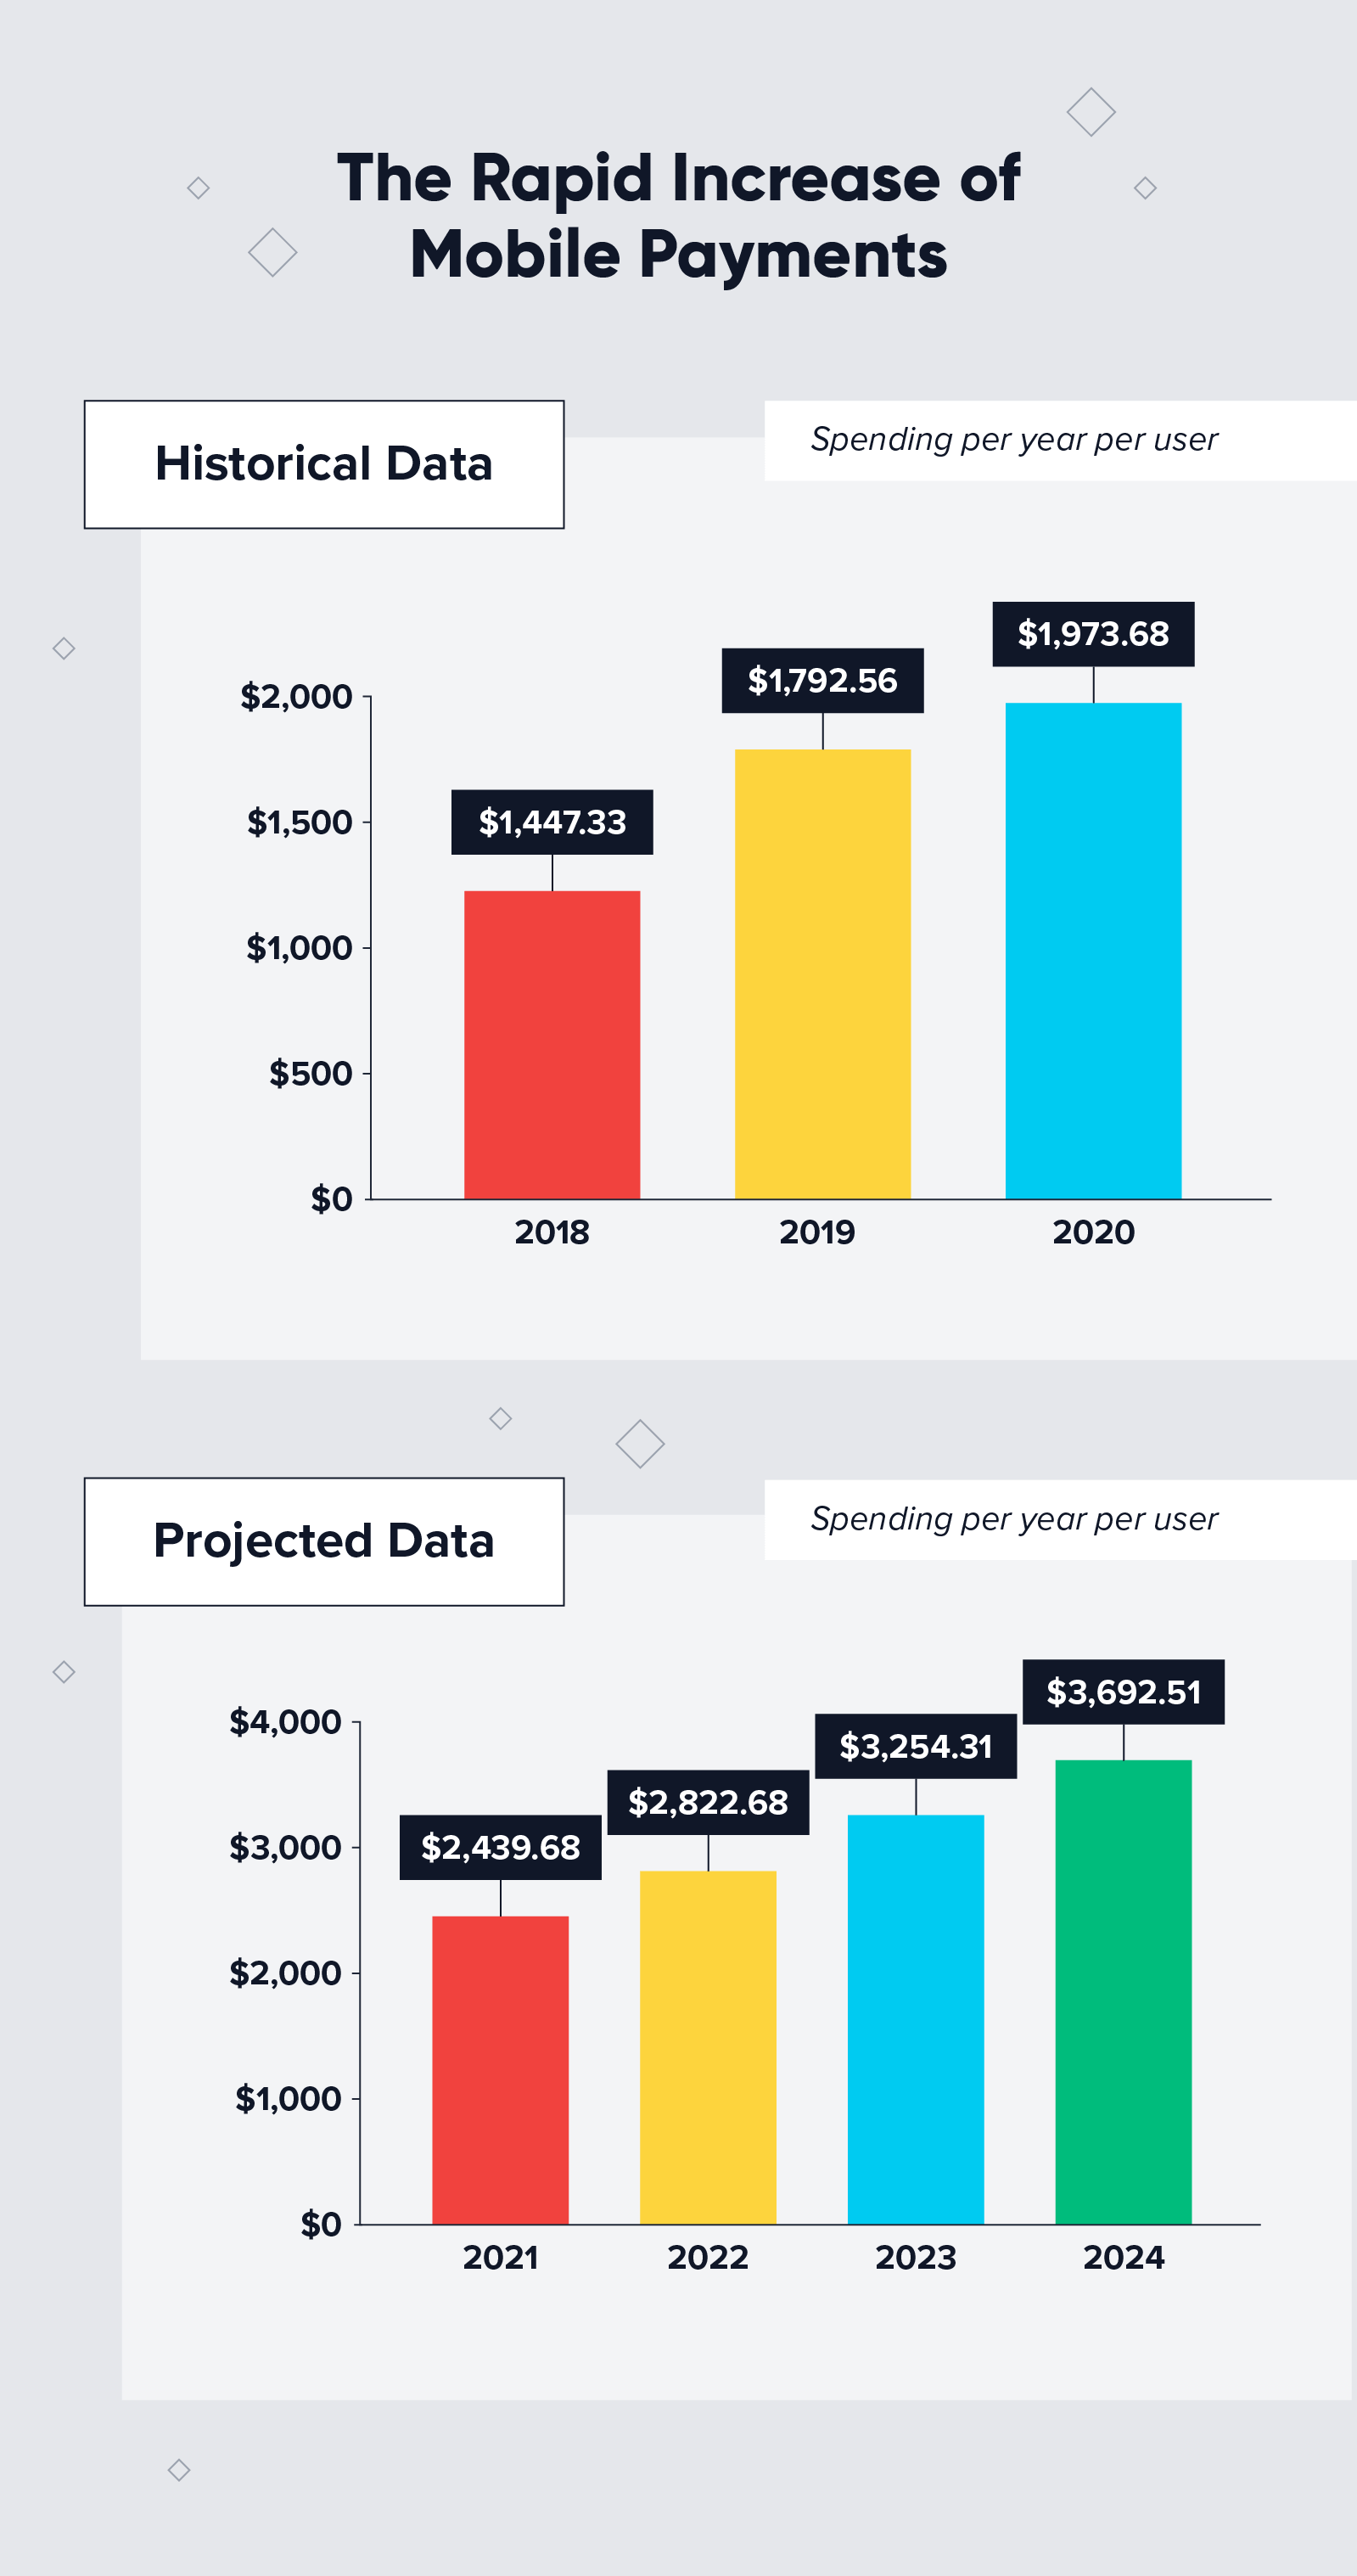
The increase of mobile payments is not likely to slow down soon, as the market is expected to reach $6.7 trillion by 2023.*
Mobile payment types by user:
- Apple Pay: 227 million users*
- Google Pay: 100 million users*
- Samsung Pay: 100 million users*
- Venmo: 52 million users*
Despite the rapid growth the industry is experiencing, mobile payments are still not consumers’ first choice of payment. Americans still make five or six more payments each month using a credit or debit card than they do with a mobile wallet.* As the market continues to grow and more businesses allow mobile payments, these numbers are likely to change.
Mobile Wallet Statistics
The term “mobile wallet” can easily be confused with specific payment methods like Apple Pay or Google Pay. However, a mobile wallet only stores your financial information, such as credit or debit cards and certain IDs, similar to a physical wallet.
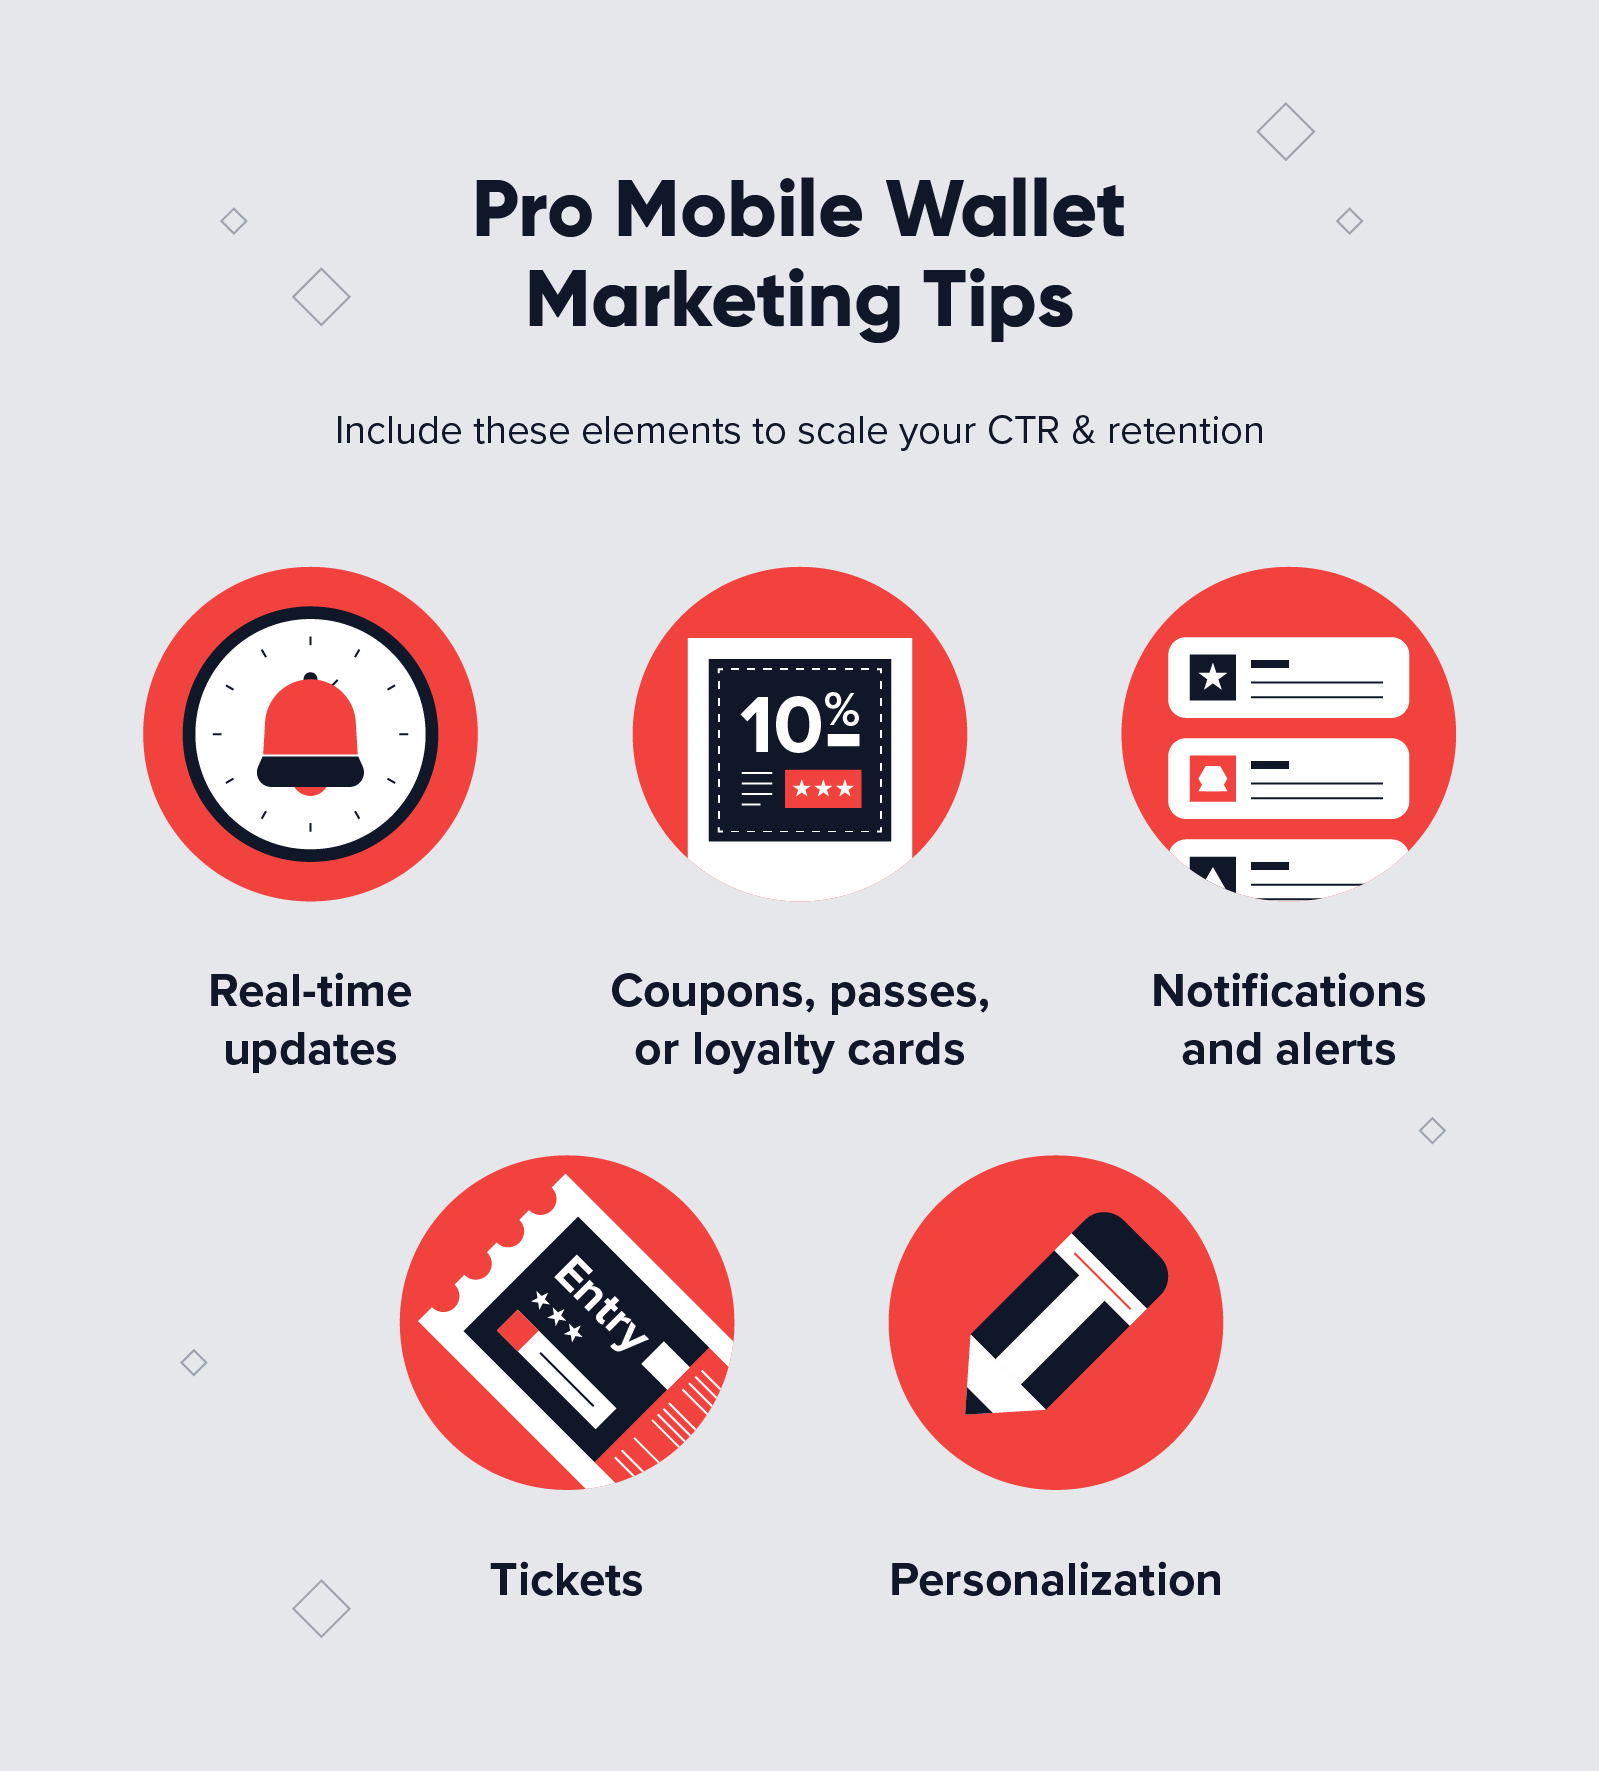
If you’re considering how or why you need to level up your mobile wallet marketing, browse the mobile payment statistics below.
- Millennials are more likely to use mobile wallets for purchases than seniors and baby boomers.*
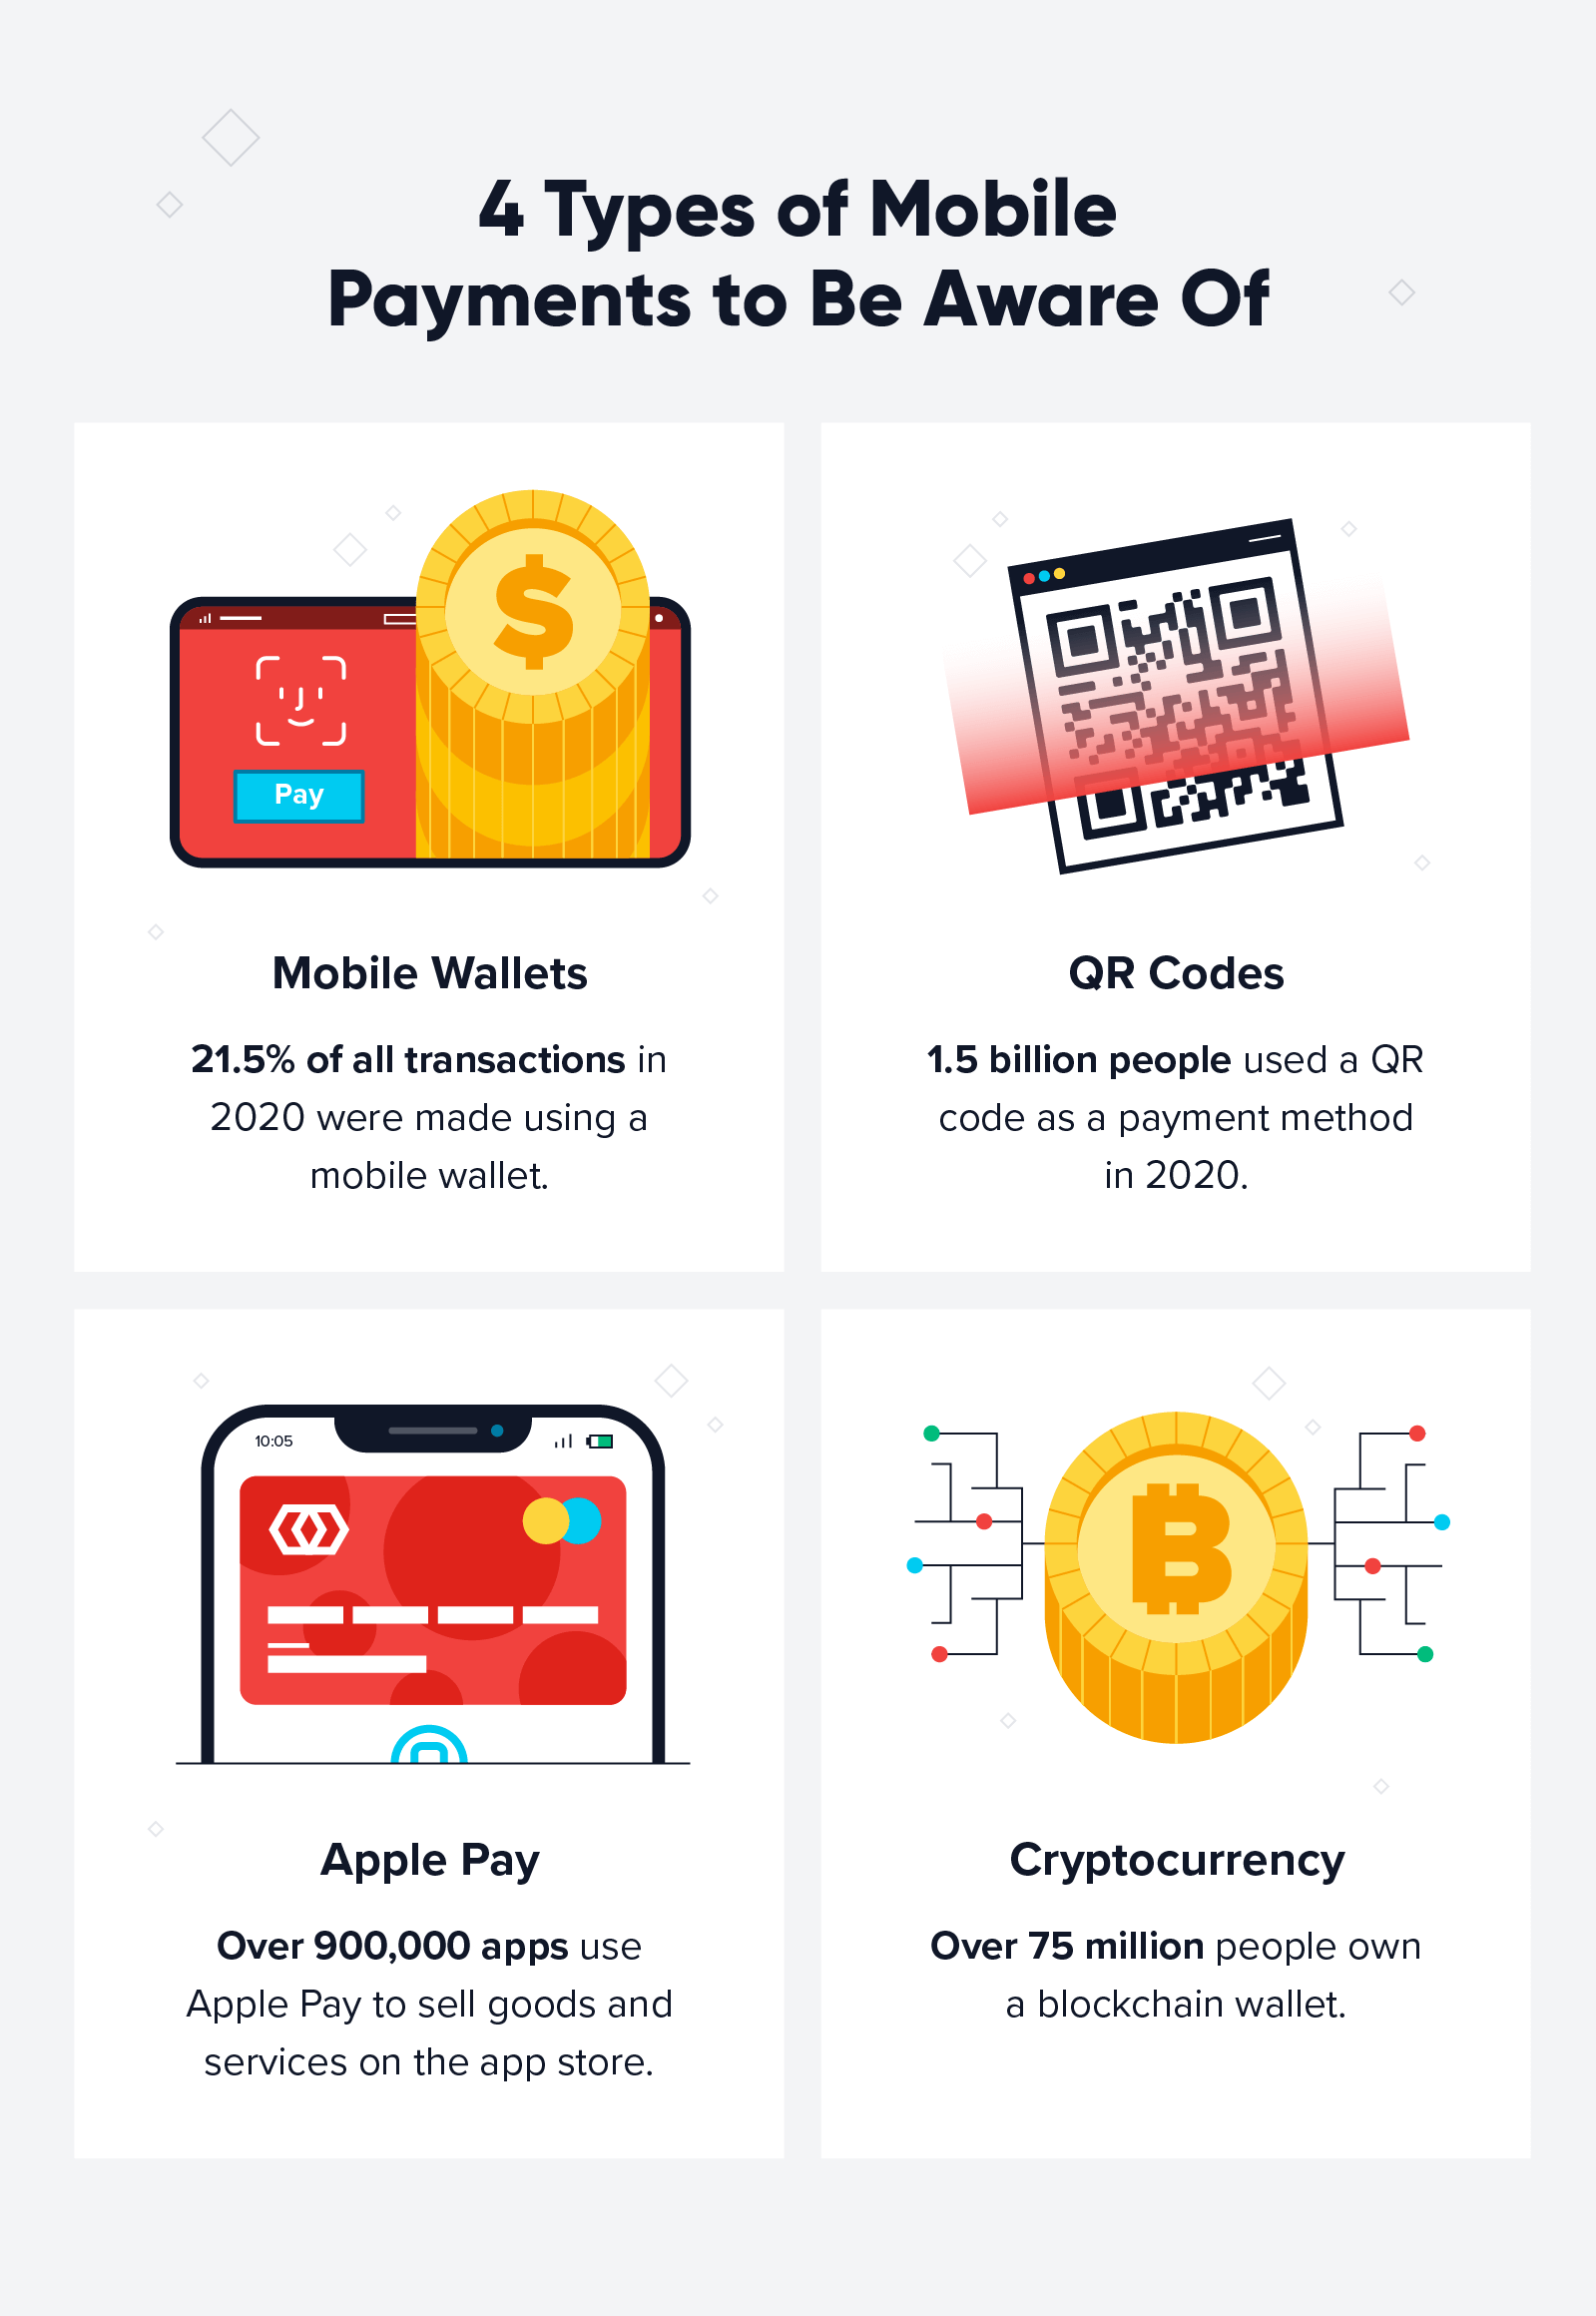
- 21.5% of transactions in 2020 were made via mobile wallet payment.*
- 66% of individuals who use mobile wallets say they do so because of its convenience.*
- The same study also found that 44% of men who have used a digital wallet are more likely to spend greater amounts of money when doing so, compared to women at only 26%.
- The mobile wallet market is expected to exceed $80 billion by 2026.*
QR Code Statistics
Developed by the Japanese auto industry in 1994, QR codes have been heavily present in many parts of Asia for years.* It wasn’t until the COVID-19 pandemic hit that the U.S. began utilizing this technology more.
- 66.5% of consumers prefer to use QR codes to make payments if cash was not an option.*
- QR code payments have an estimated $2.7 trillion transaction value worldwide by 2025. *
- 1.5 billion people used QR codes as a payment method in 2020.*
- QR codes have increased as much as 11% in the United States since the start of the pandemic.*
Apple Pay Statistics
With over 10 billion Apple Pay transactions in 2019* and the same platform holding 92% of all mobile wallet debit transactions in 2020,* it’s safe to say Apple has been one of the top trendsetters in the mobile payment industry for years.
- 36% of consumers had a device able to support Apple Pay in 2020, while 81.2% of consumer phones were capable of supporting Walmart Pay.*
- Apple Pay is available in 60 countries around the globe, while Google Pay is available in 40 nations and Samsung Pay in only 29.*
- 5,480 banks support Apple Pay in 2020, a 29% increase from the previous year.*
- The same survey also found that 51% of Apple iPhone users activated Apple Pay in 2020.
- 65% of all national retailers supported Apple Pay in 2019.*
- More than 900,000 apps use Apple Pay to sell goods and services on the app store.*
Cryptocurrency Statistics
The first purchase of a real-life item using Cryptocurrency was in 2010. Laszlo Hanyecz paid 10,000 Bitcoin for two pizzas, which was worth roughly $41 at the time. Cryptocurrency has since increased in value — with 10,000 Bitcoin now worth over $80 million* — and many businesses now accepting it as payment.
- Over 75 million individuals have a blockchain wallet today.*
- Bitcoin is the most popular cryptocurrency with a dominance of 59.5%.*
- Bitcoin ATMs are available in 74 different countries with over 25,000 crypto ATMs around the world.*
- Prepaid cards and gift cards are the most accepting of cryptocurrency at 44%.*
- The same study also found that 29% of crypto payments were done using BitPay, the largest amount of any payment service provider.
- The highest price Bitcoin has reached was $64,863 in April 2021.*
- Over 15,000 businesses around the world accept Bitcoin as payment.*
Global Mobile Payment Statistics
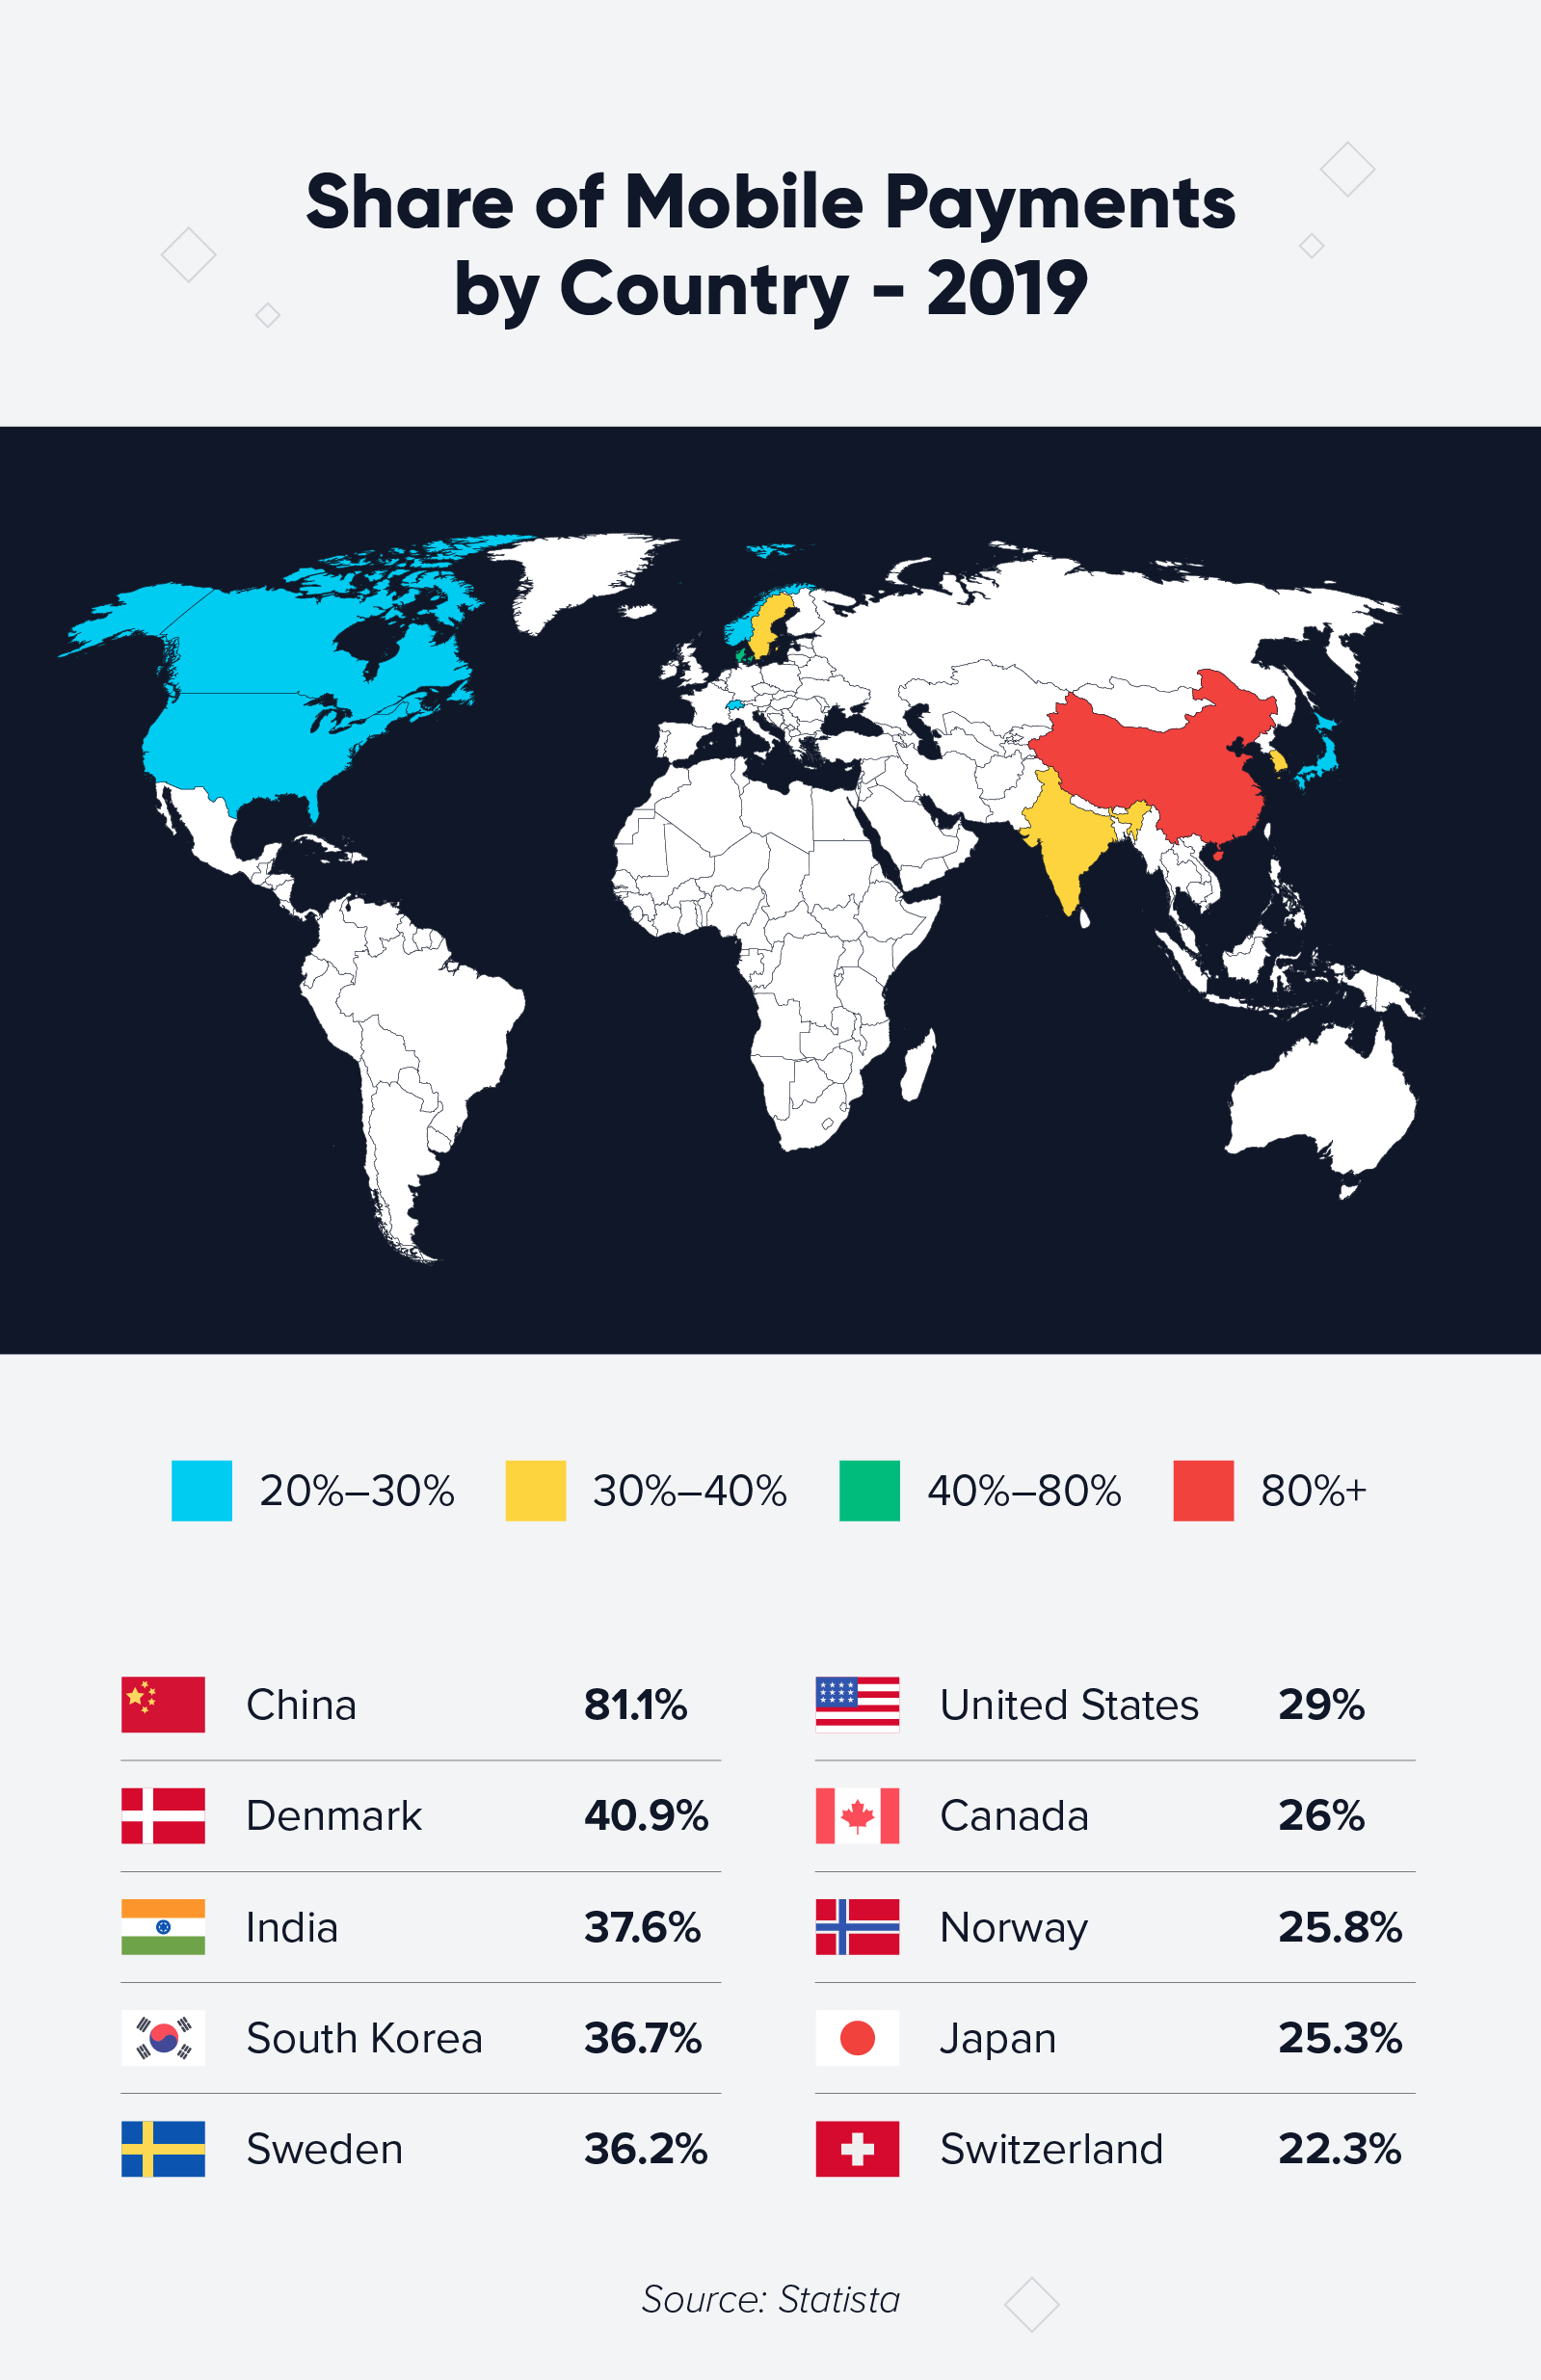
The United States isn’t the only country to have seen an increase in mobile payments. In fact, in 2019, the U.S. wasn’t even one of the countries with the most mobile payment users. At the time, it was China, Denmark, India, South Korea, and Sweden.*
- Mobile wallet payments made up 44.28% of ecommerce transactions worldwide.*
- In 2018, the Chinese app Alipay was the world’s most used app aside from social media. 15 million small businesses accept Alipay’s QR codes as payment.*
- An estimated $1.65 trillion worth of transactions occurred in China in 2016 through the use of QR codes.*
- The global mobile payment market was valued at $1.48 trillion in 2019.*
- China is the world leader in mobile payments, with 81% of the population having made a proximity mobile payment in the last six months (as of August 2021).*
Mobile Payment Growth
Possibly the number one contributor to the growth of the mobile payment market is the shift in consumer behavior, partially attested to COVID-19. However, other factors — such as the increased convenience, security, and cleanliness — also play a role in the rise of digital payments.
- The mobile payment market value is anticipated to reach $12.6 trillion by 2027.*
- The number of consumers making mobile payments was about 900 million before the pandemic, which rose to roughly 1.48 billion users in 2020.*
- This same study also found that 25.7% of all point-of-sale transactions were paid via mobile wallet. This number is expected to increase to 33% in three years.
Mobile Payment Security Statistics
Only about 24% of consumers prefer to use mobile payments specifically for the security they provide.* While many mobile payment companies are working to make digital payments more secure and protected, 38% of consumers feel that mobile payment security is only subpar.*
- Mobile payment fraud accounts for 27% of online sales.*
- Account takeover (ATO) fraud is the leading cause of financial loss via mobile payment channels.*
- 70% of the U.S. population said that fear of identity theft or loss of funds is one of their concerns about making mobile payments.*
Understanding these mobile payment statistics will help you better understand your target customer. Use them to your advantage, especially when creating the perfect mobile checkout flow. If you’re still unsure what type of mobile payment your audience uses the most, utilize a marketing analytics platform and test a few out for yourself.

Measuring the Real Impact of Marketing Pocket Guide
Shivkumar M 
Head Product Launches, Adoption, & Evangelism.Expert in cross channel marketing strategies & platforms.
Free Customer Engagement Guides
Join our newsletter for actionable tips and proven strategies to grow your business and engage your customers.
