The primary set of KPIs for product owners, marketers, and entrepreneurs of consumer mobile products is to drive user activity on their platform, constantly improve app adoption, and drive revenue for their business.
The Acquisition and Retention Game
Customer Acquisition Cost (CAC) is at an all-time high for consumer applications. With these increasing costs, it becomes imperative that the users you have acquired spend significantly more time within your apps in order to increase revenue and raise Customer Lifetime Value (CLTV) per user. Every mobile product owner strives to increase product adoption.
One of the key parameters to raise your app’s stickiness is to provide users with a positive experience interacting with your brand and app. Getting them to interact more, in fact, getting them hooked to your platform, is the key driver to your app’s success.
In this post, we will cover one of the most data-driven approaches to improving the user experience: Screen A/B Testing.
What is Screen A/B Testing?
Screen A/B testing is the practice of showing two different versions of the same screen (or a feature flow) to different users in order to determine which version performs better. The version that performs best (the winner variant) can then be deployed to the rest of your users.
To effectively test which version of your screens/features work the best, you must invest in building more than one version. Each new version is added effort to your team’s bandwidth, and is always a tradeoff you need to make as the product owner.
How is Screen A/B Testing Used?
Below are some typical use cases for when to use screen A/B testing:
A. Test (Major) New Feature Variants
When a product team releases a significant new feature, before making a release to the entire user base, they test multiple versions of the same feature. This helps them identify the best performing version which generates maximum bang for the buck.
B. Staged Rollout
Mature product companies constantly release new features and updates for users. If a feature majorly impacts a core area of the product, it is wise to stage these releases to a small percentage of your user population to measure the impact.
This use case is almost a growth hack of using the A/B testing infrastructure, where you can put a large chunk of your users (say 90%) in a Control Group and release the new feature to only a small set of users (the remaining 10%), thus giving you more control over the rollout.
C. Testing Leading Indicators
Leading indicators help product owners predict significant changes in product usage or key metrics. Leading indicators are early signs that something good (or bad) is truly around the corner. They’re typically difficult to measure because, if done well, these are visible well before changes in key metrics (e.g., average revenue per user, sticky quotient) are obvious.
For example, product quality is typically a key leading indicator. Are there bugs in your mobile app which could lead to overall customer dissatisfaction? As a variation of use case B above, you can expose parts of your app to only a small number of users and then monitor their usage patterns, ask for qualitative feedback and make appropriate adjustments before releasing it to all users.
How to Choose a Screen A/B Testing Platform
The following five items can be used as a simple checklist for evaluating test platforms. You should look for:
- Ability to Set Experiment GoalsEvery A/B testing experiment you publish should have set goals.
Goals can be as simple as the completion of a single user event (e.g., a purchase), or could be as complex as users successfully moving through a funnel (a sequence of events in order). Goals can be retention-based, such as checking if a user performs a certain actions within a number of days after being exposed to a test variant. Goals can also be based on a metric like revenue per user, or hours of video watched within a given time frame.
Good A/B testing platforms will give you control over setting the goals in all of the above examples. They will also give you the ability to associate multiple goals with each test so you can make a consolidated, quantitative decision based on multiple factors. - Full Control Over Selecting Test Population and Control GroupsUser segmentation is another key to creating exceptional A/B tests.
Here’s a starting point: you need the ability to microsegment your test users based on their demographics as well as past behavior in the app.
In addition, you need the ability to define the percentages of your test and control groups from within the defined microsegments. For example, a couple of the growth hacks for A/B testing depends on being able to set the control group to be much bigger than the test group. - WYSIWYG Visual Editor to Create Visual Variants in Both Android and iOSMany A/B tests are restricted to creating variations of visual elements such as colors, fonts, and text on screen.
A good screen A/B testing platform will not only give you the ability to create all these variants, but allow it from multiple devices (different models of Android phones for example, or iPad and Android tablets) and also mirror your variant modification on the real device so you can see it visually on the device. - Multiple Control Variables to Create More Complex Feature Flow Variants in both Android and iOSMore sophisticated A/B testing involves the creation of control variables whose values at run time determine the different flows of your features. This requires code within your apps that can deal with all these different values at run time and the role of the A/B testing platform is to be able to detect these variables and allow the run time setting of these variable values for different test groups. Every unique combination of control variable values will change the behavior of a variant.
This kind of testing can be used to test for real functionality, for example: control the speed of a ball during a game, or skip/add screens within a given flow, or even hide/show specific items from your screens for different users.
A good A/B testing platform allows for multiple control variables, detects these control variables automatically while you’re setting up the experiment, and then allow granular control over values for each of these control variables in each test group. - Analysis & Measurement on Test Cohorts and Control GroupsFinally, analysis and measurement are crucial to deciding the success of any experiment. A good A/B testing platform should allow for measuring differences between the various test groups and the control groups.
Measurements should include: multi-step conversion measurements, retention cohorts, recency and frequency of app usage, as well as numeric metrics like the average revenue per user.
A good platform not only shows you experiment statistics based on your present experiment goals, but allows you to explore test cohorts on much broader metrics like conversion, retention, and revenue.
CleverTap’s Experimentation Framework
CleverTap’s screen A/B test capability meets all the above criteria. In addition, we integrate A/B testing as just one more form of experimentation you can carry out for increasing the time users spend within your apps.
For example: you can use timely, relevant, and contextual messages over channels like email, push notification, and SMS to drive users into your apps. Once in the app, you can experiment with in-app messages or an App Inbox that contains personalized messaging and is timed perfectly for every user. You can even retarget specific segments of your users on Facebook or Google using our integration with both of their custom audiences product. Finally, of course you can experiment with screen A/B testing variants.
Inculcating an experimentation culture within your organization and having the willingness to experiment with different channels, messaging, as well as screens, will only augur well for your app and business growth.
Setting Up Your A/B Test
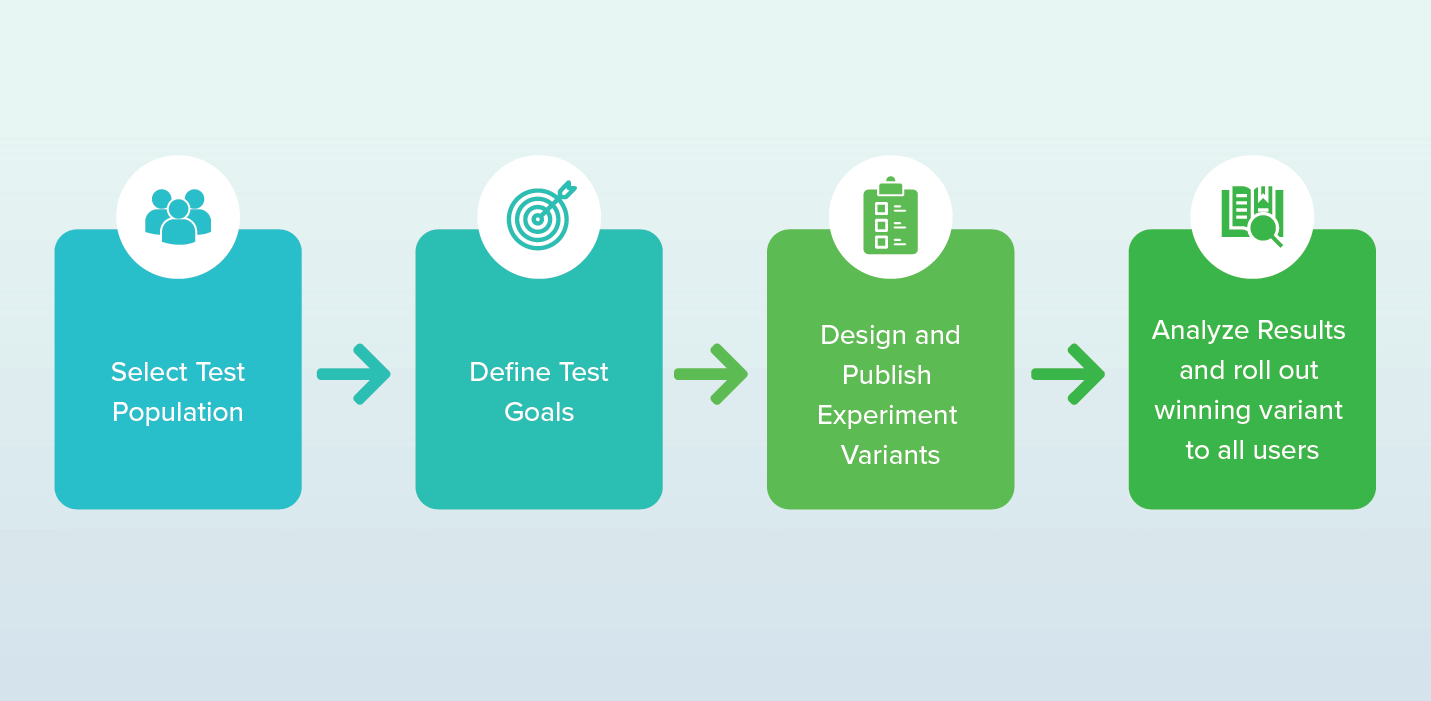
Your A/B test can be set up within minutes by taking the following simple steps:
Once the experiment is complete, you can analyze the performance of each variant using advanced statistical analysis techniques and then publish the winning variant to the remaining user base.
| Variants | Charged | Item Wishlisted | Funnel Added to Cart -> Charged | Retention (3-7) days | Average Revenue per User |
|---|---|---|---|---|---|
| Default (900 users) | baseline | baseline | baseline | baseline | 250 |
| Variant A (850 users) | -9% to -2% | 2% to 12% | -2% to 8% | -3% to 2% | 209 |
| Variant A (990 users) | 0% to 5% | 6% to 10% | 2% to 15% | 3% to 6% | 390 |
Using our screen A/B test, you will be able to control the entire experiment from the dashboard without having to involve your engineering team at every step of the way.
We will be releasing the Screen A/B test capability soon. Watch this space for updates.
Shivkumar M 
Head Product Launches, Adoption, & Evangelism.Expert in cross channel marketing strategies & platforms.
Free Customer Engagement Guides
Join our newsletter for actionable tips and proven strategies to grow your business and engage your customers.


