We’ve seen how to create, track and drill down on Past Behavior and Live User Segments in CleverTap as well as how segments can be used (as before) to drive your marketing campaigns.
Now let’s take closer look at how to use segments across all your analytics.
Filtering Dashboard by Segments
At the top of every dashboard (Today, Mobile, Revenue and Uninstall) is a Segment Selector dropdown. Inside the dropdown is a list of all the segments you’ve created and saved.
By default you’ll see each dashboard populated by All Users. So for the Mobile App Dashboard below, for the month of July, we have a total of 97,876 active users with the corresponding breakouts for DAU, WAU and MAUs.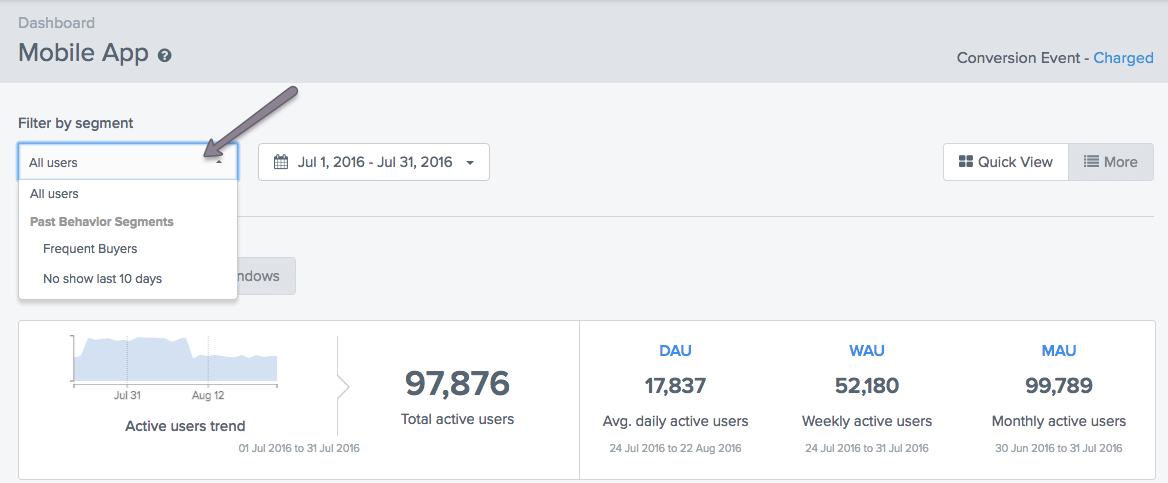
Now suppose we want to focus only on our most frequent buyers. We’ve created a segment (Frequent Buyers) for my users who have transacted greater than 5 times. When I select this segment, my Mobile Dashboard tells me I have 14,112 Frequent Buyers in July. So of my 97,876 total actives for the month, 14,112 of them meet my criteria as a Frequent Buyer (transacted 5+ times).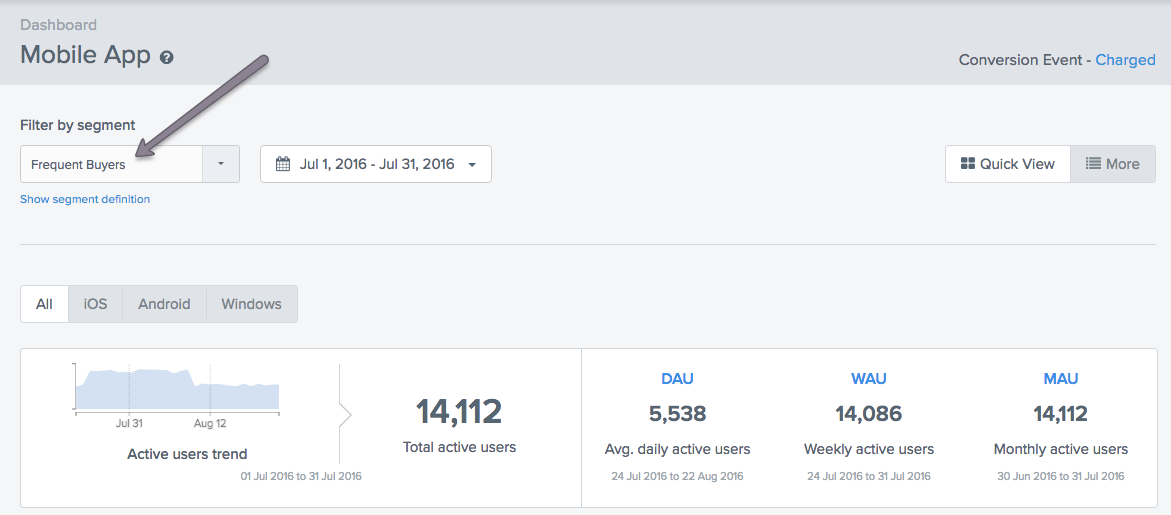
You can filter any dashboard by any segment you create to isolate a group of interest and track their changes over time.
Filtering Analytics by Segments
As with our dashboards, you can now filter your Funnels, Cohorts, Events and Trends by any saved segment. Such filtering is incredibly powerful. It lets you isolate your analysis for engagement and retention to any segment of interest.
Take the following example. You want to show the top of your conversion funnel to see how many users Searched the product catalog and Viewed items in in the books or toys categories. Your Funnel steps will look like the following with the results below.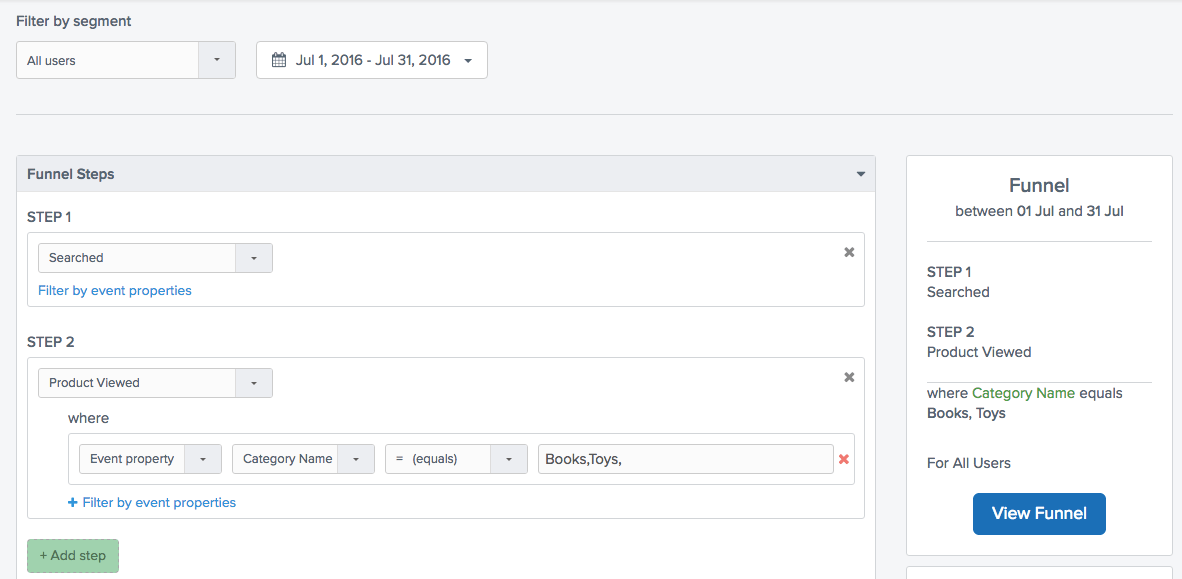

25.3% of Total Users completed these steps in this sequence in July.
Now suppose you want to look at the exact same funnel, but only for for your frequent buyers. Choose Frequent Buyers from the Segment Selector on top of the page and the funnel analysis is instantly updated to include only users who have transacted >5 times (the definition of this segment).
The results are interesting. Whereas 25% of my Total Users Searched then Viewed, 53% of my Frequent Buyers performed the same activities in sequence.
53% of Frequent Buyers completed the same steps
You can use the same methodology for filtering any Cohort, Trend or Event Query.
Creating Ad Hoc Segments for Filtering your Analytics
Sometimes when doing your analytics you think of a segment you want to isolate but you haven’t yet created and saved it. So we made it easy for you to create one on the fly. Here’s how.
First remember to reset the Segment Selector back to All Users.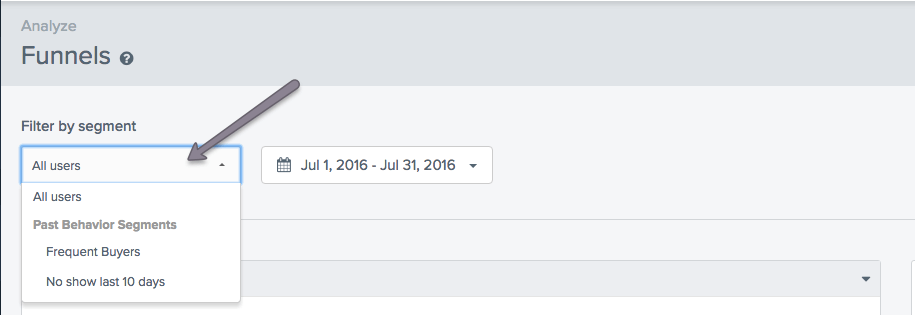
Beneath the Funnel Steps (it’s exactly the same for Cohorts, Trends & Events) there is a Filter by Segment builder. This is where you go to build an ad hoc segment.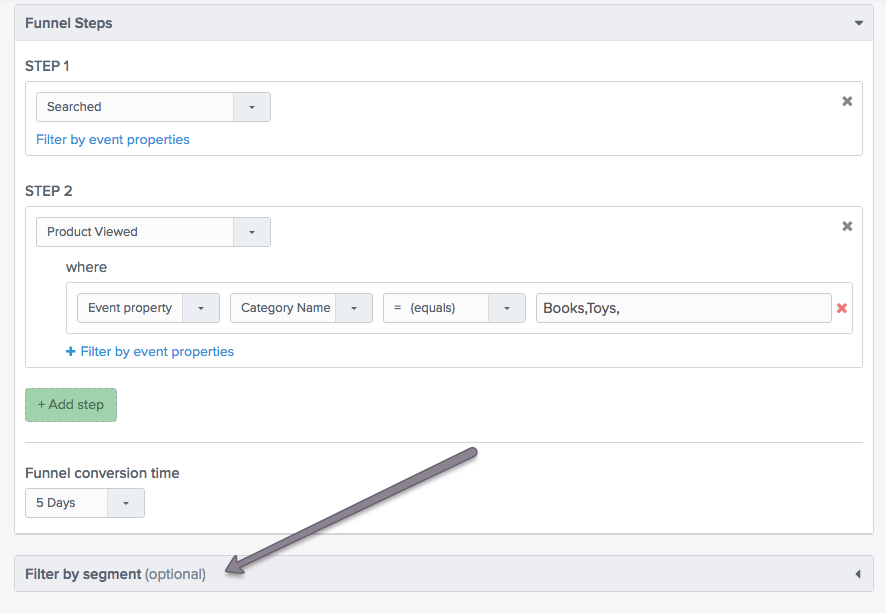
Say for example you want to analyze the Funnel from above (Searched then Viewed toys or books in the catalog) but now you want to see how conversions look only for users acquired from Facebook.
After creating this segment in the builder we find 54% conversion rate for users acquired from Facebook.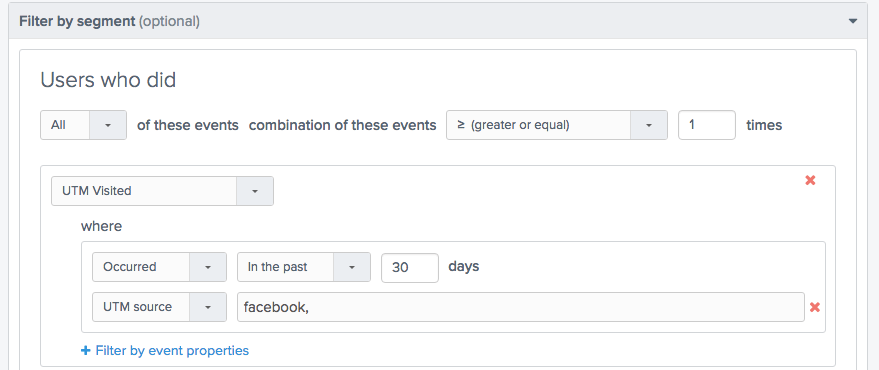

54% of Users Acquired from Facebook completed the same steps
Note – the other way to create ad hoc segments is in Find People where you can select any combination of behaviors and user attributes and see the results instantly for segment size, reachability etc. You can even save off a segment right from this interface and it will populate the drop downs across the product.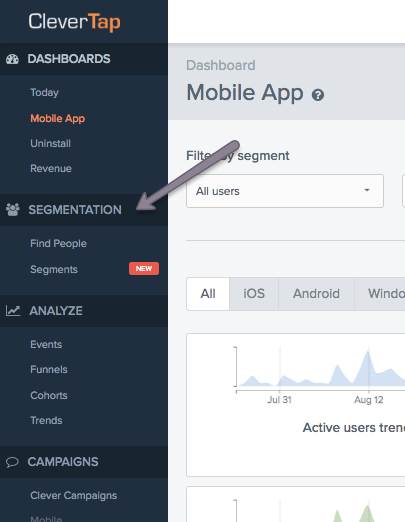
In case you missed it read all about Creating and Tracking Behavioral Segments here.
There’s a lot to check out in this latest release. Give us feedback!
Shivkumar M 
Head Product Launches, Adoption, & Evangelism.Expert in cross channel marketing strategies & platforms.
Free Customer Engagement Guides
Join our newsletter for actionable tips and proven strategies to grow your business and engage your customers.


