


Table of Contents
Categories
Most Popular


Marketers know that smartphones changed the game. It’s been years since mobile overtook desktop usage, and that gap is only getting bigger. Now mobile isn’t just a device — it’s a mentality.
Today’s brands have to understand how to grow a business in the mobile-first era. And that means answering questions such as:
- What’s driving mobile business growth?
- How is the industry evolving?
- And most importantly, how can you apply the latest data to inform your mobile growth strategies?
Brush up on the latest statistics and emerging trends in the mobile marketing industry with our collection of mobile growth statistics below. The stats are sorted into categories so you can quickly skim to grab the numbers you want, along with the original source. Before that, lets first understand more about mobile growth statistics and its importance.
What is Mobile Growth Statistics?
Mobile growth statistics track the ever-changing landscape of global mobile usage, from the rise of smartphones to the explosion of mobile commerce and apps. They provide crucial insights into how technology shapes society, commerce, and communication. Understanding these trends is vital for businesses, policymakers, and consumers, driving innovation and shaping the future of connectivity.
Importance of Mobile Growth Statistics
In our interconnected world, mobile growth statistics are essential. They track the pervasive influence of smartphones and tablets across all aspects of life, from communication to commerce. By revealing trends in adoption and usage, these stats offer critical insights into industry transformation and consumer behavior. Understanding them is crucial for businesses, policymakers, and individuals, guiding decisions and driving innovation in the rapidly evolving landscape of connectivity.
Global Mobile Usage Statistics
Understand how today’s global consumers use mobile devices.
- There are 4.92 billion mobile users globally, 66% of the total population. (We Are Social, 2017).
- Global mobile data traffic is projected to increase nearly 3x between 2018-2021. (Statista, 2018)
- Mobile devices are projected to drive 79% of total global internet usage in 2018. (eMarketer, 2017)
- The average adult spends 3.1 hours a day consuming digital media on mobile (Mary Meeker’s 2017 Internet Trends Report). That’s approximately 69% of their total media time. (comScore, 2017)
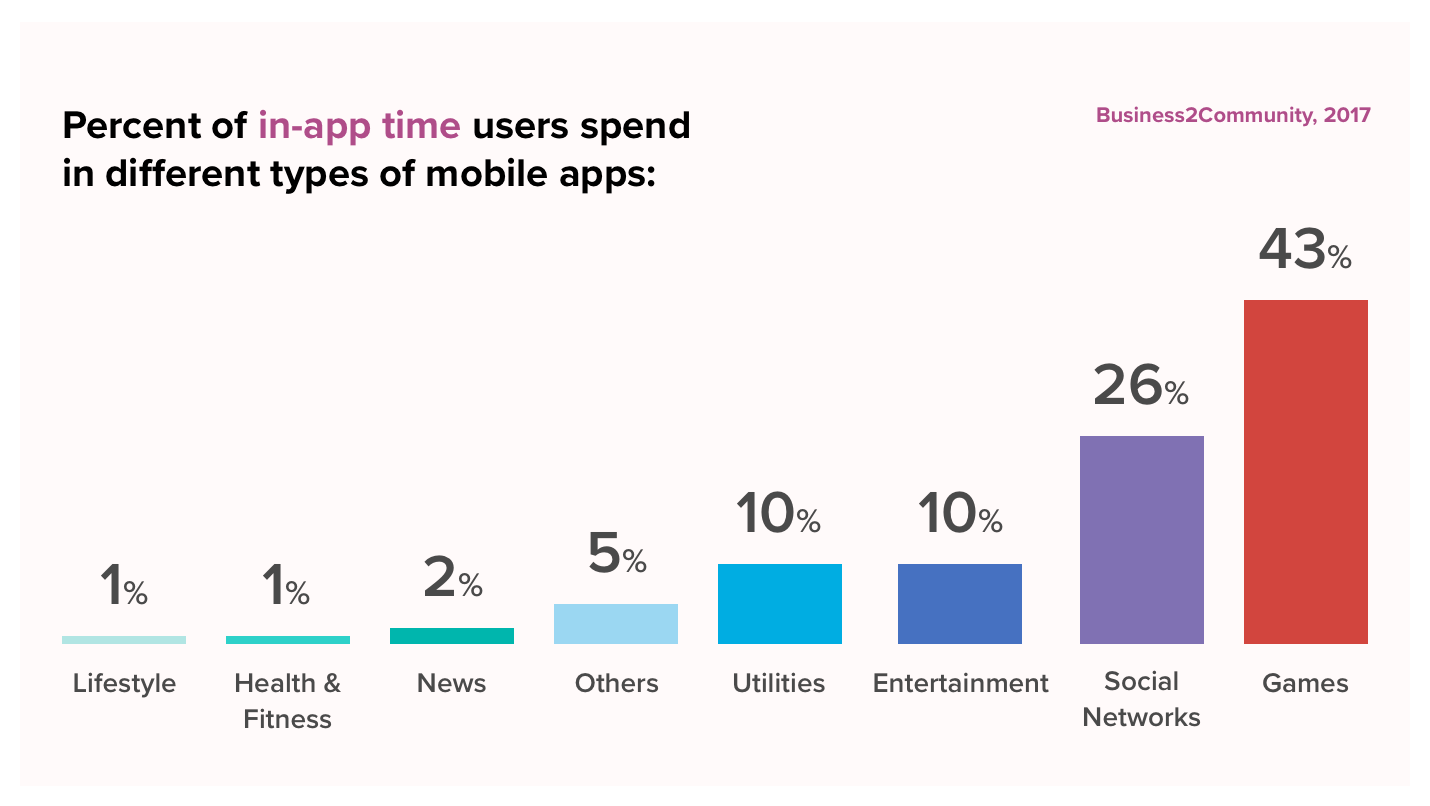
- 52% of the time that individuals spend on digital media is on mobile apps. (Business2Community, 2017) Smartphones are the only devices that have seen growth in the number of online visits, up 89% since January 2015. Tablets and desktop visits have declined significantly (-30% and -17% respectively) (Adobe, 2018)
- 96% of 18-29-year-olds live in a household with at least one smartphone, and 51% live in a home with 3 or more devices. (Pew Research, 2017)
- 46% of smartphone owners say their device is something they “couldn’t live without.” (Pew Research, 2017)
- There is more than 4.5x the number of Android users than iOS users worldwide. (Gartner, 2017)
Mobile Security & Data Privacy Statistics
Learn how concerns about app security and private data are affecting user behavior.
- 28% of US smartphone owners say they do not use a lock screen or other feature to secure their phone. (Pew Research, 2017)
- 14% of US smartphone owners say they never update their phone’s operating system, and 10% say they never update apps. (Pew Research, 2017)
- 94% of IT professionals expect mobile security attacks to become more frequent. (Mobile Business Insights, 2017)
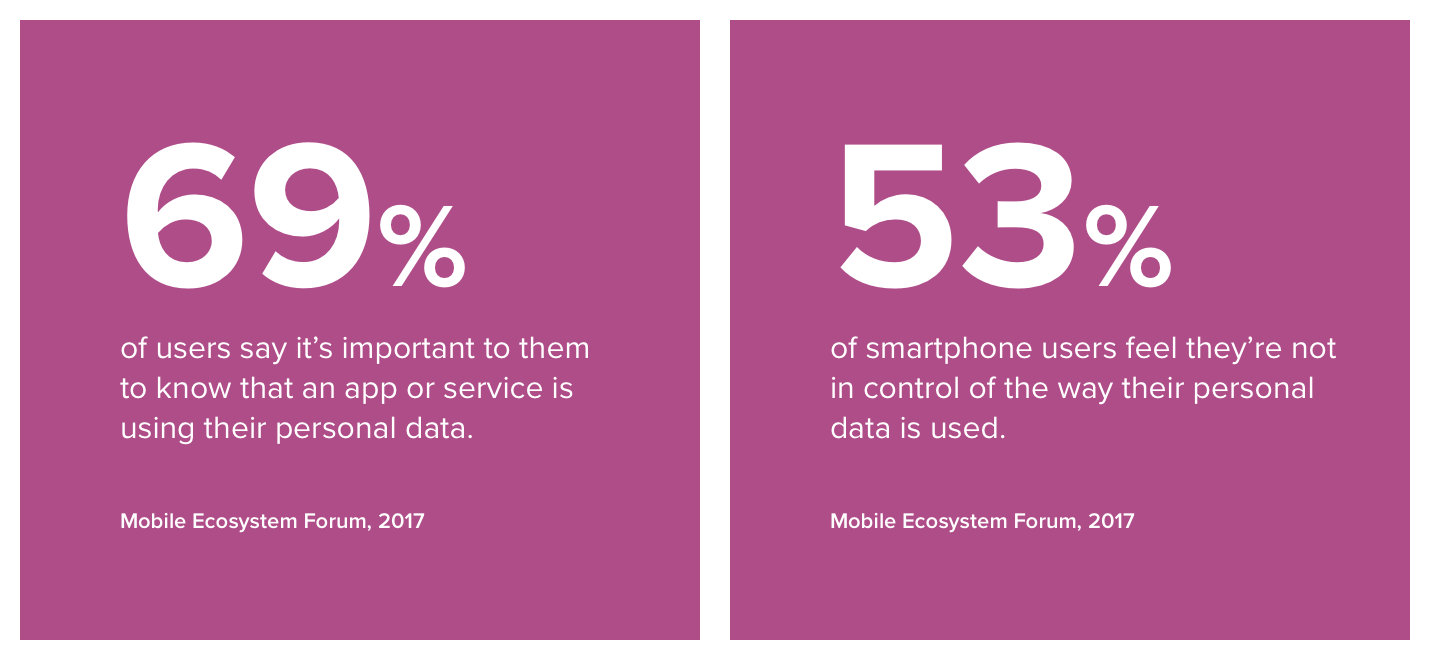
- 61% of mobile users say it’s extremely important to them that a company deletes personal data when they ask it to. 70% of these also say they’re concerned personal information will be shared without their permission. (Mobile Ecosystem Forum, 2017)
Mobile App Usage Statistics
See how today’s users have incorporated mobile apps into their daily lives.
- As of March 2017, there are 3.7 million apps in the Google Play store (Appbrain, 2018), 2.1 million in the Apple App Store (The Verge, 2018), 800K in the Windows Store (Windows Report, 2017), and 600K in the Amazon Appstore. (Business of Apps, 2018)
- More than 1,300 apps per day are added to the Google Play Store. (Business of Apps, 2018)
- Global app downloads topped 175 billion in 2017. (TechCrunch, 2017)
- At least 70% of US users download at least one app per month. (TechCrunch, 2016)
- Consumer spend in app stores has more than doubled over the past two years, topping $86 billion in 2017. Consumer spending worldwide is projected to top $110 billion in 2018. (TechCrunch, 2018)
- 85% of consumers prefer native apps to mobile websites. (Business2Community, 2018)
- Mobile apps have much higher engagement rates than mobile-optimized websites or desktop web viewing, and 100-300% higher conversion rates (TechCrunch, 2018)
- The average consumer spends nearly 3 hours in apps per day. (TechCrunch, 2018)
- Total time spent in apps worldwide reached 1.6 trillion hours in 2016 — a year-over-year app engagement increase of over 50%. (App Annie, 2017)
- The average person uses 9 apps daily and 30 apps monthly. (TechCrunch, 2017)
Mobile App Engagement and Retention Statistics
Discover how today’s users engage with mobile apps, and mobile app retention benchmarks.
Mobile App Downloads/User Acquisition
- 25% of users say they don’t download apps because they don’t have space on their phone. (Deloitte, 2017)
- 34% of people choose apps based on peer reviews. Nearly all (96%) app users will download a 4-star app, compared with only 50% who will download 3-star apps and 15% who will download 2-star apps. (CIO, 2015)
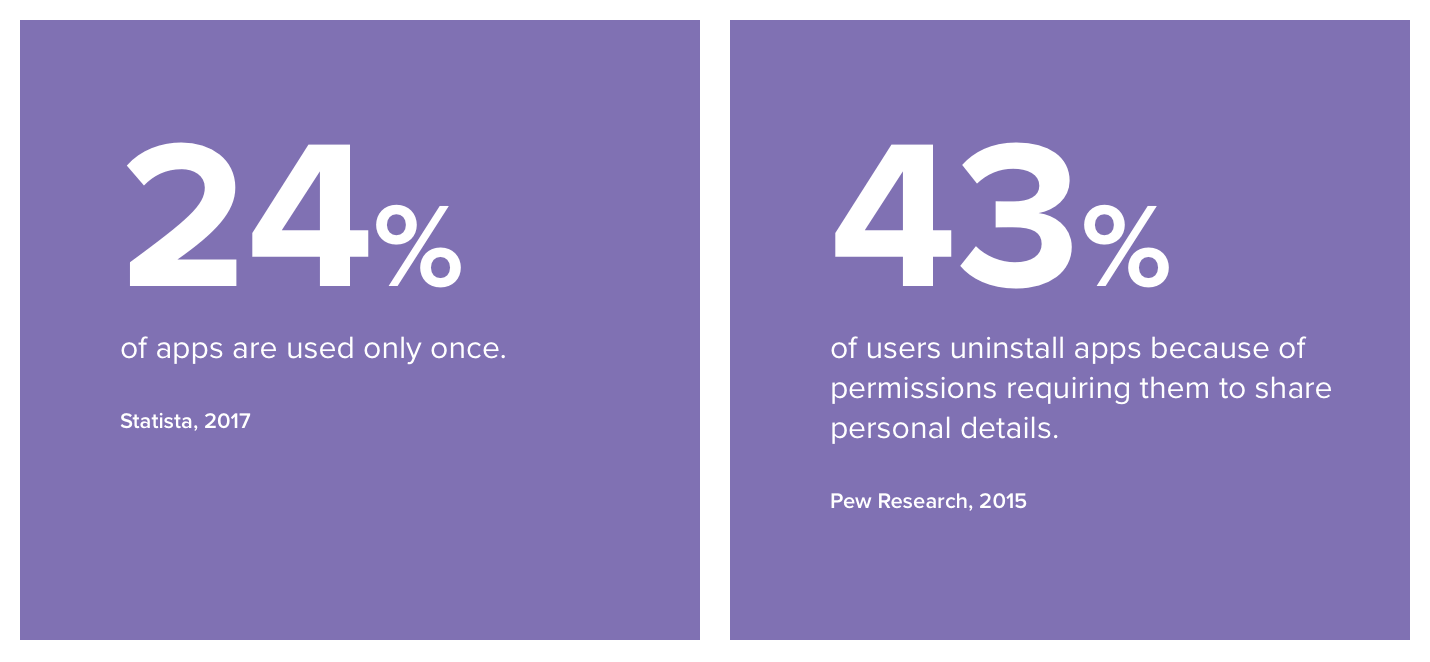
- 60% of app users decide not to download an app after realizing the amount of personal information they would have to share. (Pew Research, 2015)
- Discounts and deals are the top motivating factors when deciding whether to install an app. (Think With Google, 2016)
Typical App Use
- The average smartphone user has more than 80 apps on their phone, and uses close to 40 of them per month (or between one-third and one-half of the apps on their phone per month, on average). (TechCrunch, 2015)
- The average US smartphone owner uses over 35 apps per month. The top 20% of app users use over 45 apps monthly. (App Annie, 2018)
- 80% of app users engage with their apps 15 times a day. (CIO, 2017)
- The average user spends 70% of their app-using time in just three apps. (Business Insider, 2015)
Engagement & Messaging
- Neuroscience researchers have discovered that today’s consumers find delayed mobile loading times more physiologically stressful than viewing a horror film. (Ericsson, 2018)
- In 2017, the top five app activities among US consumers were listening to audio, social media, gaming, video viewing, and messaging. (eMarketer, 2018)
- Global consumers spend an average of 28.8 minutes a day viewing mobile videos (Zenith, 2017).
- 55% of smartphone owners say they get news alerts on their phones. (Pew Research, 2017)
- Personalized push notifications see 9.06% higher open rates than generic messaging. (CleverTap, 2018)
- Adding emojis to push notifications results in 70% higher CTRs. (CleverTap 2018)
- By 2020, 48.7 million consumers are predicted to opt-in to receive business SMS, making it the fastest-growing marketing channel. (textlocal, 2017)
- Response rates from SMS are 209% higher than from phone calls, Facebook, or email campaigns. 29% of targeted customers respond to text messages and 47% of those responders go on to make a purchase. (Emarsys, 2018)
- Mobile email opens have grown by 180% in the last three years. (Email Monday, 2018)
- Welcome emails sent to newly acquired users have the highest open rates at nearly 60%. (Experian)
- 32% of senior mobile experts say “creating personalized customer experiences” is the greatest long-term growth potential for mobile products. (Incite Group)
Mobile App Retention
- Nearly all (96%) mobile users say app performance, such as speed and responsiveness, matters. (CIO, 2015)
- Taking up too much phone memory is the #1 app-related issue that leads users to uninstall an app. (Think With Google, 2016)
- Discounts, deals, and bonus offers are the top reason someone will return to an app after uninstalling. (Think With Google, 2016)
Mobile Advertising & Search Statistics
Understand how consumers are using mobile search, and how marketers are using mobile ads to maximize ROI.
- Mobile is the dominant platform for search, with 48% of buyers starting search with a smartphone search engine. (Google Research)
- Google owns 96% of mobile search traffic, followed by Yahoo at 2% and Bing at 1%. (NetMarketShare, 2018)
- It’s estimated that US mobile search spending will reach $25.11 billion in 2018 and $28.25 billion in 2019. (AUM Core, 2017)
- In 2017, mobile devices accounted for 61.9% of Google’s paid search clicks (iProspect, 2017)
- 87% of Facebook’s advertising revenue comes from mobile. (AdWeek, 2017)
- By 2019, mobile advertising is expected to represent 72% of all US digital ad spending. (MarketingLand, 2015). It’s projected to triple to reach $201 billion by 2021. (IAB, 2016)
- Mobile ad blocking is up 90% year over year, with 429 million people globally using an ad blocker on their mobile phone. (HubSpot, 2016)
- Users dislike pop-up ads, mobile ads, and video ads the most. (HubSpot, 2016)
- 57% of mobile users think search ads are useful, and 47% find social media ads useful. Display ads are the least useful or valuable. (HubSpot, 2016)
Mobile Commerce Statistics
Learn how mobile apps are shaping consumer shopping habits.
The Impact of Mcommerce
- Mobile shoppers make up only 17% of all consumers, yet they account for 21% of all e-commerce sales. (Facebook IQ Study, 2017)
- Growing retailers had 48% more visits from smartphones in January 2018 compared to January 2016, proving mastering the mobile experience is a key driver for growth. (Adobe, 2018)
- During the 2017 holiday season, $35.9 billion was spent via mobile devices — a record-setting 33.1% of online holiday revenue. Mobile also accounted for 52% of traffic to retail websites during the holidays. (Adobe Digital Insights, 2018)
- Mobile-influenced offline spending is already estimated to be over $1 trillion in 2017. (iProspect, 2017)
Mobile Shopping Habits
- 69% of consumers worldwide use mobile devices to research products before they buy. (comScore, 2017)
- 93% of people who use mobile to research products or services go on to complete a purchase. (Think With Google, 2016)
- 90% of smartphone owners use their phones while making purchasing decisions in a brick-and-mortar store. (Marketing Land, 2015)
- 88% of consumers who search for a local business on mobile call or visit that business within 24 hours. (Nectafy)
- Over half of consumers want to make a purchase within an hour of conducting research on their smartphone, and 69% of consumers expect businesses to be within 5 miles or less of their location. (Think With Google, 2016)
- 78% of mobile searches for local business information result in a purchase, higher than from any other kind of device. (comScore)
- 58% of smartphone users say they have used a shopping app in the last 30 days. (Think With Google, 2016)
- The average smartphone user has 4.2 shopping apps installed on their phone and use about half of them on a weekly basis. (Think With Google, 2016)
- 66% of smartphone owners who use their device to shop do so at least weekly. (Think With Google, 2016)
- The top two reasons people turn to their phones for shopping is to browse products and find discounts and deals. (Think With Google, 2016)
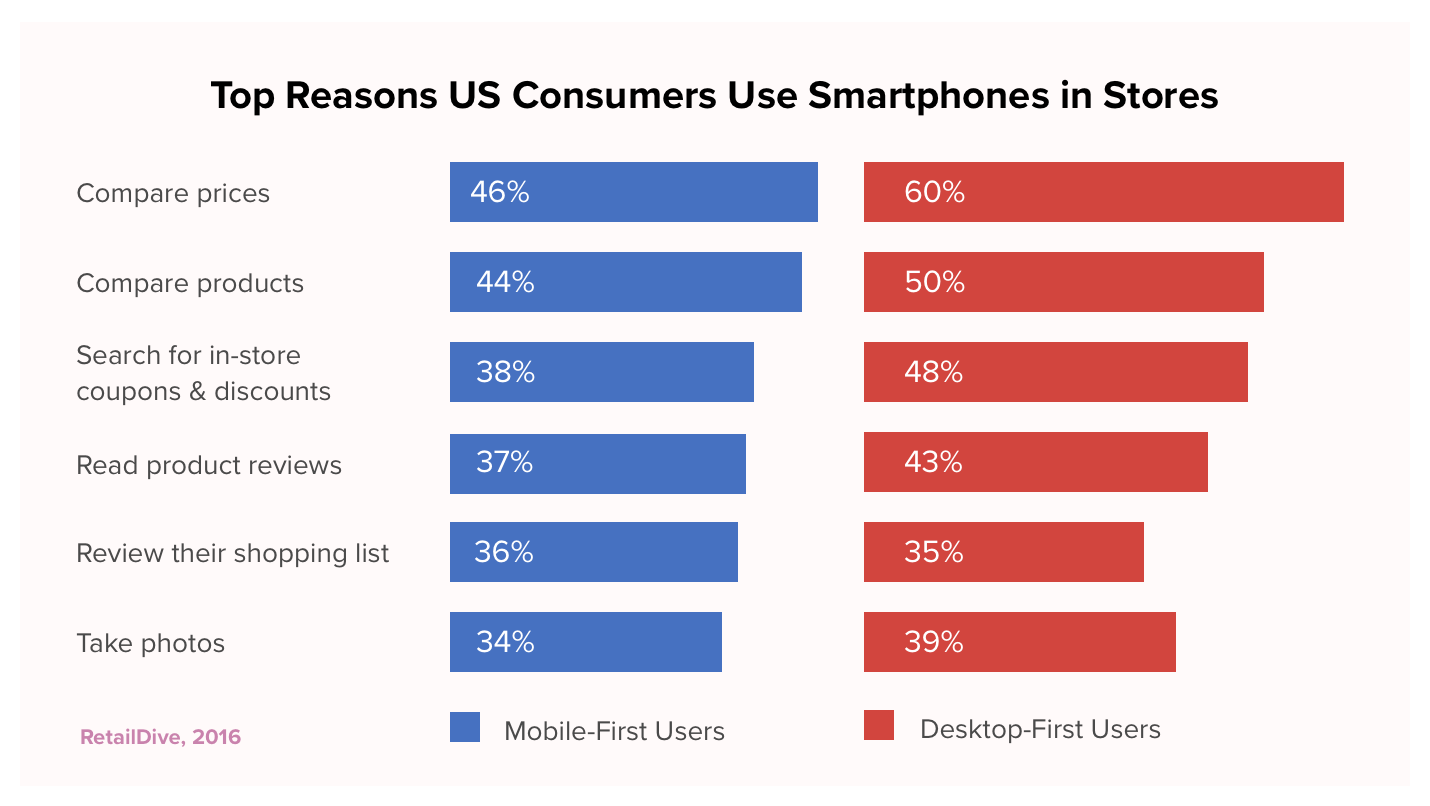
The Mobile Shopping Experience
- 52% of retailers do not optimize digital content for the device consumers choose to shop on. (Retail Systems Research)
- 31% of retailers don’t provide any item recommendations on their mobile sites. (RetailDive)
- 23% of consumers claim in-app recommendations would prompt them to add more products to their shopping carts, and 33% say it would get them to spend more time in the app. (comScore, 2017)
- The top five preferences of mobile-first shoppers are: in-store pickup for purchases, free gifts with purchase, price matching, coupons, and customer service. (RetailDive, 2017)
- Most consumers use mobile apps to keep up with customer loyalty programs and share purchases, and turn to mobile sites for browsing and store information. (Think With Google, 2016)
- 57% of consumers say they won’t recommend a business with a poorly designed mobile site. (socPub, 2017)
- 63% of smartphone users prefer their shopping apps to require sign in for secure access. (Think With Google, 2016)
- 91% find push notifications from shopping apps useful, with the most helpful notifications being shipping/delivery updates, new discounts, and price reductions for a followed product. (Think With Google, 2016)
Emerging Mobile Technologies Statistics
Discover how new technologies are changing the mobile landscape.
Voice Search & Virtual Assistants
- 20% of mobile queries were made via voice in 2016, and accuracy is now about 95%. (Mary Meeker’s 2017 Internet Trends Report)
- Nearly half (42%) of Americans use digital voice assistants on their smartphones. (Pew Research, 2017)
- The US is embracing voice assistants faster than other regions: 64% of Americans are comfortable using voice assistants in front of others, compared to 43% of Europeans. (Adobe, 2018)
Augmented Reality and Virtual Reality
- Mobile augmented reality is expected to become the primary driver of a $108 billion VR/AR market by 2021. (TechCrunch, 2017)
- Pokémon GO delivered $600 million in mobile AR revenue in its first three months alone. (VentureBeat, 2016)
- 32% of Americans aged 18-24 have tried AR on their phones. (Adobe, 2018)
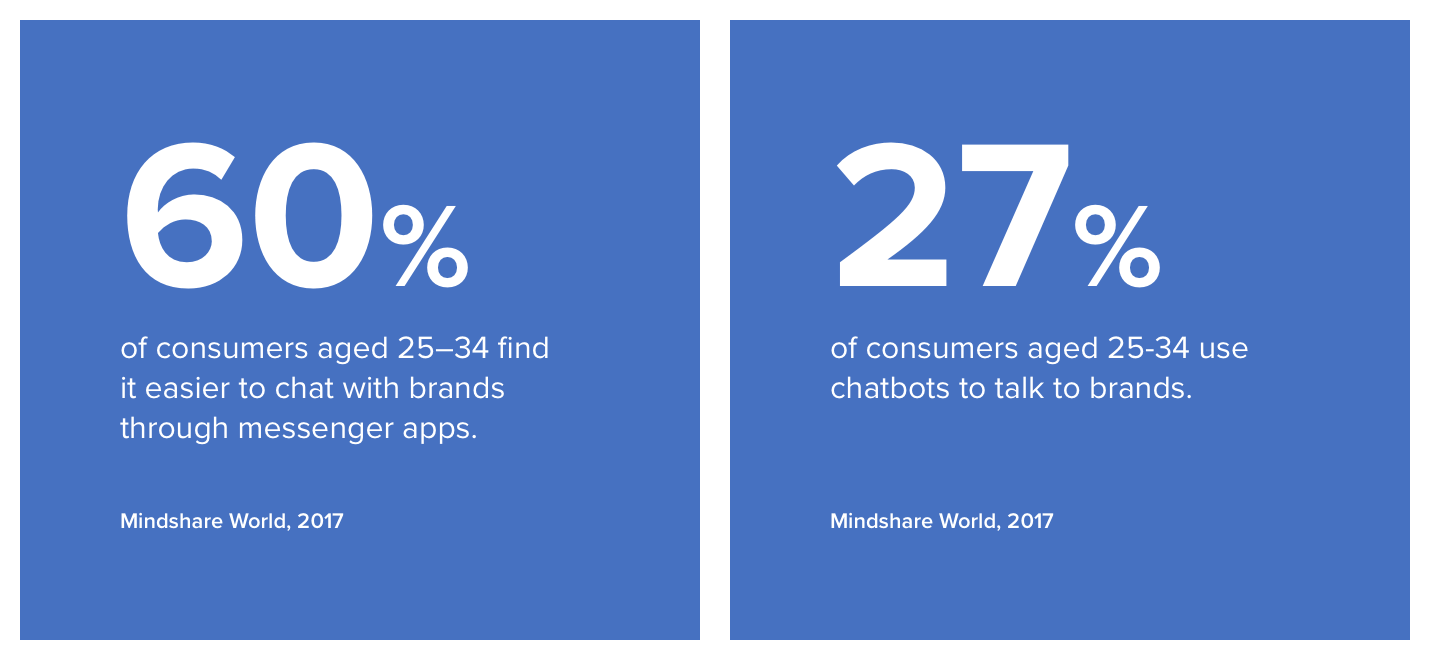
Chatbots
- 9 out of 10 consumers would like to use messaging to talk to businesses. (Twilio, 2016)
- 24% of marketers plan to add messaging apps to their content strategy in the next year. (HubSpot, 2017)
- Three billion people use messaging apps, compared to 2.5 billion social media users. Messaging apps also have nearly double the retention rate of average apps (AdWeek, 2016).
Beacons & Geolocation
- Beacon-triggered messages in the US alone are expected to prompt retail sales worth $44.4 billion. (Statista, 2016)
- Location-based marketing strategies can be 20x more effective than banner ads. (My Total Retail, 2015)
- Local searches are growing 50% faster than mobile searches overall. (Search Engine Land, 2016)
- Location-targeted mobile ad spend will grow from $12.4 billion in 2016 to $32.4 billion in 2021. (BIA/Kelsey, 2017)
Mobile Marketing Industry Statistics
Learn what tactics today’s marketers are incorporating into their strategies.
- 68% of companies have integrated mobile marketing into their overall marketing strategy, and 71% of marketers believe mobile marketing is core to their business. (Salesforce, 2015)
- 58% of companies surveyed have a dedicated mobile marketing team. (Salesforce, 2015)
- 43% of marketers say they use social media shares or likes to measure mobile marketing success. (Statista, 2015)
- 83% of mobile users say that a seamless experience across all devices is very important. (Wolfgang Jaegel, 2015)
- 83% of B2B marketers said mobile apps were important to content marketing. (Strategy Trends, 2015)
- As of March 2017, 42% of small businesses have their own mobile app. (Clutch, 2017)
- User-generated content can generate 6.9% higher engagement than brand-generated content on Facebook. (Mary Meeker’s 2017 Internet Trends Report)
- Personalized marketing campaigns are projected to shift $800 billion of revenue to the 15% of companies that get it right over the next five years. (Monetate, 2017)
- Organizations are experiencing as high as 3x ROI for personalization efforts. (Monetate, 2017)
- Data quality and understanding buyer behavior in context were the two biggest challenges facing businesses when it comes to personalization. (Monetate, 2017)
- 37% of mobile marketers say the top challenge facing mobile advertising in the US is privacy issues. (Statista, 2015)
Expert Mobile Marketing Resources
Check out our collection of articles, free downloadable resources, and interviews with mobile marketing experts for more tips and advice.
See how today’s top brands use CleverTap to drive long-term growth and retention
Shivkumar M 
Head Product Launches, Adoption, & Evangelism.Expert in cross channel marketing strategies & platforms.
Free Customer Engagement Guides
Join our newsletter for actionable tips and proven strategies to grow your business and engage your customers.
