


Table of Contents
Categories
Most Popular


Mobile app churn rate is a critical metric that reflects the percentage of users who stop using an app over a specific period. Understanding this rate is essential for app developers and marketers as it directly impacts user retention and overall business growth.
What is Mobile App Churn Rate?
Mobile app churn rate quantifies user attrition, indicating how many users abandon an app within a defined timeframe.
Tracking app churn is vital for developers and marketers because it helps identify user engagement levels and satisfaction. A high app churn rate can signal underlying issues with the app, such as poor user experience or ineffective marketing strategies.
How to Calculate Mobile App Churn Rate
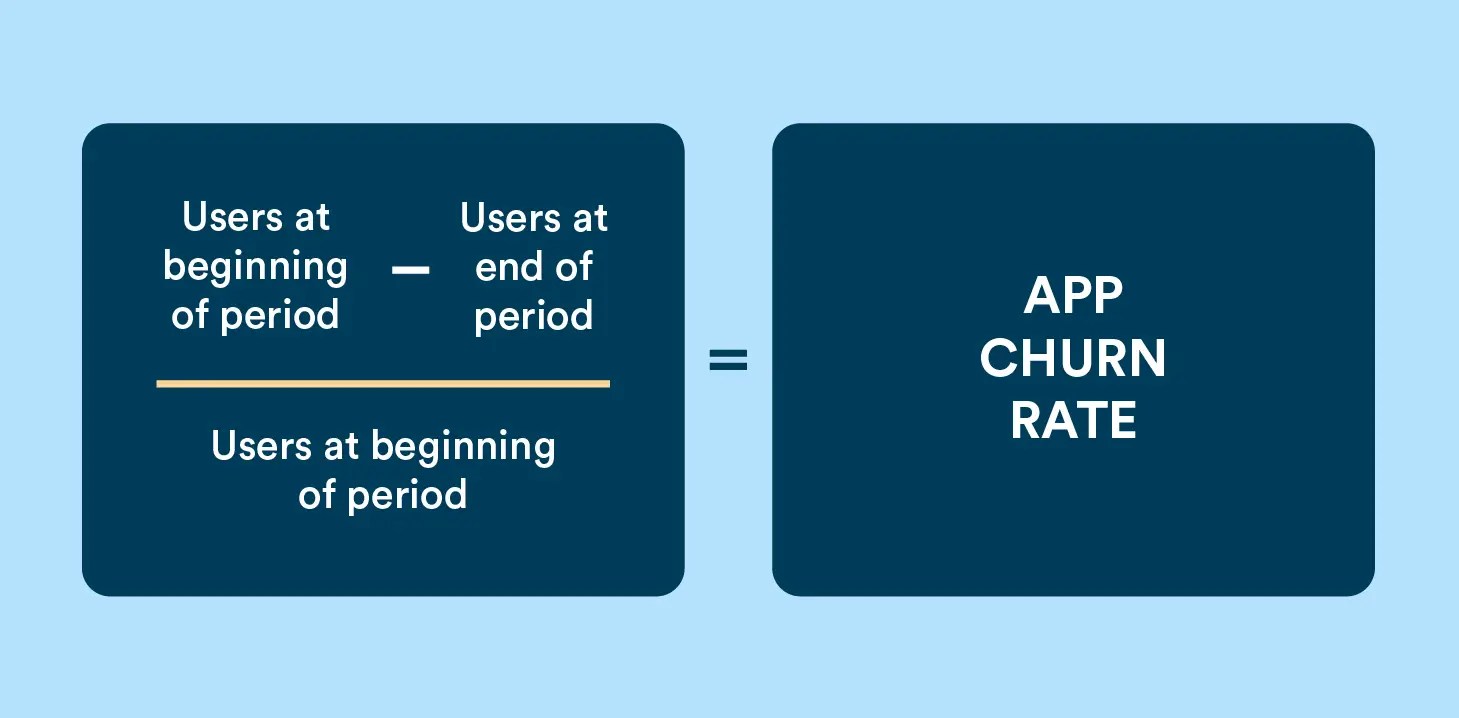
You can use a simple formula to calculate mobile app churn rate. The formula is:
However, calculating app churn rate is just the first step. The real value lies in understanding the underlying factors driving user attrition, which requires comprehensive churn analysis.
Overview of Current App Churn Rate Benchmarks
Analyzing mobile app retention rates reveals significant variations across different categories, providing a look into app churn.
Retention rate measures the percentage of users who continue using an app over a specific period, reflecting user engagement and app value, while churn rate represents the percentage of users who stop using it, making them inverse metrics that reflect user engagement and attrition.
According to data from the first quarter of 2023, news and magazine apps had the highest retention rate after 30 days, at over 9%. In contrast, education apps had a retention rate of less than 2% after the same period.
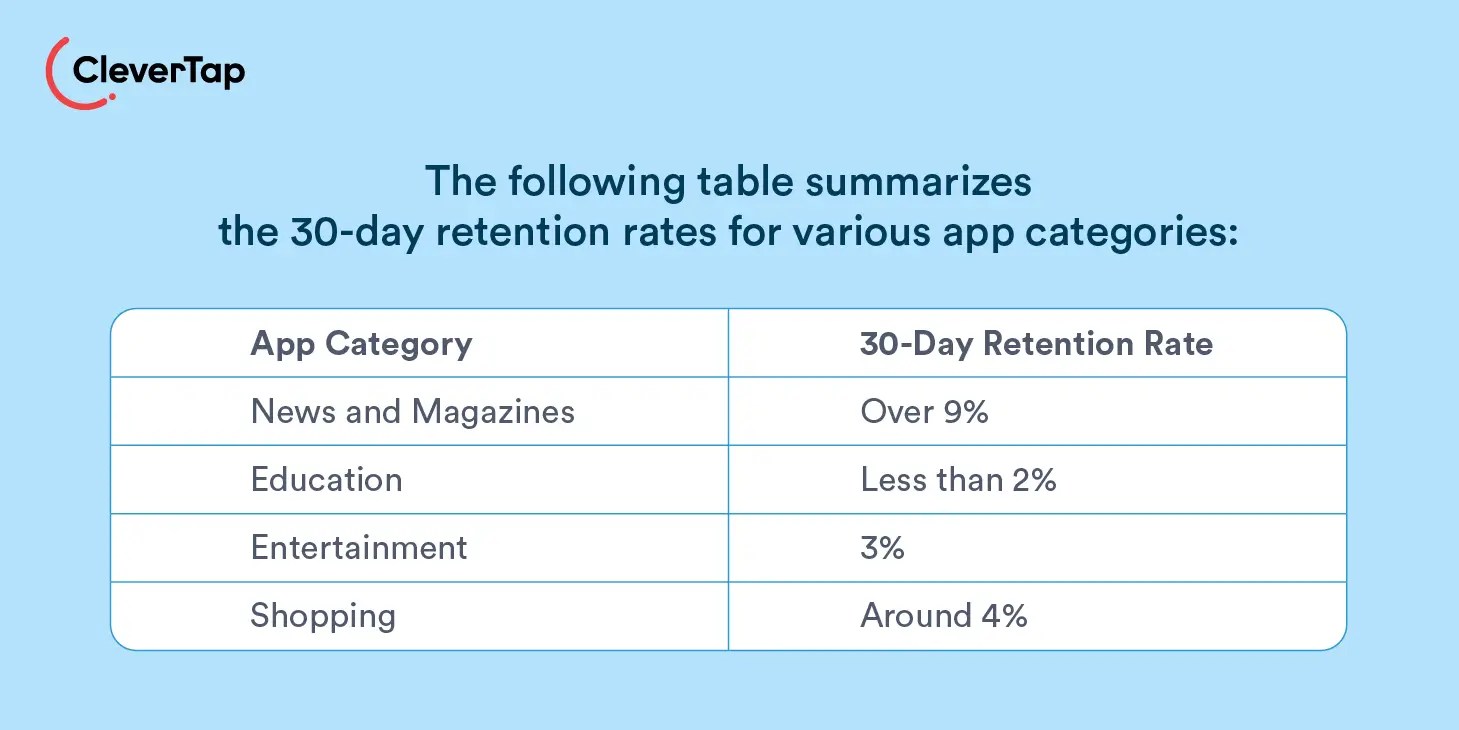
These insights highlight the importance of tailoring user engagement strategies to specific app categories to reduce app churn rates.
Different Time Frames for Measuring App Churn Rate
App churn rates can be measured over various time frames:
Daily App Churn Rate: Useful for apps with frequent usage patterns, such as social media or messaging apps, where user engagement is expected to fluctuate daily.
Weekly App Churn Rate: This metric provides insights into user behavior over a short period. This helps understand retention trends related to weekly challenges or updates in fitness apps.
Monthly App Churn Rate: Provides a broader view, ideal for assessing long-term trends. This view helps understand user retention over time, which is particularly useful for e-commerce, utility, or subscription-based apps that may experience seasonal fluctuations in user engagement.
Here’s an example of calculating the monthly app churn rate:
Users at the start of the month: 2,000
New users added that month: 400
Users lost at the end of the month: 366
Monthly churn rate: 366/2400 = 15.2%
Probable App Churn Rate
Traditional churn rate calculations can become less accurate during periods of rapid growth, particularly for new apps. When your user base is expanding quickly, both churn and new user acquisition can rise simultaneously. If new users are joining at a faster rate than users are churning, the overall churn rate may appear to be decreasing—even when retention issues persist.
The problem? The standard churn calculation can be misleading. A surge in new users can distort the numbers, making it seem like churn is improving when, in reality, it may be worsening.
To address this, consider using probability-based churn calculations. Stephen Noble of Shopify introduced a method that treats churn as a probability rather than a static percentage.
Here’s how it works:
Each day a user remains active is a day they did not churn. Over ten days, for example, a user has ten opportunities to leave the app permanently. This concept, measured in user days, provides a more dynamic view of churn.
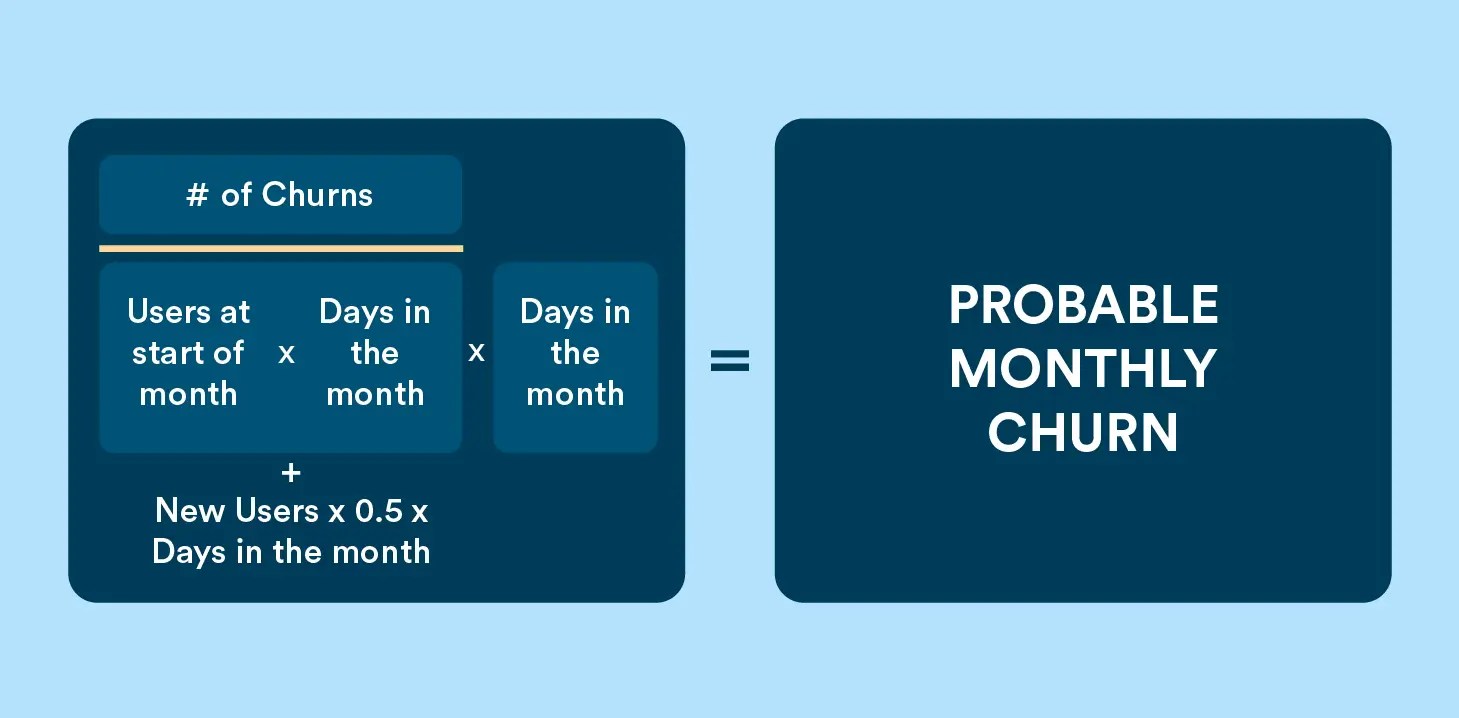
To calculate your probable monthly app churn:
- Count the total number of users who churned that month.
- Divide by the total number of user days in that month to determine churn per user day.
- Multiply by the number of days in the month to estimate the probable monthly churn rate.
Here’s an example equation:
Users at the start of the month: 1,000
Users at the end of the month: 1,322
Net new user gain: 322
Days in month: 30
User days in month: (1,000 x 30) + (0.5 x 322 x 30) = 34,830
Total churns in the month: 366
Churns per day: 366/34,830 = 0.01%
Monthly churn rate: 30 x 0.01% = 0.3%
Notice how this method factors in probabilities? By using this probability-based approach, you gain a clearer picture of user retention and churn trends—one that isn’t skewed by rapid user acquisition.
Factors Influencing Mobile App Churn Rates
Understanding why users leave your app is key to improving retention. Below are the key factors influencing mobile app churn and how to address them effectively.
1. Onboarding Experience
The onboarding process is crucial as it shapes the user’s first impression of the app. A poor app onboarding experience, characterized by lengthy tutorials, confusing interfaces, or lack of guidance, can lead to high app churn rates. Users may become frustrated if they cannot quickly understand how to navigate the app or utilize its features effectively.
Simplifying tutorials, providing interactive guides, and ensuring that new users understand how to navigate the app effectively will help retain them during their initial interactions.
2. User Experience (UX)
A subpar user experience can deter users from returning. Issues such as slow loading times, complex navigation, and unclear calls to action can frustrate users, leading them to abandon the app.
Better UX design includes optimizing loading speeds, simplifying navigation, and ensuring that all features are intuitive and easily accessible.
3. Value Perception
If users don’t see value in the app, they won’t stay. Unmet expectations or unclear benefits contribute to churn.
Reinforce the app’s value through marketing and in-app messaging. Highlight new features and updates to keep users engaged.
4. Customer Support
Frustrating or ineffective customer support can push users to leave, especially when issues aren’t resolved quickly.
Offer multiple support channels, including live chat, email, and FAQs. Ensure responsive and well-trained support teams to improve user satisfaction.
5. Communication Strategies
Too many notifications can annoy users, while too few can lead to disengagement. Balanced communication is key.
Personalize messages based on user behavior, such as reminders for unfinished tasks or tailored offers. Automated engagement campaigns can also boost retention.
6. Competitive Landscape
The competitive nature of the app market means that users have numerous alternatives at their fingertips. If competitors offer better features or more engaging experiences, users may quickly switch apps, leading to higher app churn rates for less competitive offerings.
Keeping an eye on competitors’ offerings and updating frequencies can provide insights into market trends and user expectations. Regularly updating your app with meaningful improvements can help maintain user interest and loyalty.
7. Target Audience Fit
Attracting the wrong audience results in higher churn, as users quickly abandon apps that don’t meet their needs.
Conduct thorough market research to align the app with the right audience. Tailor marketing efforts to attract users who are more likely to stay engaged.
Strategies to Reduce Mobile App Churn Rate
Let’s look at some additional strategies you can employ to reduce mobile app churn.
1. Optimize Onboarding
If users don’t immediately see your app’s core value, they’ll churn. A seamless onboarding experience should:
- Highlight key benefits upfront.
- Reduce friction—keep steps minimal and intuitive.
- Guide users to their “aha” moment as quickly as possible.
2. Leverage Push Notifications
Triggered push notifications can drive re-engagement, encourage repeat visits, and boost conversions. To be effective:
- Personalize messages based on user behavior.
- Choose the best time to send push notifications to maximize impact.
- Use them to re-engage users at risk of churning.
3. Personalize the User Experience
Generic engagement campaigns don’t work. Users respond to relevant, tailored interactions. Personalization should include:
- Behavioral data like search and purchase history.
- Device type, location, and user preferences.
- Customized recommendations and offers.
4. Implement Deep Linking
Deep linking enhances user experience by directing users to specific in-app screens instead of just opening the app’s homepage. This allows you to:
- Take users directly to relevant content or products.
- Resume sessions from where they left off.
- Improve navigation and reduce drop-off rates.
5. Utilize In-App Messaging
In-app messages provide real-time engagement opportunities. Use them to:
- Welcome new users and introduce key features.
- Promote special offers when users browse specific products.
- Guide users toward actions that increase retention.
5. Utilize Data Analytics
Leveraging data analytics tools can help identify patterns in user behavior that lead to churn. By analyzing usage data, developers can pinpoint where users drop off in their engagement journey and implement changes accordingly. A/B testing different features or onboarding processes can also yield insights into what works best for retaining users.
Analysing and Reducing Mobile App Churn Rate With CleverTap
With CleverTap, you can use cohort analysis to reduce churn. Once you’ve established baseline retention rates, cohort analysis helps you pinpoint where to focus your retention efforts.
Instead of viewing all users as a single group, cohort analysis segments them into related groups based on shared characteristics. By comparing these cohorts over time, you can uncover why users leave and what drives retention. Key factors to analyze include:
- Acquisition Channel: Where do your most engaged users come from? (Search, social, paid ads, referrals, etc.)
- User Actions: What key actions correlate with long-term engagement? (Creating an account, adding friends, making a purchase, etc.)
- Time to Value: How quickly do successful users complete key actions? (Within an hour, a day, a week?)
Cohort data reveals patterns that highlight what hooks new users and keeps them engaged. A cohort graph provides a visual representation:
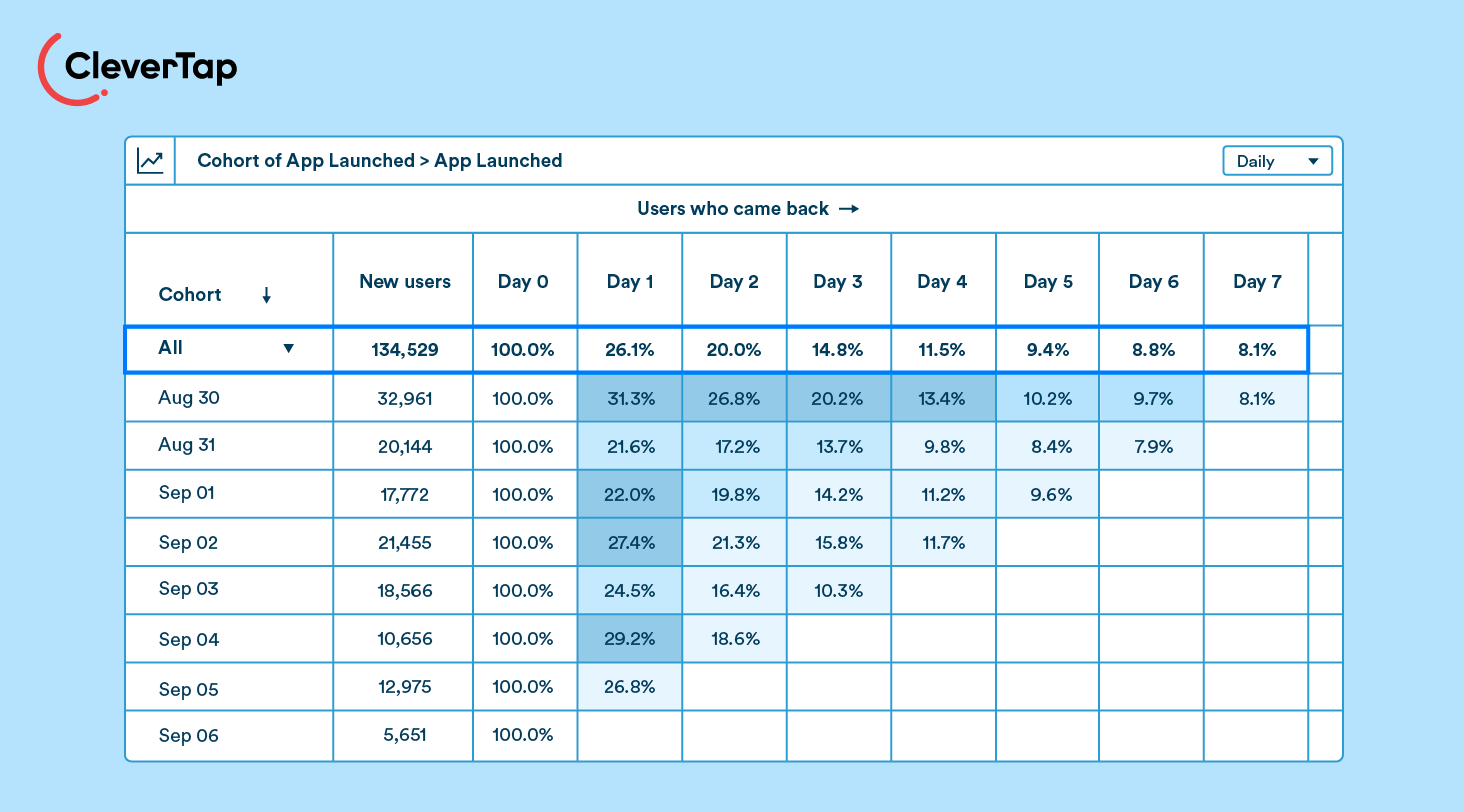
- The y-axis represents groups of new users by their sign-up date.
- The x-axis tracks their activity over time—Day 0 (install), Day 1, Day 2, etc.
With this, you can see exactly where retention drops and identify critical moments in the user journey.
Identifying Churn Patterns with Cohort Analysis
Consider a food delivery app. You notice that new users typically place their first order within three days of installing the app. However, engagement drops sharply in the second week, and by the end of the first month, many users churn.
Breaking the data down into cohorts reveals a key insight:
- Users who launch the app between 10 and 11 AM tend to place regular orders.
- Those who open it after noon often close the app within 90 seconds or abandon their cart.
- 98% of late-openers churn within the first month.
With this knowledge, you can implement targeted strategies:
- Send a personalized push notification between 10 and 11 AM, reminding users to order lunch—ideally with a promo code.
- Test different messaging and incentives to see what drives engagement.
By segmenting users into cohorts, you uncover hidden behavioral trends that allow you to take proactive steps to reduce churn and boost retention.
Conclusion
Understanding and managing mobile app churn rate is crucial for developers and marketers aiming to enhance user retention and drive growth. By focusing on user experience, effective marketing strategies, and continuous engagement efforts, apps can significantly reduce their app churn rates and foster a loyal user base.
Agnishwar Banerjee 
Leads content and digital marketing.Expert in SaaS sales, marketing and GTM strategies.
Free Customer Engagement Guides
Join our newsletter for actionable tips and proven strategies to grow your business and engage your customers.
