


Table of Contents
Categories
Most Popular


Acquiring new customers costs five to seven times more than retaining existing ones. That’s why businesses should track the right customer retention metrics and data to improve retention efforts.
When existing customers make repeat purchases, businesses can reduce the resources spent on attracting new ones. These KPIs help build strategies to keep customers engaged and encourage them to buy more. Some of these metrics can also help predict churn and optimize strategies accordingly.
This blog will cover 14 important customer retention metrics and key performance indicators (KPIs), highlighting their role in improving customer retention. You will also find actionable strategies to improve these metrics.
What are Customer Retention Metrics?
Customer retention metrics measure how effectively a business retains its customers over time. They provide insights into customer satisfaction throughout the buyer journey and the overall health of the customer relationship.
Businesses can use these customer retention KPIs to assess the success of their retention, identify areas for improvement, and predict future revenue opportunities. Metrics indicating higher retention mean the customers are satisfied with the business offerings and are more likely to be loyal customers who come back to buy more.
14 Customer Retention Metrics and KPIs At a Glance
Mentioned below are 14 important customer retention metrics to help businesses track their customer loyalty and satisfaction levels. Choose the KPIs that best align with your business goals.
Key Customer Retention Metrics to Track
- Customer Retention Rate (CRR): The percentage of customers businesses retain over a certain time frame, with a higher rate meaning stronger customer loyalty and satisfaction.
- Customer Churn Rate: Percentage of customers who stop doing business with the brand during a given period. A high churn rate may indicate unsatisfied customers.
- Revenue Churn Rate: Percentage of revenue lost from existing customers over a specific period. Helps understand the financial impact of churn.
- Average Order Value: The average amount a customer spends per transaction with the business.
- Customer Lifetime Value (CLV): The total revenue the business expects to generate from a customer throughout their relationship. It reflects the value of retaining loyal customers.
- Net Promoter Score (NPS): Measures the likelihood of customers recommending your business to others. Indicates customer loyalty and overall brand perception.
- Repeat Purchase Rate: Measures the percentage of repeat buyers; a high rate indicates a positive customer experience.
- Customer Satisfaction Score (CSAT): Measures customer satisfaction levels for a specific interaction, product, or service.
- Customer Health Score: Combines multiple data points to indicate the overall strength of the customer’s relationship with the business.
- Monthly Recurring Revenue (MRR): The predictable income a customer generates every month for the business.
- Product Stickiness: Measures how often users return to and actively engage with the product.
- Customer Effort Score (CES): Quantifies the effort customers put into interacting with the business and indicates areas where experience can be improved.
- Purchase Frequency: The number of purchases a customer makes within a certain period of time.
- Product Return Rate: Percentage of sold products returned by customers.
Why You Should Track These Customer Retention Metrics
Explore why these customer retention metrics are important and learn more about their formulas.
1. Customer Retention Rate (CRR)
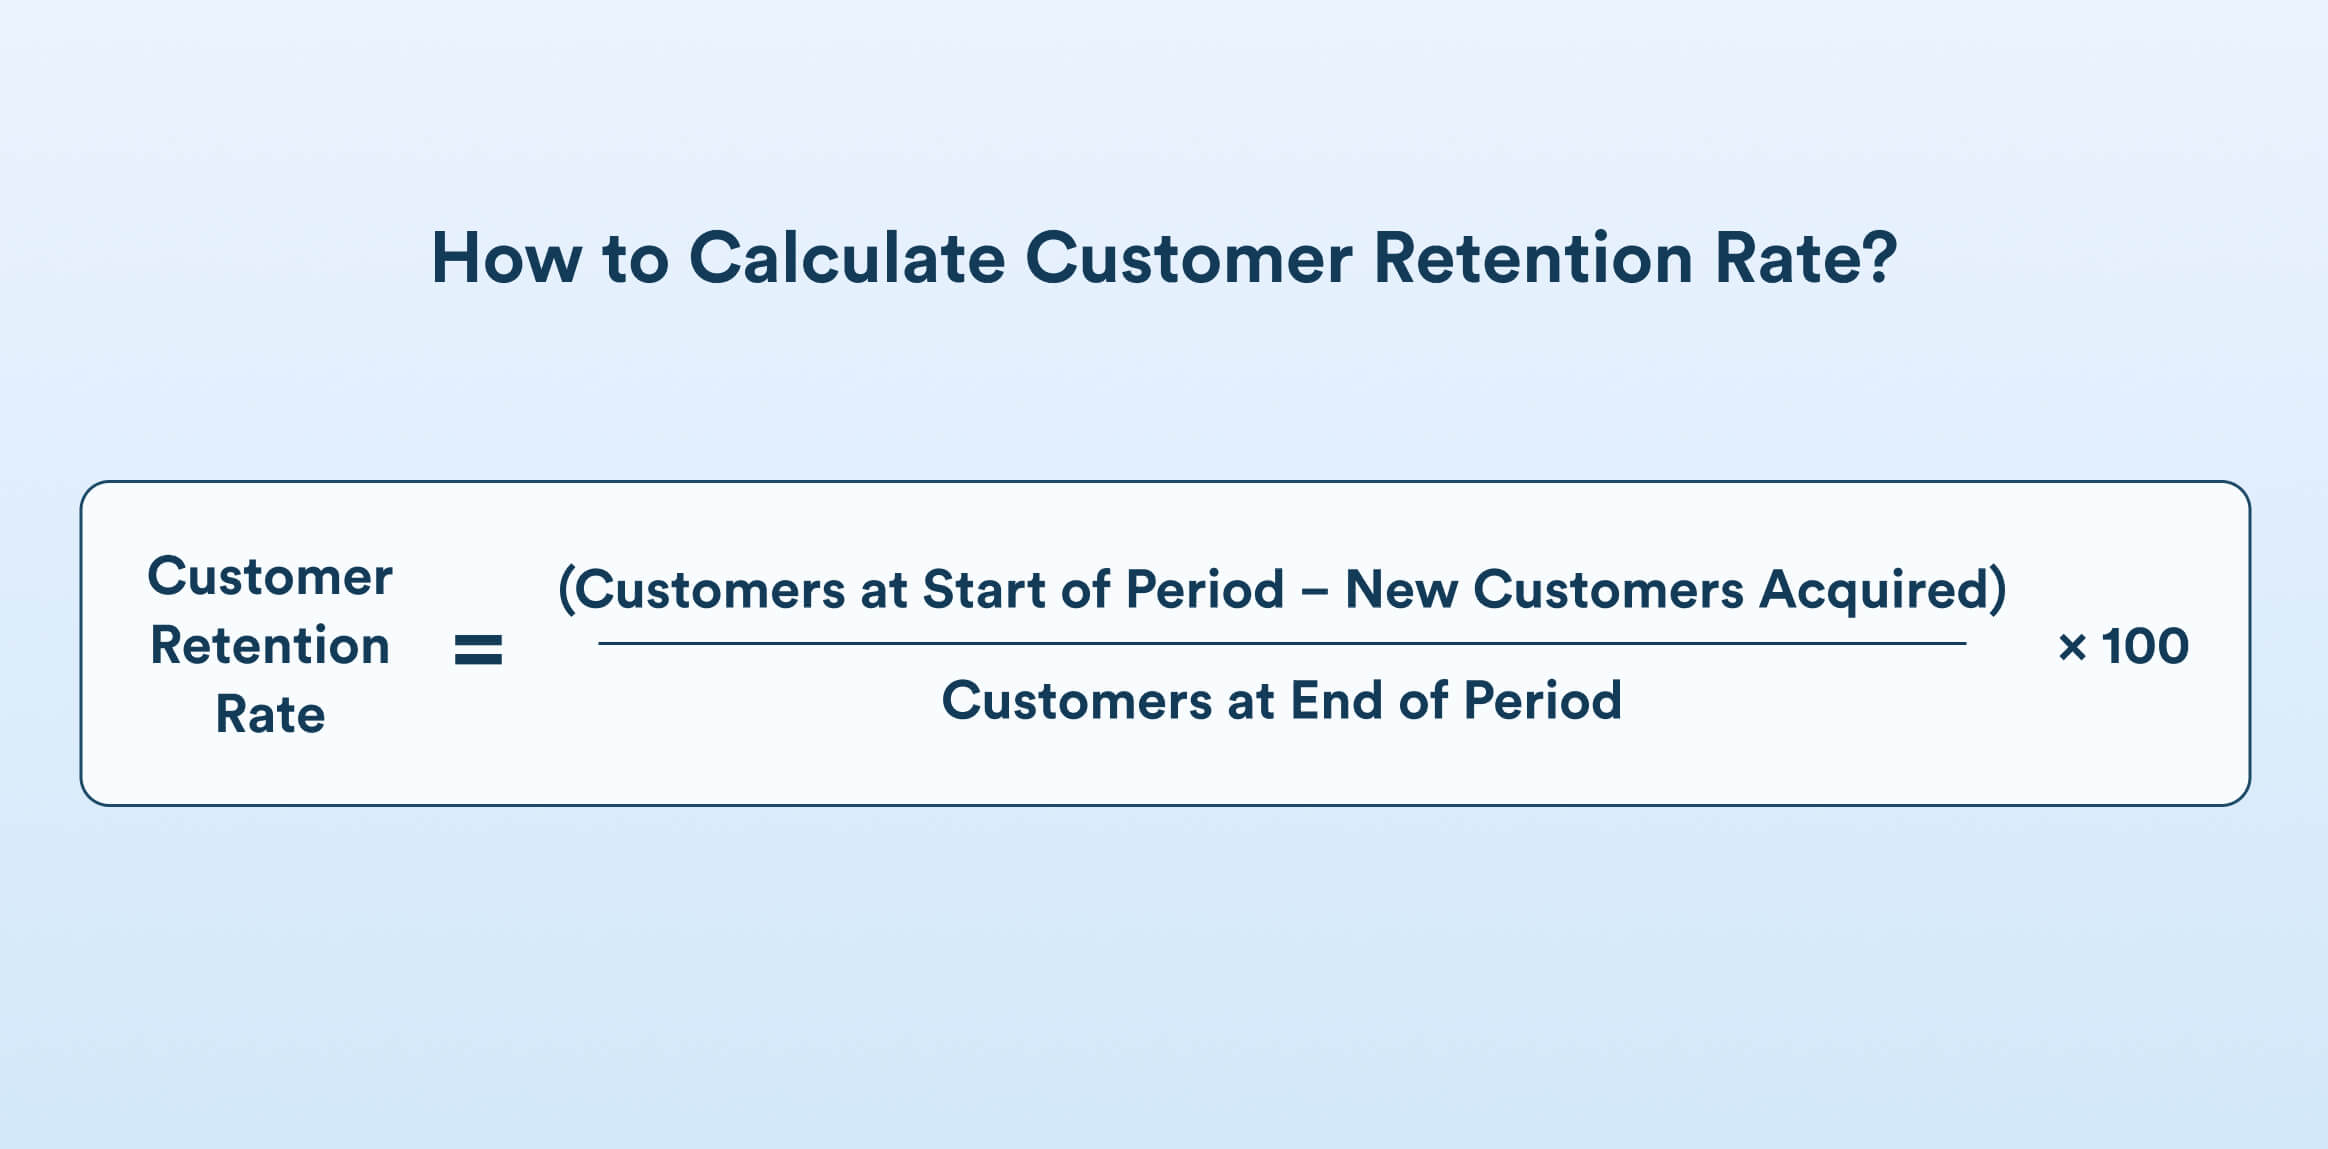
Customer retention rate is a measure of the percentage of customers a business keeps over a specific period. This excludes new customers acquired during that period. The metric shows how well a business consistently provides value and builds long-term relationships that prompt customers to maintain brand loyalty. A high customer retention rate indicates satisfied and loyal customers, whereas a low rate means potential problems.
Loyal customers tend to spend more, participate in word-of-mouth marketing, and stay longer, thus contributing to stable revenue and business growth. The longer customers stick around, the more valuable they become to your business.
How to Calculate Customer Retention Rate?
CRR = {(Customers at Start of Period − New Customers Acquired) / Customers at End of Period} × 100
The average customer retention rate across industries is about 75.5%. The table below offers an industry-wise breakdown of retention rates. You can use these as benchmarks to improve your retention strategy.
| Industry | Retention Rate (In %) |
| Media and Professional Services | 84 |
| Retail | 63 |
| Hospitality, Travel, and Restaurant Industry | 55 |
| SaaS | 50-68 |
How to Improve Customer Retention Rate?
Go the extra mile and make customers feel special by personalizing communications and tailoring them to each customer’s preference and behavior. Offer incentives to repeat buyers and set up customer loyalty programs. Be proactive in following up and providing relevant updates so that customers consistently find value in your business offerings.
2. Customer Churn Rate
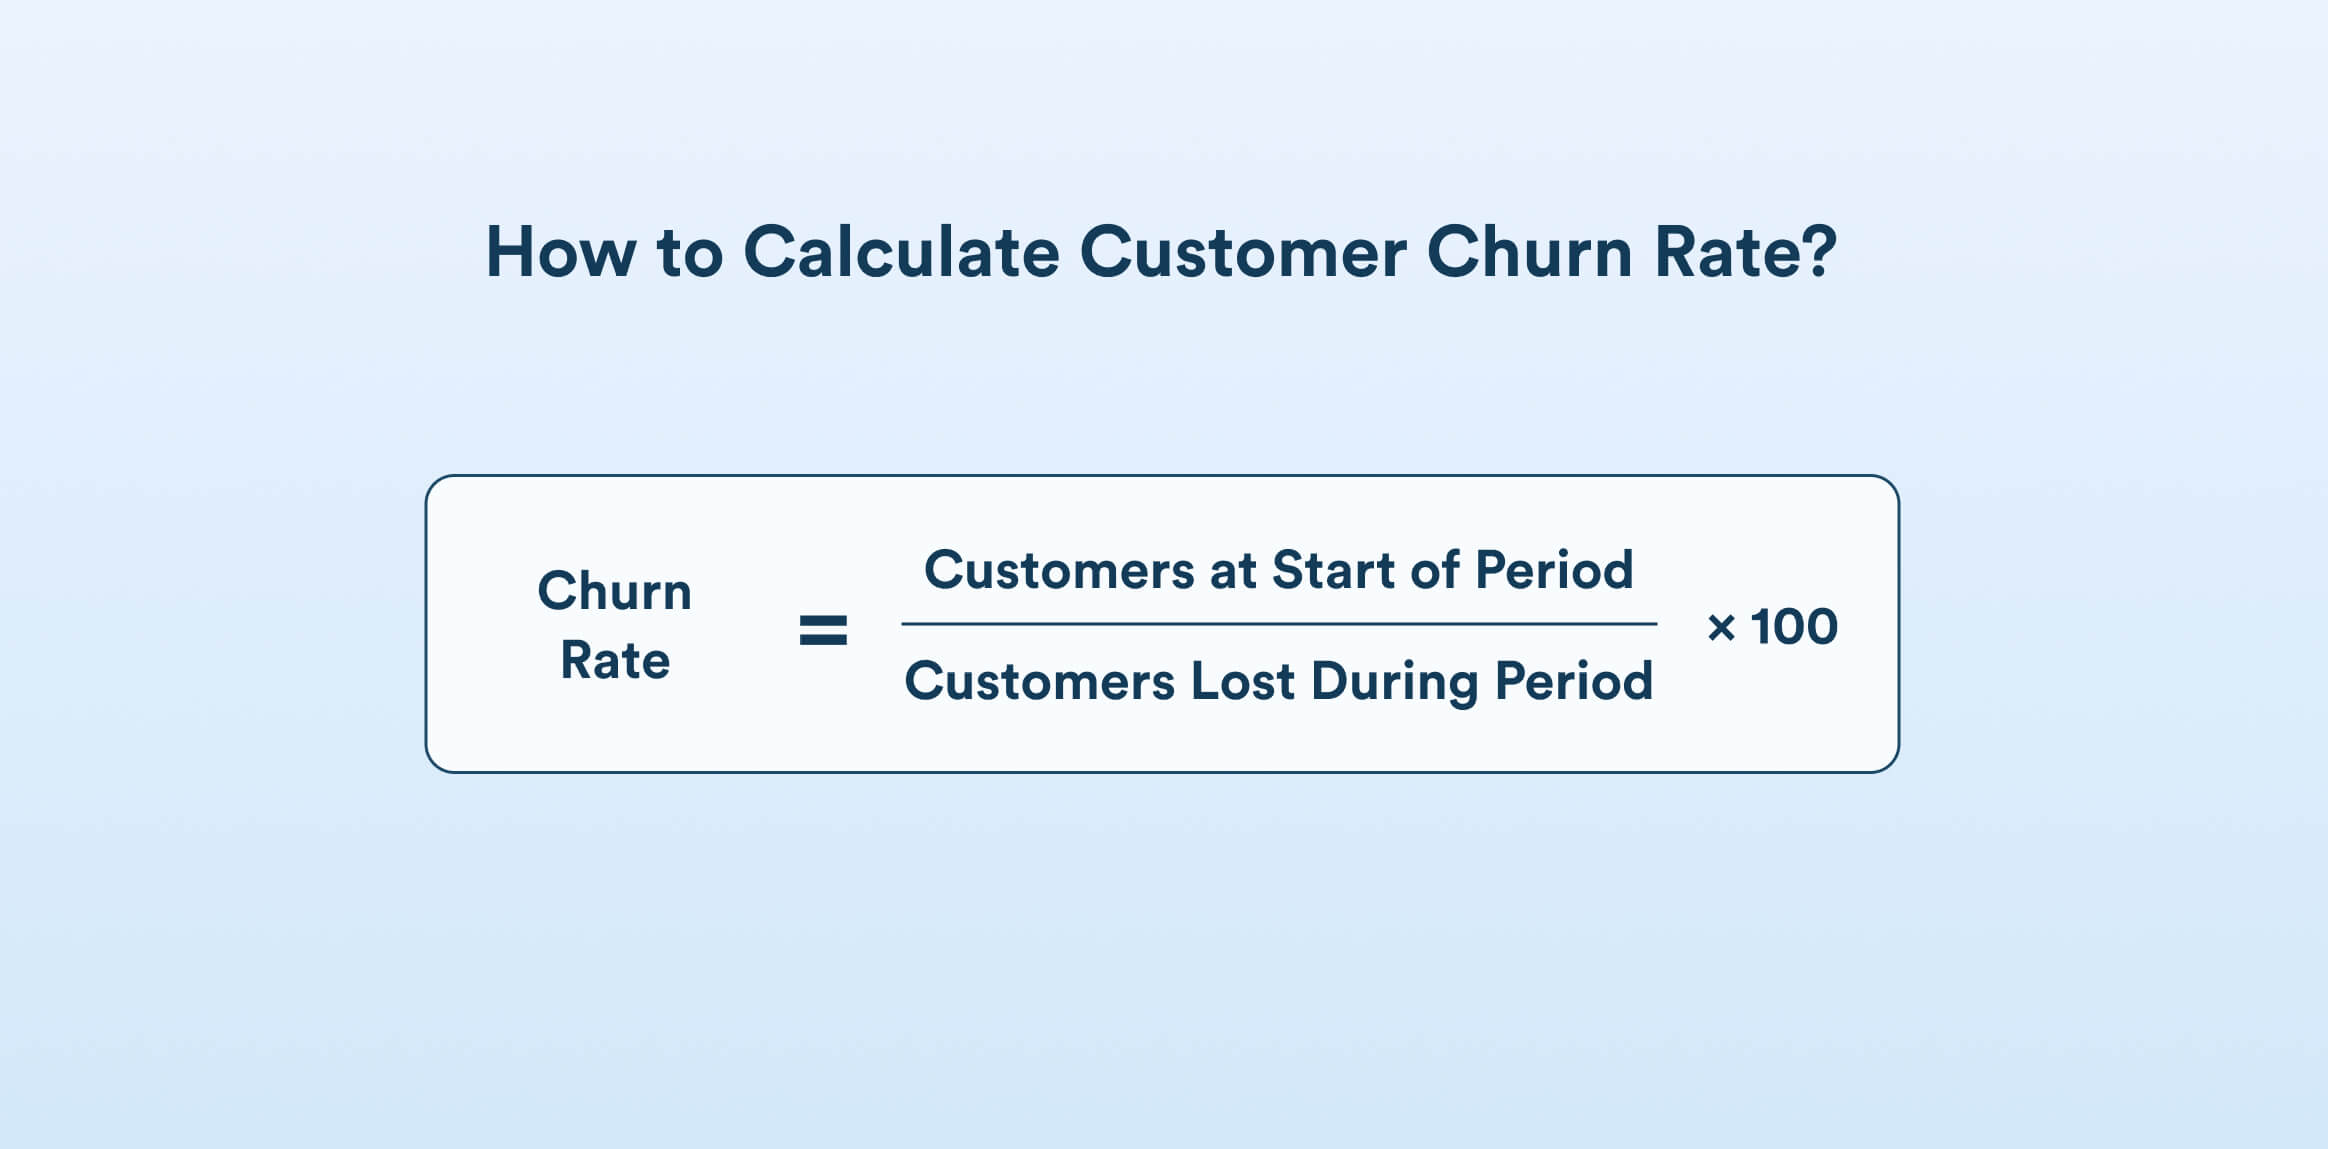
Churn rate denotes the percentage of customers who stop using your product or service over a specific period. It is a vital sign of your company’s health. A high churn rate denotes problems like customer dissatisfaction, better competition, or a mismatch between what your business offers and what customers need. A low churn rate suggests customers are happy and loyal, which is great news for long-term business and revenue growth.
How to Calculate Customer Churn Rate?
Churn Rate = ( Customers at Start of Period / Customers Lost During Period ) × 100
Not all customers leave for the same reasons. Some might churn because they found a better option elsewhere, while others may leave because they no longer need the product or service. Break down the rates by customer segment or cohort for deeper insights.
How to Reduce Customer Churn Rate?
The first step is to understand why customers are leaving by using customer feedback and short exit surveys. Businesses can use the updated customer preference data to optimize and personalize interactions to better suit the changing interests and customer needs. Ensure that the customer support provided is exceptional and all complaints are handled promptly.
Read this complete guide on how to conduct churn analysis.
3. Revenue Churn Rate
Revenue churn rate is the percentage of monthly recurring revenue (MRR) lost from existing customers over a specific time period. The possible causes for a revenue churn can be an order cancellation, a subscription plan downgrade, or a product switch. The metric is a critical indicator of customer satisfaction. Track revenue loss on an individual customer level at periodic intervals.
How to Calculate Revenue Churn Rate?
Revenue Churn Rate = (Churned MRR / Total MRR at the beginning of the period) × 100

How to Reduce Revenue Churn Rate?
The strategy to reduce revenue churn rate is the same as the one to reduce overall churn. The only difference is that this metric focuses more on individual customers rather than having a bird’s-eye view.
4. Average Order Value (AOV)
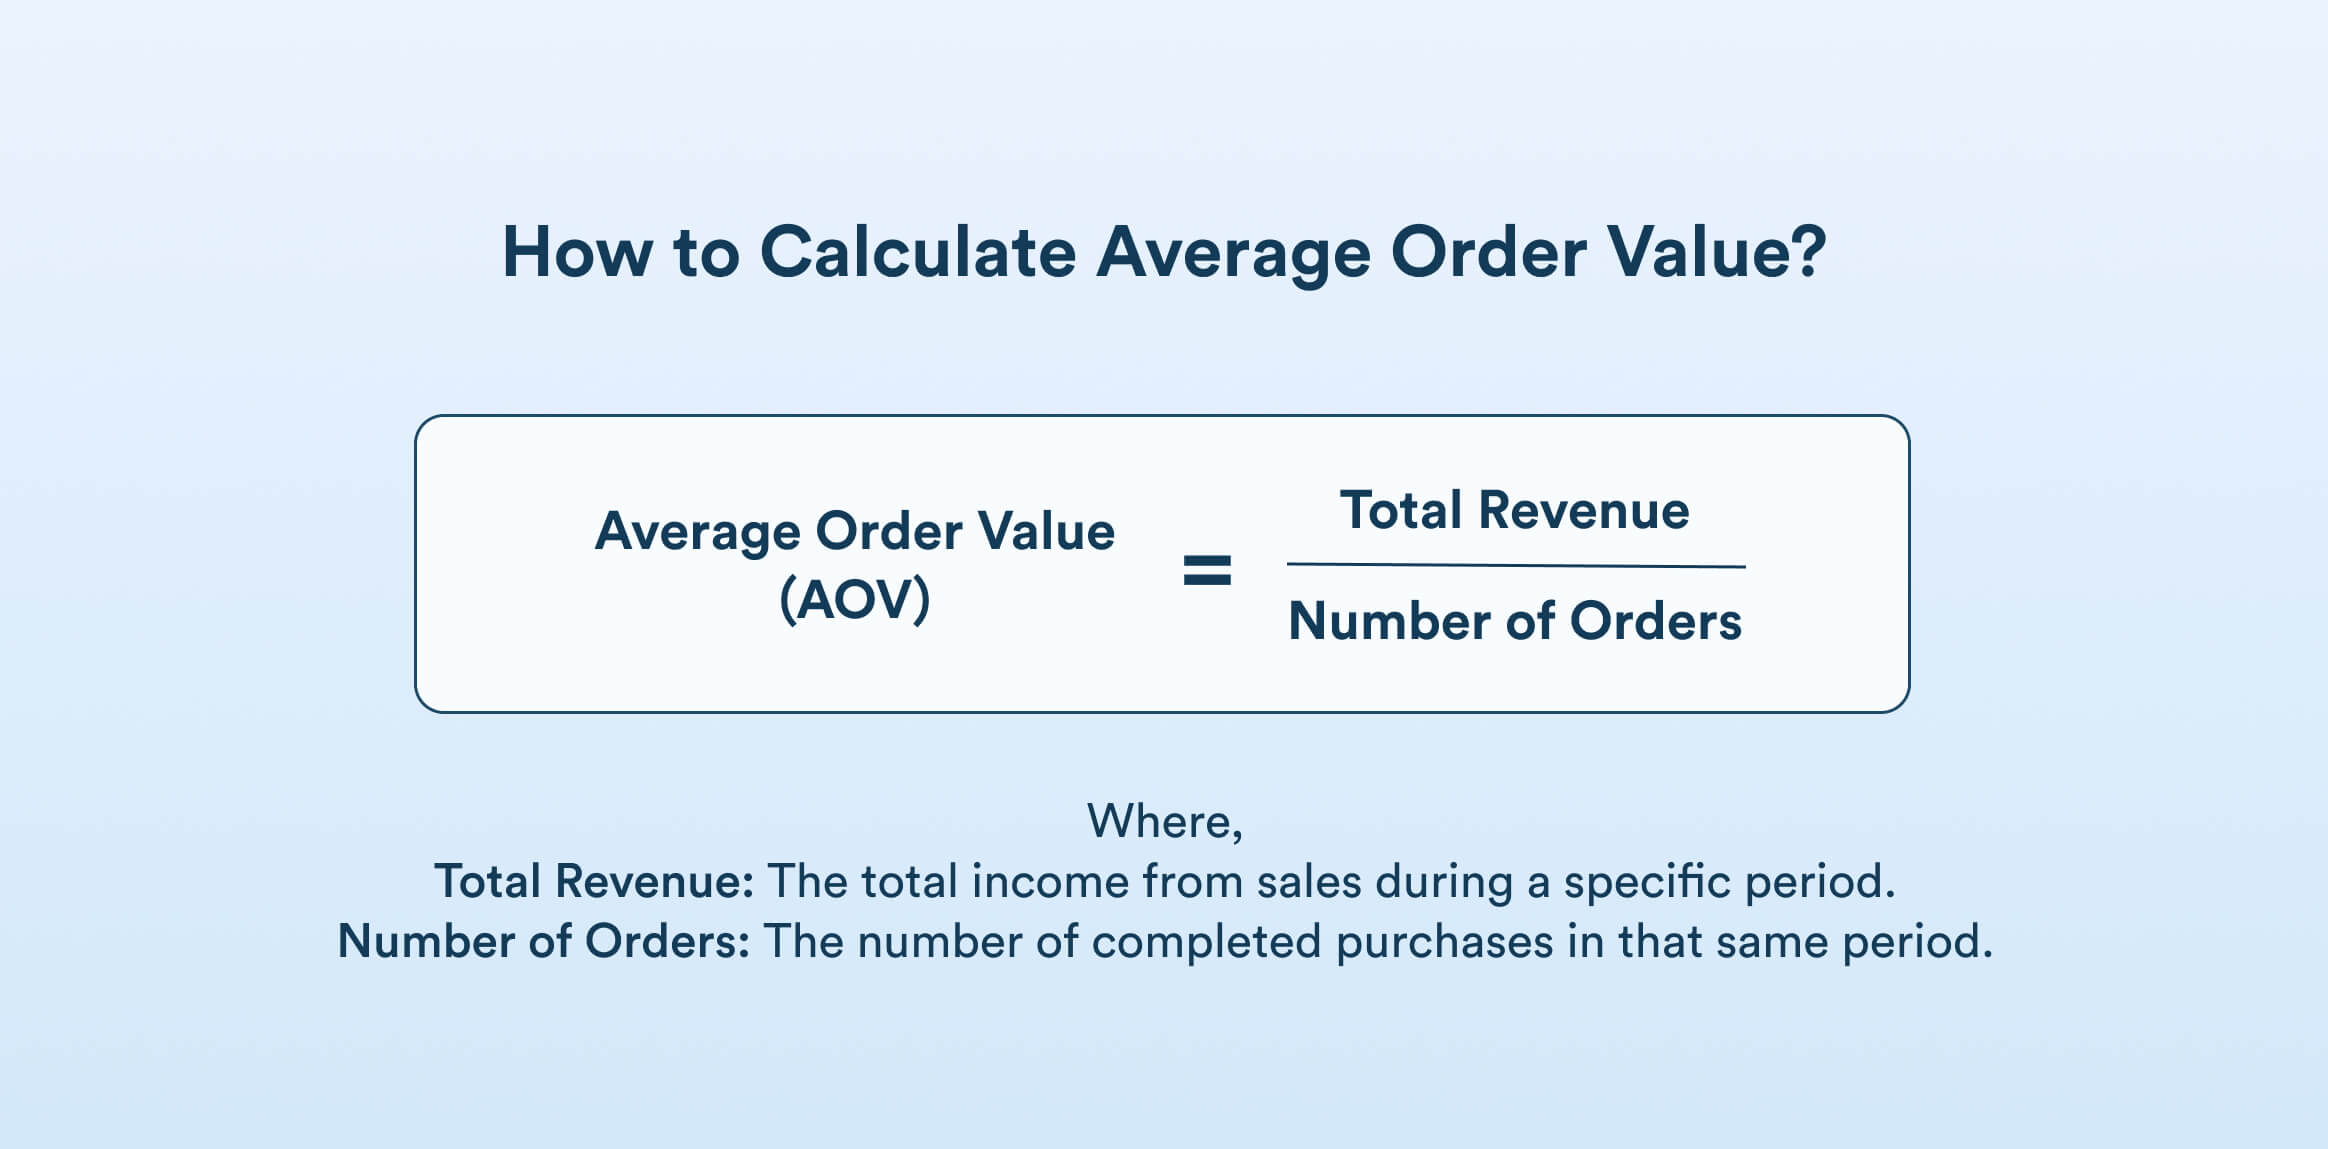
Average order value (AOV) tells you how much, on average, each customer spends per transaction. It’s crucial for understanding customer buying behavior, optimizing marketing spend, and driving higher revenue without necessarily increasing the number of customers. Knowing how much customers typically spend helps in revenue forecasting and managing inventory.
A high AOV indicates customers are purchasing more or higher-value items. Tracking the metric helps identify successful upselling or bundling strategies for products that drive the most value. Businesses can adjust pricing and study its impact on customer spend using this KPI.
How to Calculate Average Order Value?
Average Order Value (AOV) = Total Revenue / Number of Orders
Where,
Total Revenue: The total income from sales during a specific period.
Number of Orders: The number of completed purchases in that same period.
How to Increase Average Order Value?
To increase AOV, businesses can implement strategies like:
- Upselling, cross-selling, and bundling products
- Volume discounts
- Free shipping thresholds
- Personalized recommendations
- Limited-time offers
- Loyalty programs
- A smooth checkout process
5. Customer Lifetime Value (CLV)
Customer lifetime value (CLV) is the total revenue a business can expect to generate from a customer throughout their entire relationship with the company. This metric quantifies customer loyalty. Tracking and improving CLV is crucial because it directly relates to the company’s growth, profitability, and retention efficiency, by offering a long-term perspective on customer relationships.
Companies with high CLV tend to be more resilient and can better withstand competitive pressures as they rely on lasting customer relationships instead of one-time transactions.
How to Calculate Customer Lifetime Value?
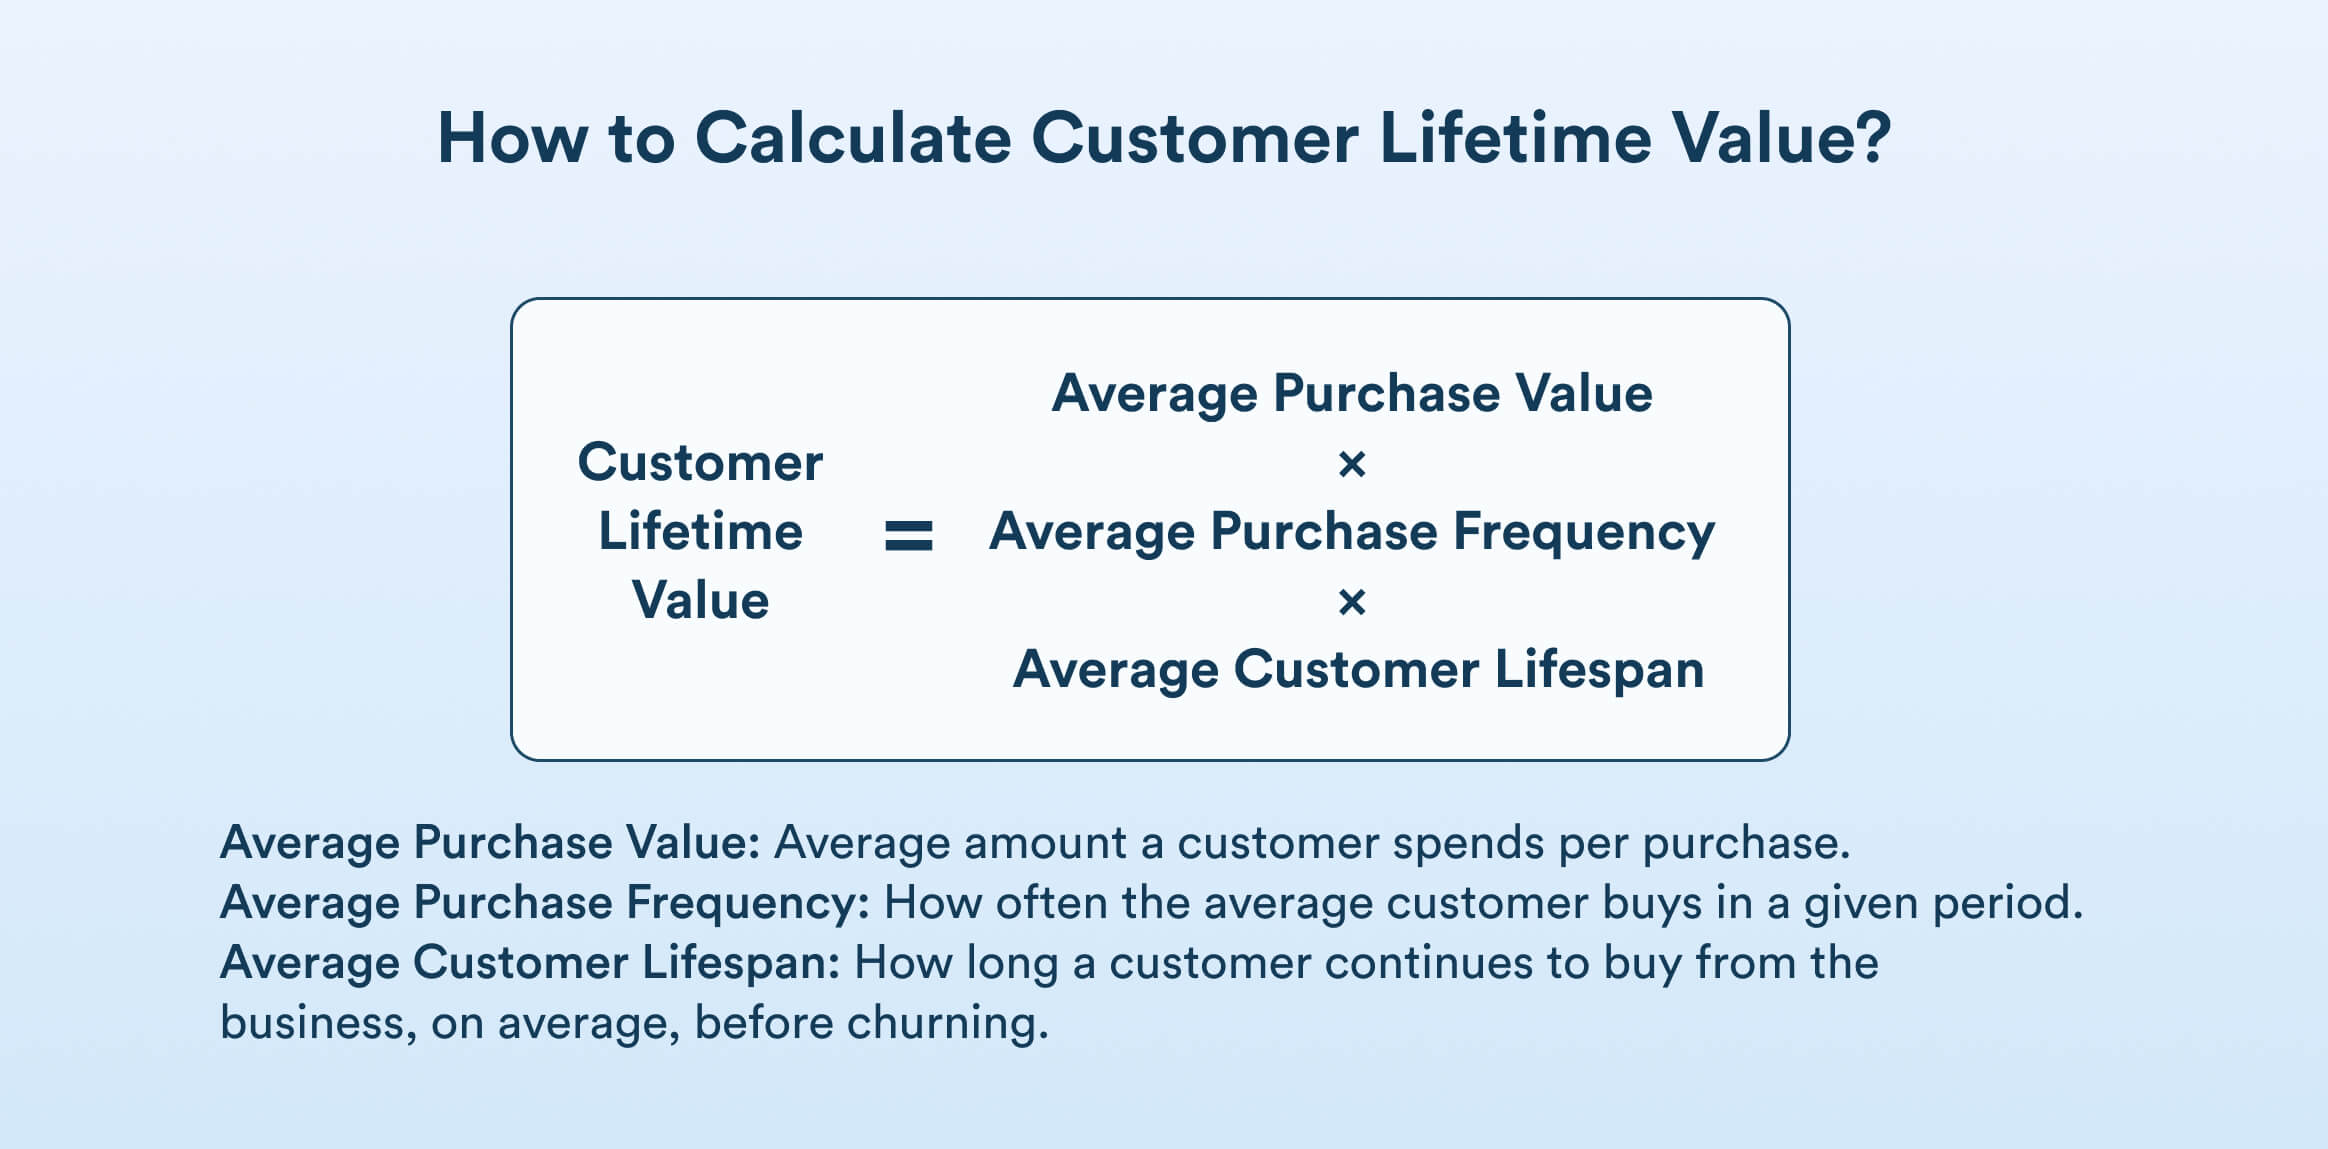
Customer Lifetime Value = Average Purchase Value × Average Purchase Frequency × Average Customer Lifespan
Where:
- Average Purchase Value: Average amount a customer spends per purchase.
- Average Purchase Frequency: How often the average customer buys in a given period.
- Average Customer Lifespan: How long a customer continues to buy from the business, on average, before churning.
How to Increase Customer Lifetime Value?
Businesses should focus on the following to increase CLV:
- Improved customer experience with personalized communication and consistent engagement
- Loyalty programs, and targeted upselling and cross-selling to boost retention and repeat purchases
6. Net Promoter Score (NPS)
Net promoter score (NPS) measures how likely customers are to recommend your business to others. Businesses use surveys to ask customers the question:
“On a scale of 0 to 10, how likely are you to recommend our business to a friend or colleague?”
The score is calculated based on responses to this question, and the customers are categorized as:
- Promoters (9–10): Loyal enthusiasts who refer others.
- Passives (7–8): Satisfied but unenthusiastic customers, vulnerable to competitors.
- Detractors (0–6): Unhappy customers with a poor experience.
How to Calculate Net Promoter Score?
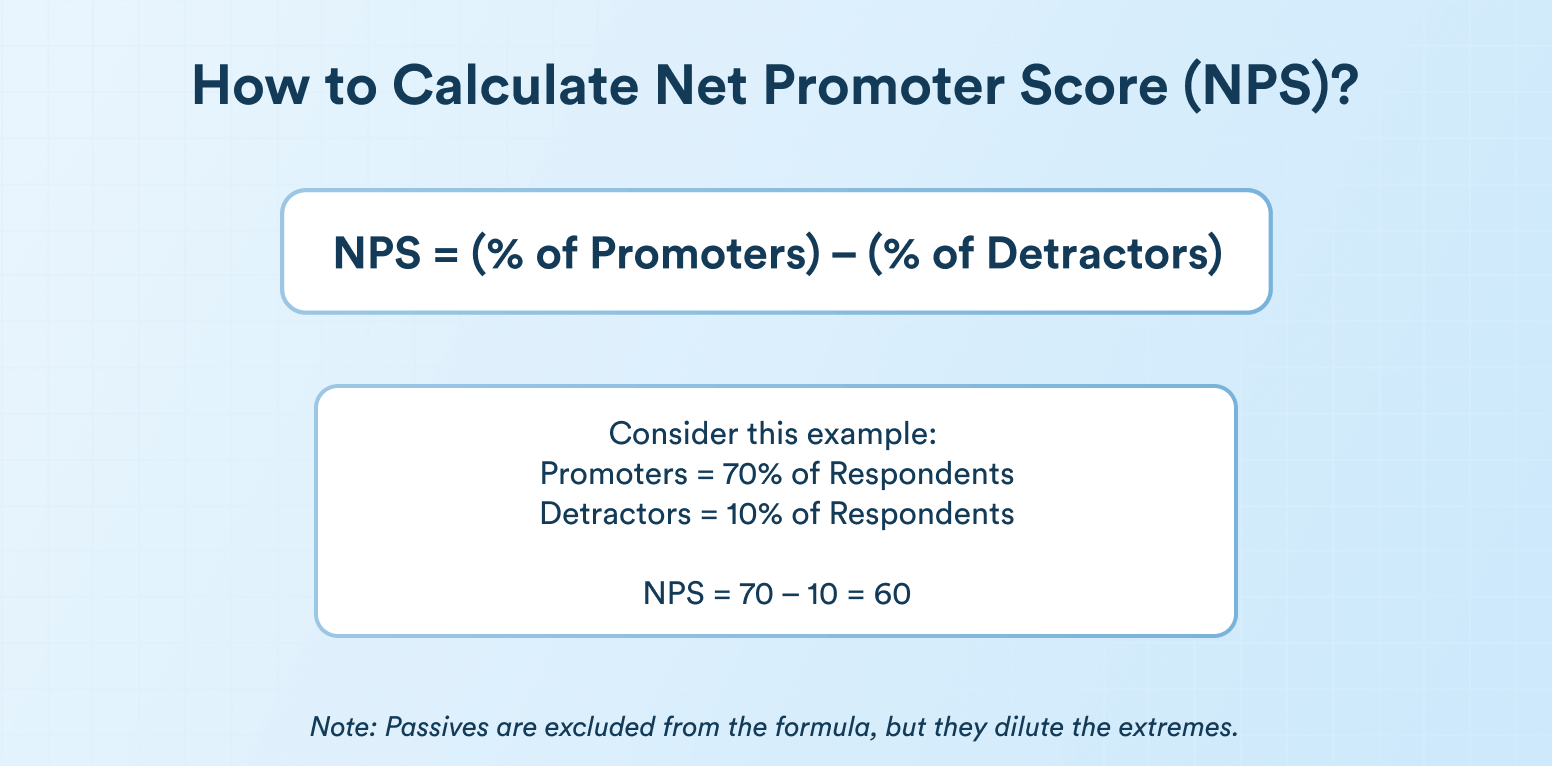
NPS = % Promoters − % Detractors
The score acts as a pulse check for businesses to track whether their customers are promoting or are likely to promote the brand, or do they run the risk of losing unsatisfied customers. A declining NPS can predict customer churn, preparing the business to optimize their retention strategies. The scoring system allows brands to compare customer sentiment across products, teams, or even against industry standards.
How to Improve Net Promoter Score?
Strategies to improve NPS include:
- Prompt action on customer feedback, especially from the detractors
- Deliver timely, empathetic, and effective service to build trust and satisfaction
- Segment users and personalize interactions aligned with individual customer needs
7. Repeat Purchase Rate (RPR)
The percentage of existing customers who make at least one additional purchase from the business is called the repeat purchase rate. This metric is a general indicator of customer loyalty and is often used by businesses to assess the impact of their user retention strategy.
How to Calculate Repeat Purchase Rate?
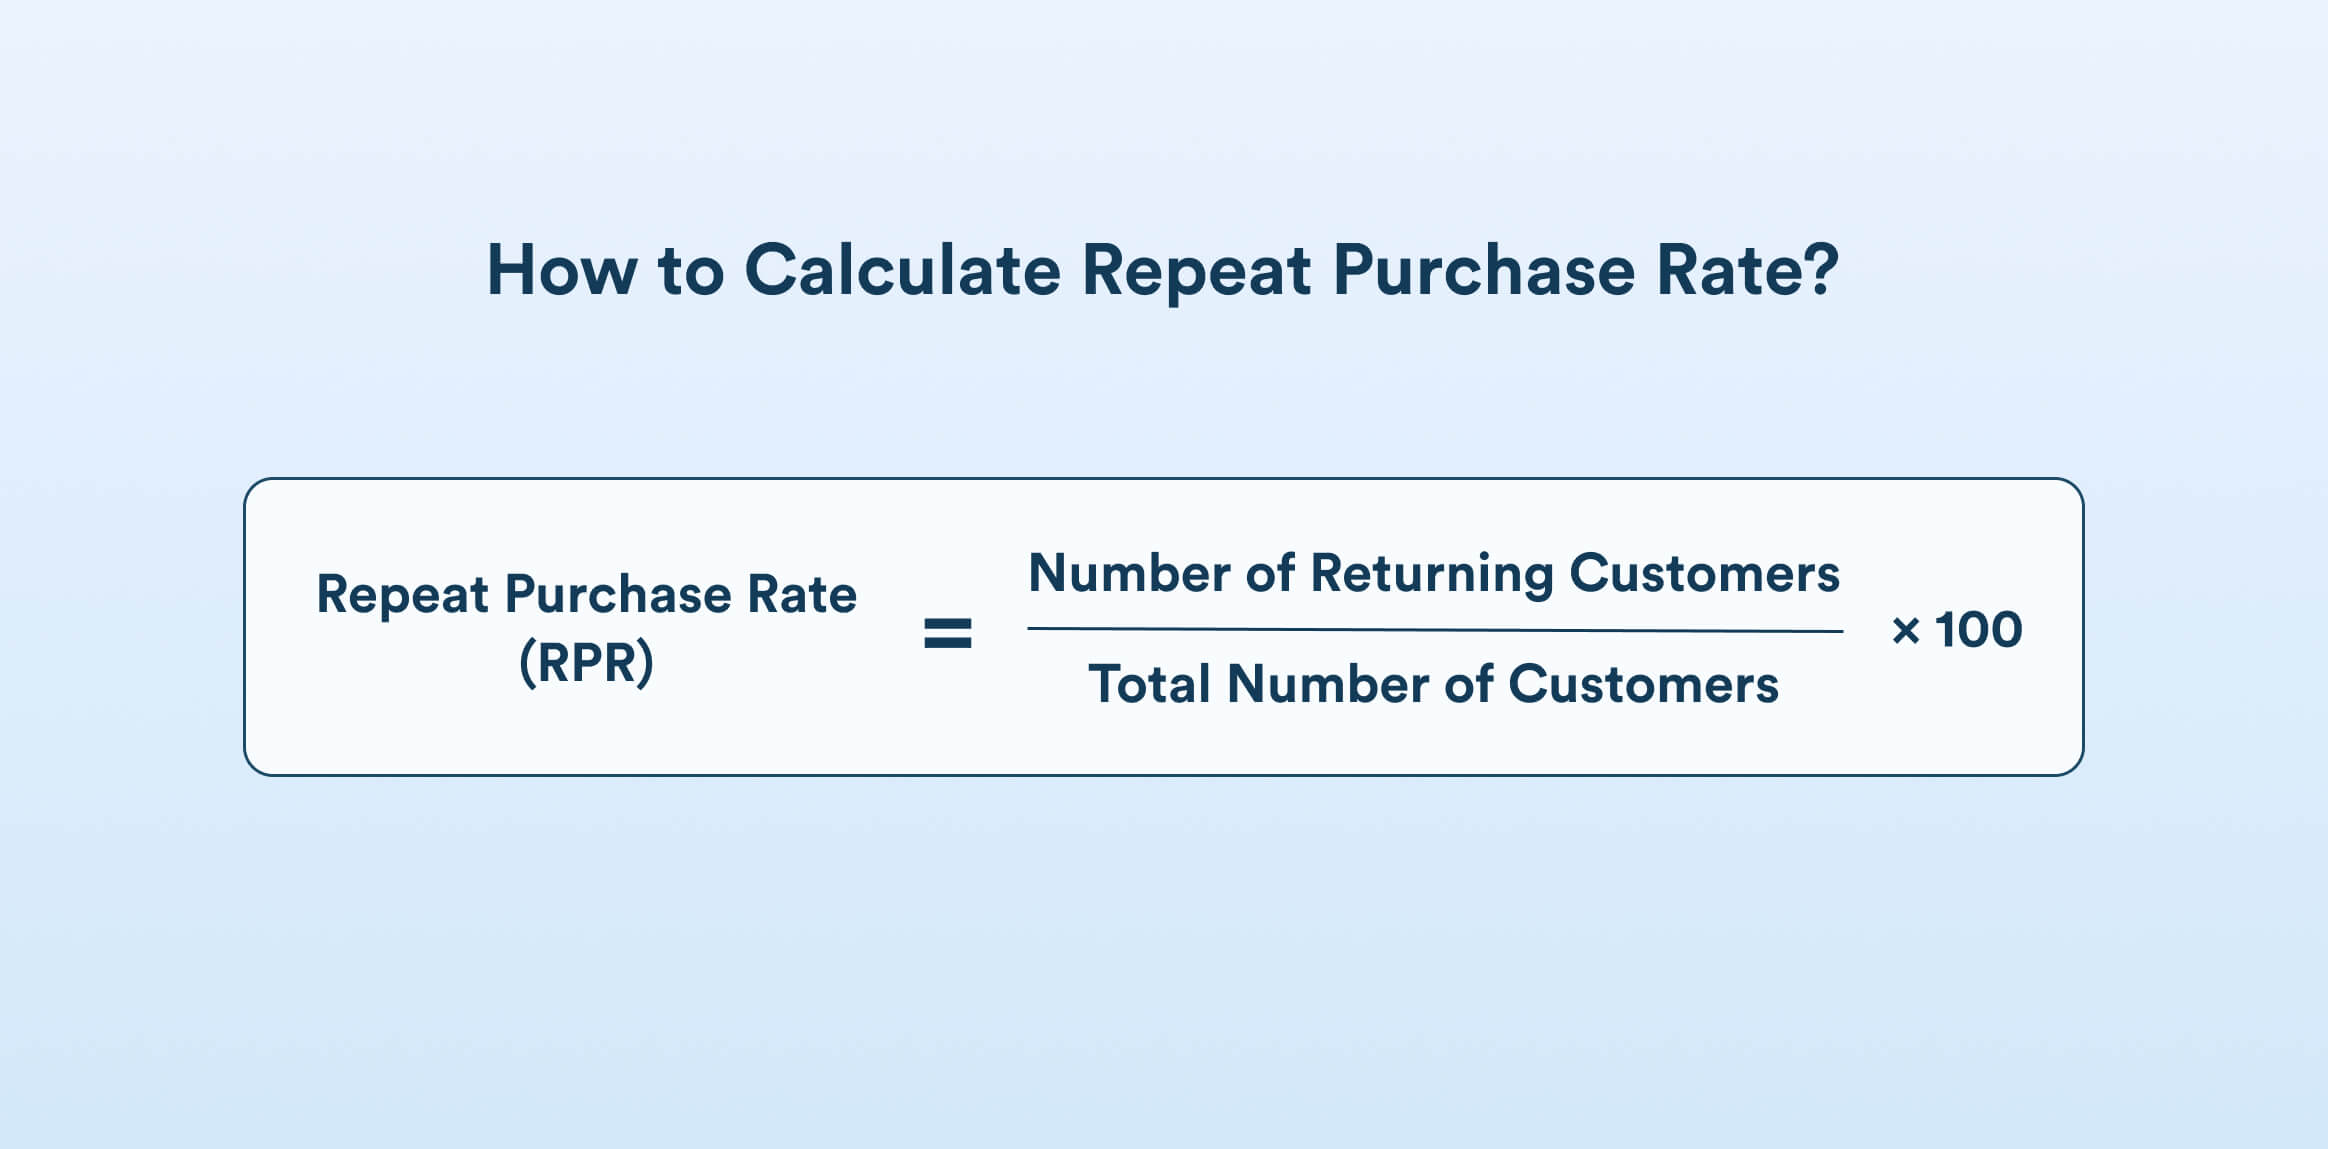
Start by determining the date range you intend to measure. Then, divide the number of customers that made more than one purchase by the total number of customers within that date range.
Repeat Purchase Rate = (Number of Returning Customers / Total Number of Customers) × 100
A high RPR indicates that the customers are satisfied with the products or services.
How to Improve Repeat Purchase Rate?
- Send personalized post-purchase follow-ups
- Offer auto-replenishment or subscription services for frequently used products
- Share helpful content, product tips, or usage guides after purchase
- Use paid ads or retargeting emails to bring back previous customers with personalized product suggestions
8. Customer Satisfaction Score (CSAT)
The customer satisfaction score measures how satisfied the customers are with the business’s products, services, or overall experience.
How to Calculate Customer Satisfaction Score?
Brands conduct CSAT surveys to ask customers for ratings. The survey can be sent after an interaction with a customer service professional or after a purchase, or even after a user simply browses through the app.
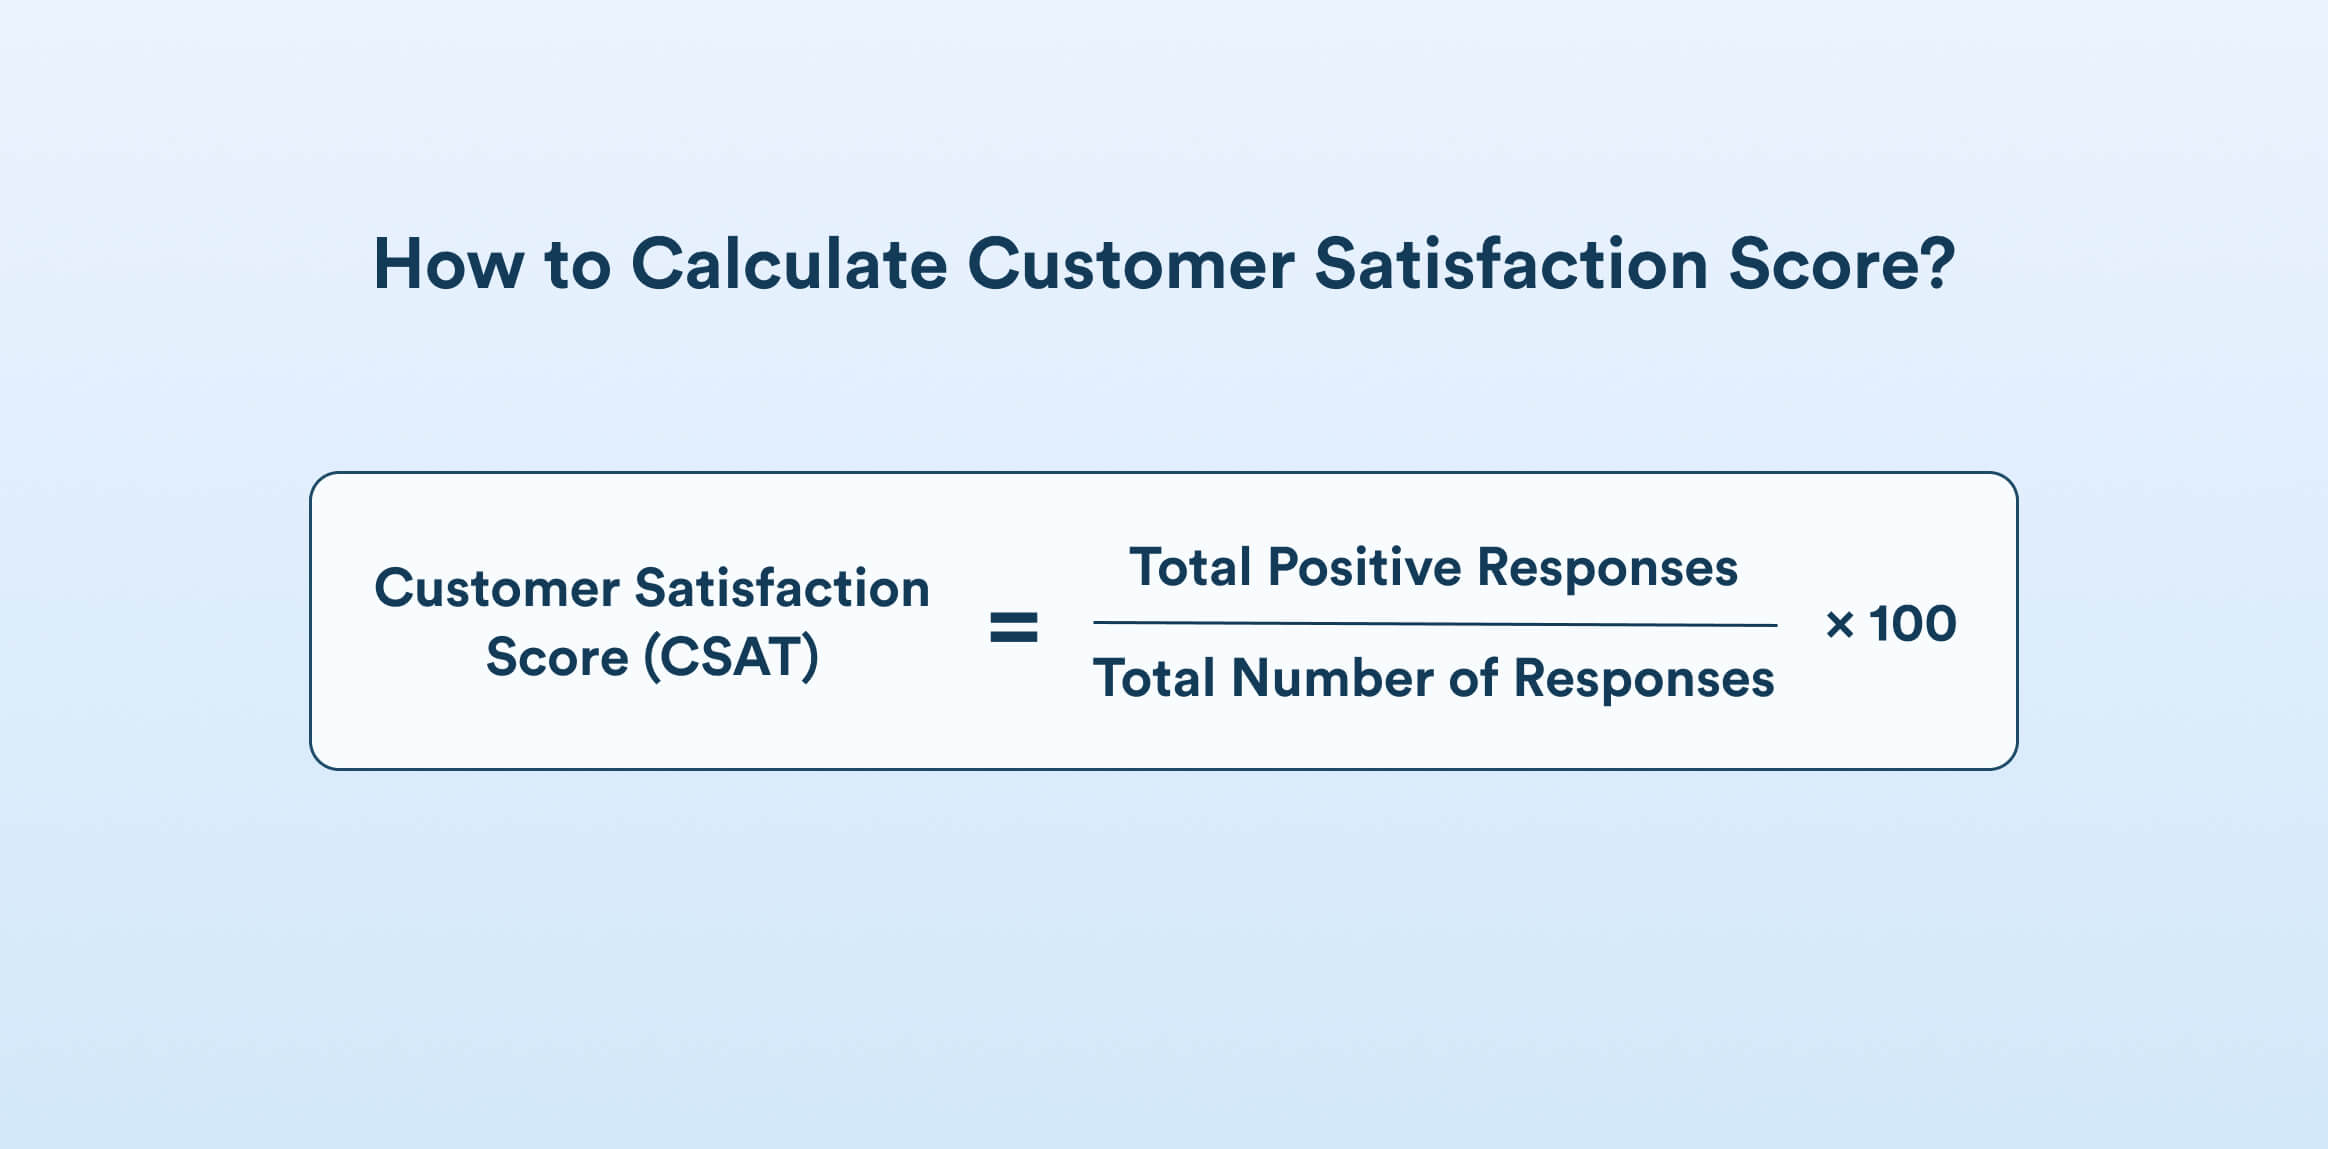
The survey generally contains a simple five-point scale or has a happy face or sad face option for the customers to select. Here’s the formula to calculate the satisfaction score:
CSAT = (Total positive responses / Total Number of Responses) × 100
How to Improve Customer Satisfaction Scores?
- Deliver consistent, high-quality service across all touchpoints
- Actively listen to customer feedback and resolve issues promptly
- Personalize interactions and train the support teams to do the same
9. Customer Health Score
Customer health score is a predictive metric to evaluate the overall well-being of a customer relationship. It helps businesses proactively identify at-risk accounts and take timely actions to improve retention, satisfaction, and long-term value.
The metric combines multiple data points to provide a single score, which can then be used to segment customers, prioritize customer success efforts, forecast upsell and cross-sell opportunities, and predict churn.
How to Calculate Customer Health Score?
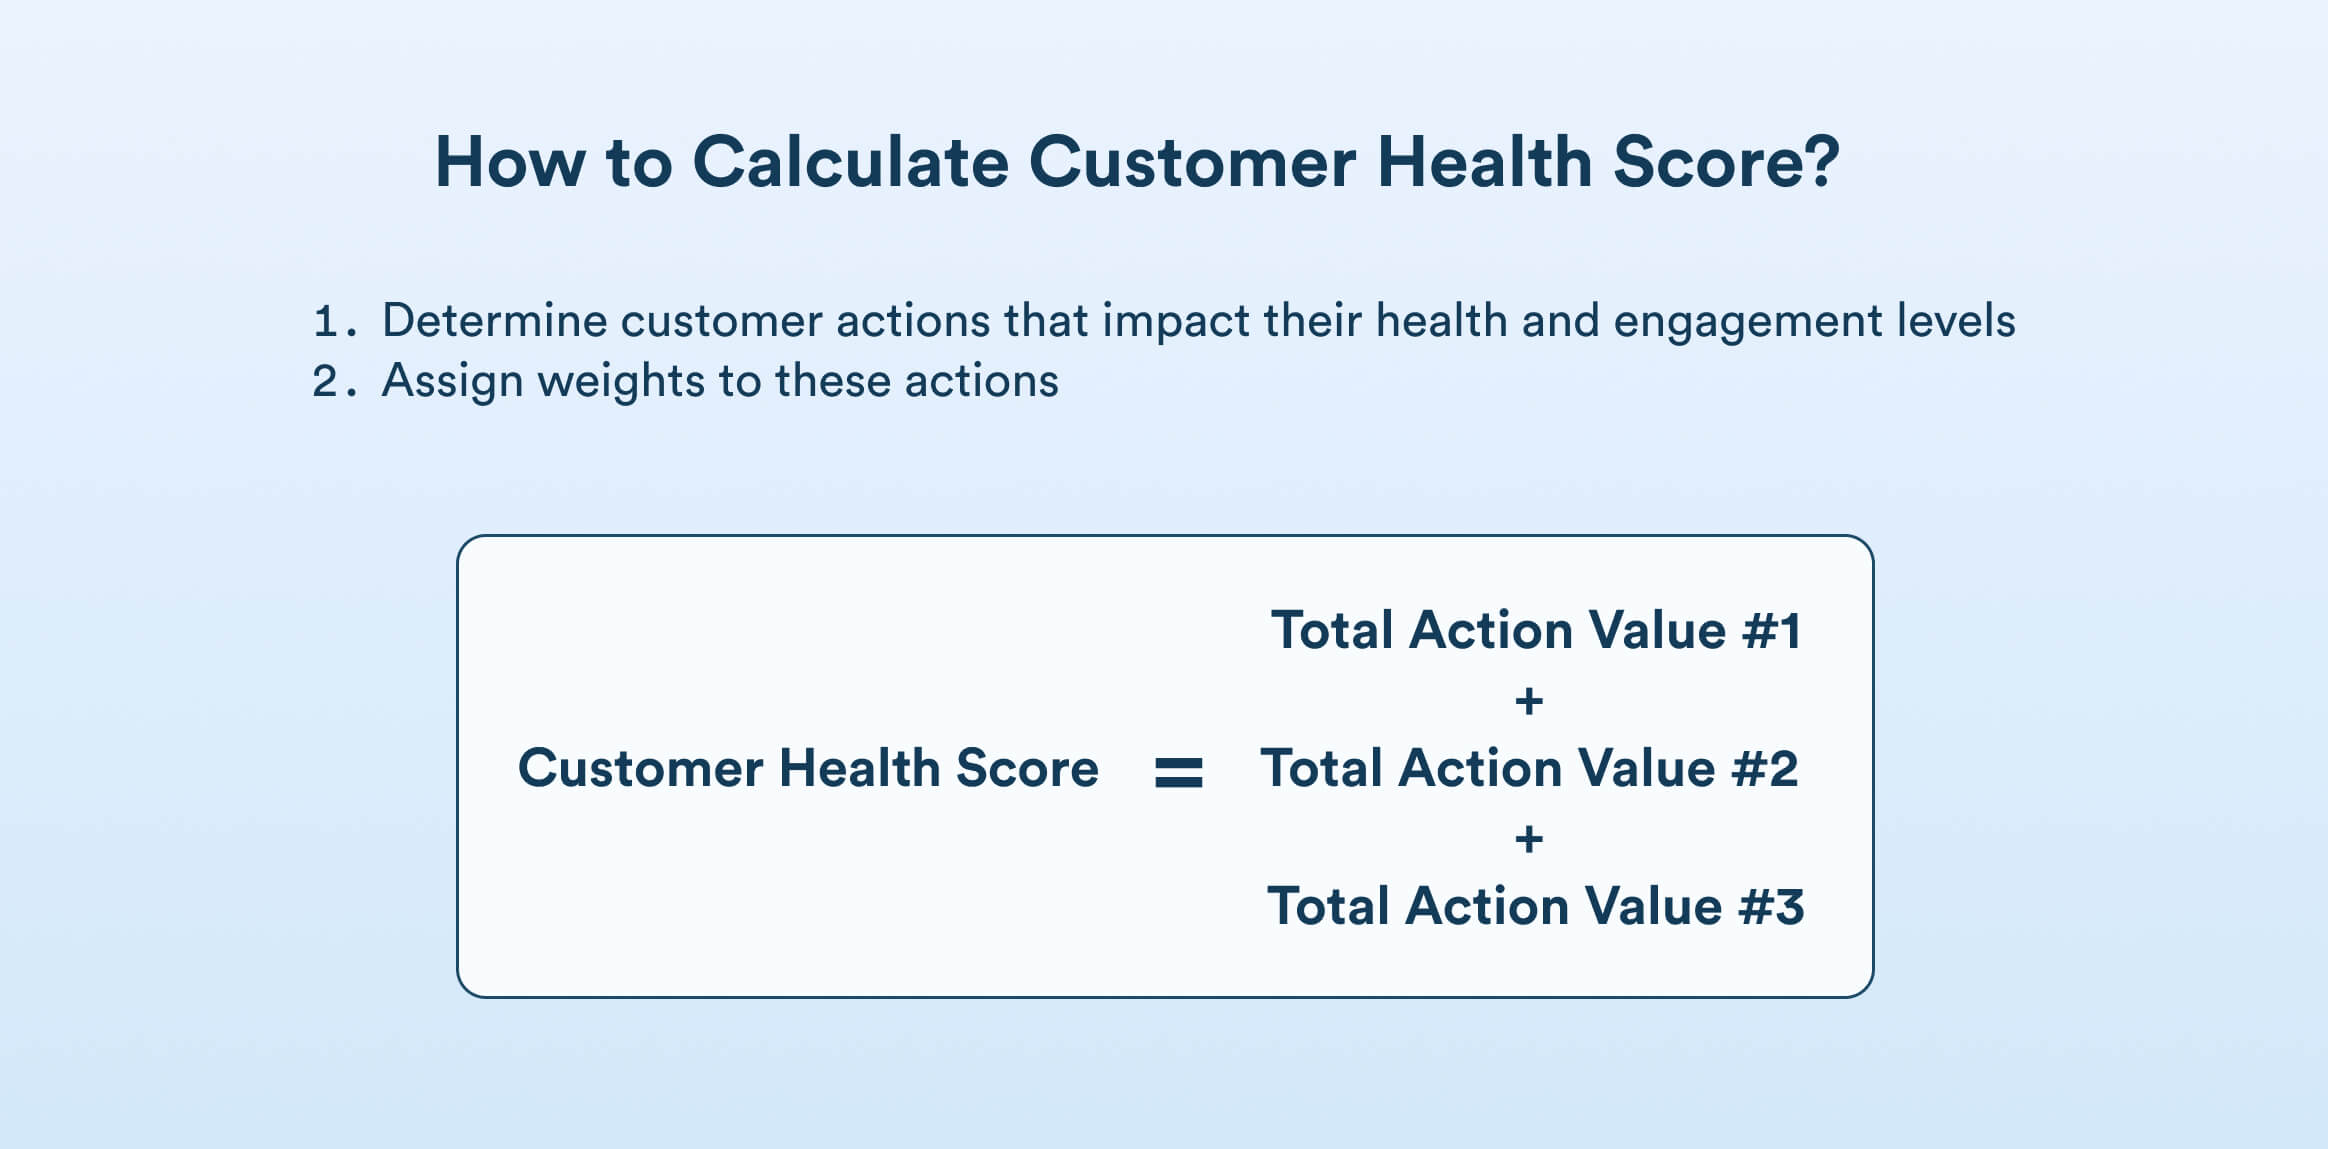
The first step is to determine the customer actions impacting the customer’s health and engagement levels with the business.
Next, you have to assign weights to each of these actions based on their importance and impact, and calculate the action values. The sum of these individual action values provides the customer health score.
For example, a business can assign weights and calculate action values for each of these customer actions:
- Product usage frequency
- Account growth with upsells, cross-sells, and expansions
- Customer interactions with support executives
- Number of account renewals
The sum of the action values for these four customer actions will determine the customer health score for this particular business.
So the formula to calculate the score can be written as:
Customer Health Score = Total Action Value #1 + Total Action Value #2 + Total Action Value #3
How to Improve Customer Health Score?
- Offer in-app guidance and help centers for on-demand support
- Use email campaigns, account reviews, and check-ins to maintain consistent communication
- Use segmentation to personalize success initiatives based on account size, usage patterns, or industry
10. Monthly Recurring Revenue (MRR)
Monthly recurring revenue (MRR) represents the total predictable revenue a company expects to receive each month from active subscriptions. The metric is mostly used by subscription-based businesses and includes revenue from new subscriptions, upgrades, and downgrades.
The metric is used for revenue forecasting, growth tracking, better budgeting, and resource planning. Investors look for MRR in SaaS companies to be more confident about their decisions.
How to Calculate Monthly Recurring Revenue?
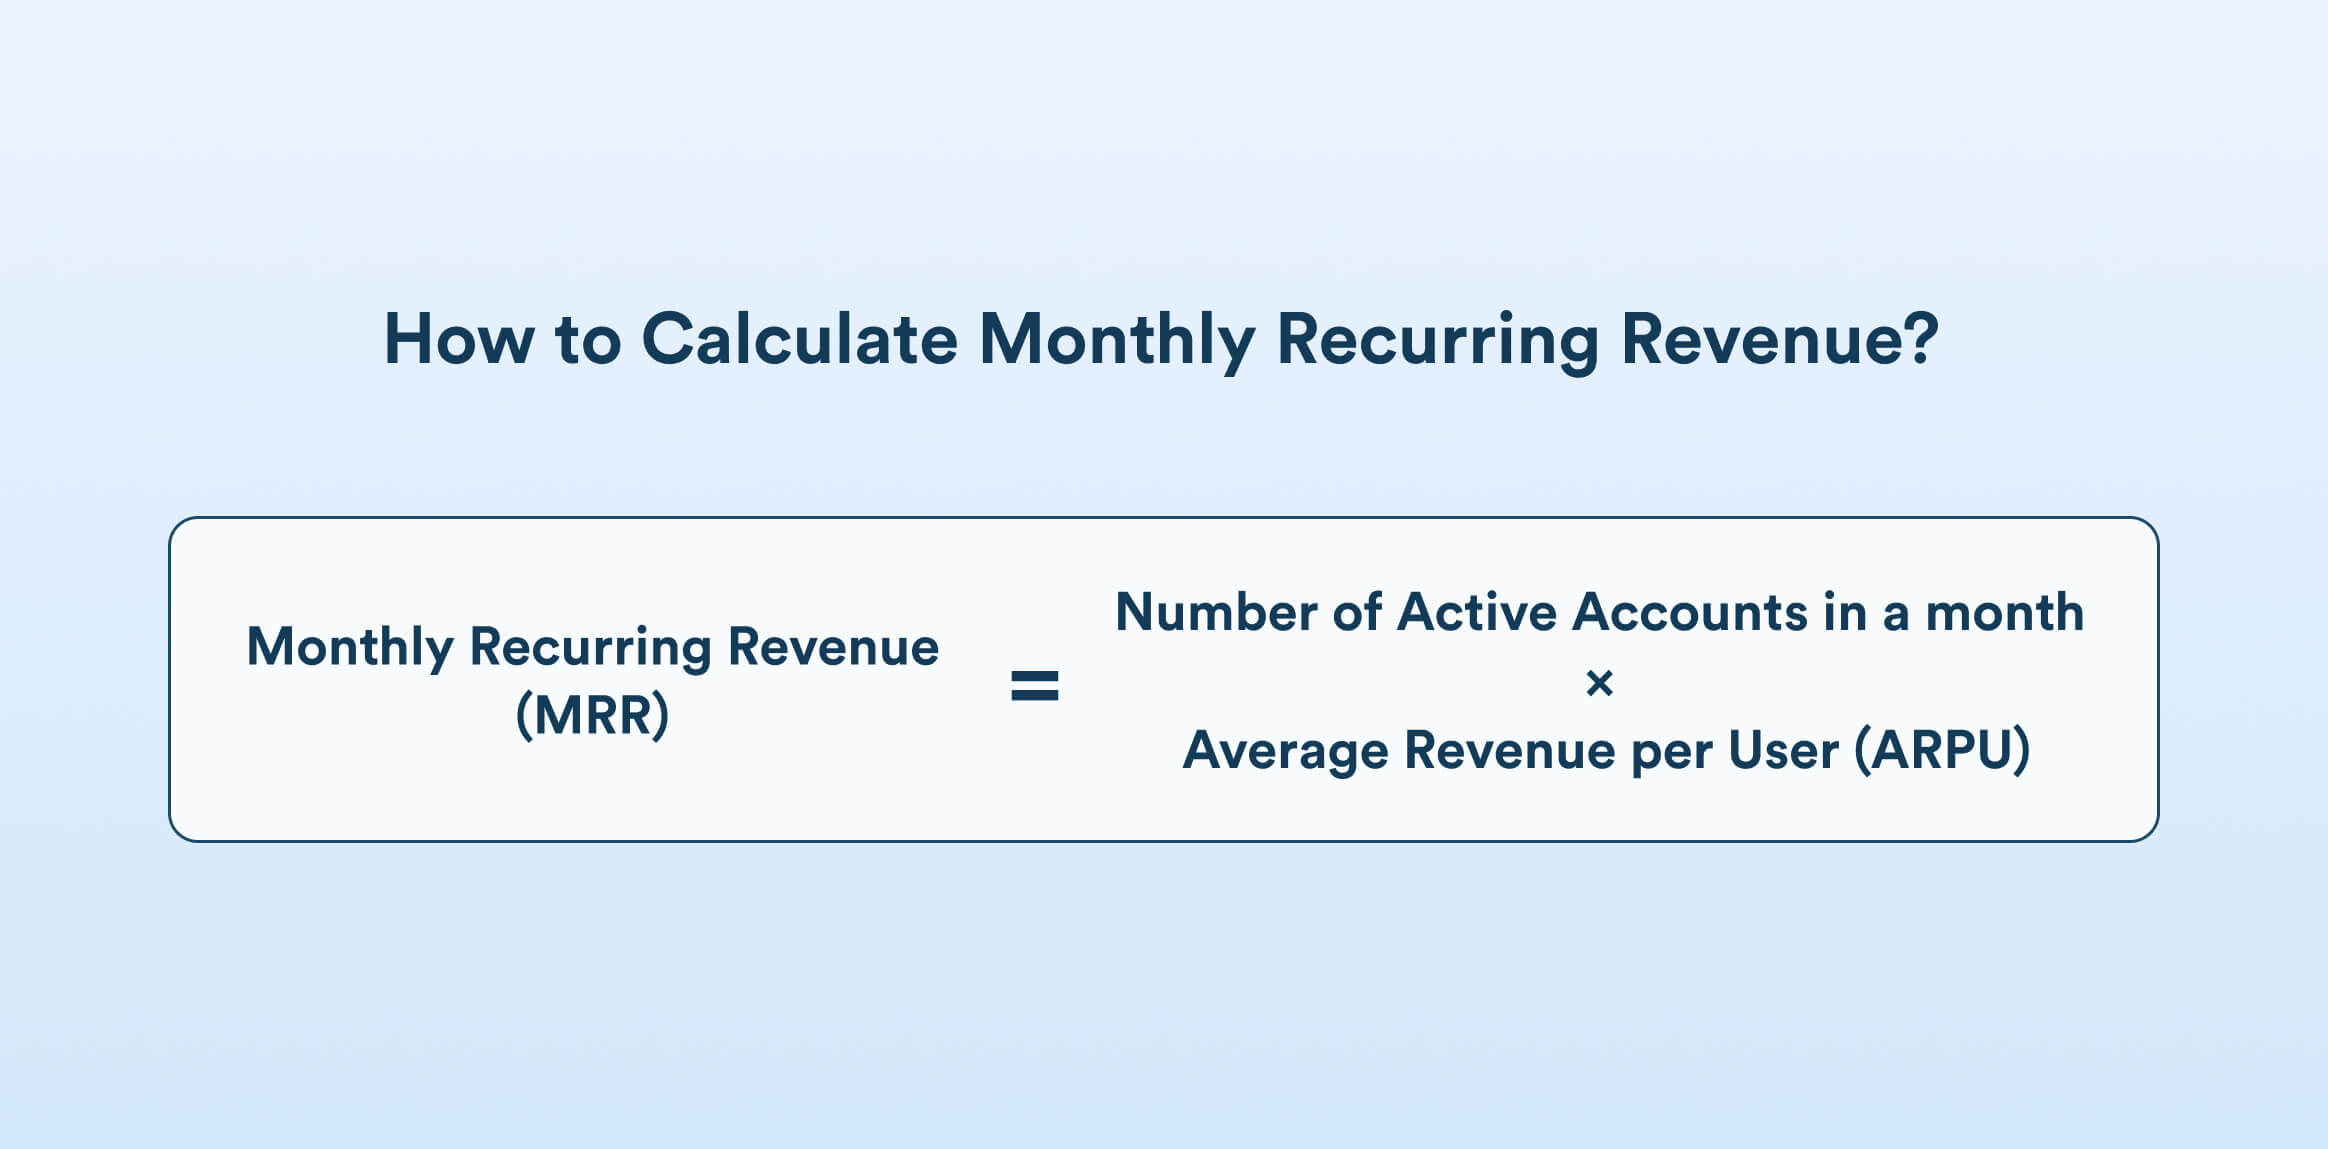
Determine the average revenue per active user (ARPU). Then, multiply this value by the total number of monthly active accounts.
MRR = Number of Active Accounts in a month × Average Revenue per User (ARPU)
How to Improve Monthly Recurring Revenue?
- Provide product tutorials and interactive user guides
- Encourage existing customers to upgrade or add new features
- Experiment with tiered or usage-based pricing to increase ARPU
- Focus on acquiring customers who are likely to choose higher-tier plans
- Offer value-added services or loyalty programs that justify higher spending from current customers
11. Product Stickiness
Product stickiness shows how often users return to and engage with your product over time. The metric reflects the product’s value and how essential it becomes in users’ daily workflows. A sticky product is more likely to retain users and drive growth through engagement, loyalty, and organic expansion.
How to Measure Product Stickiness?
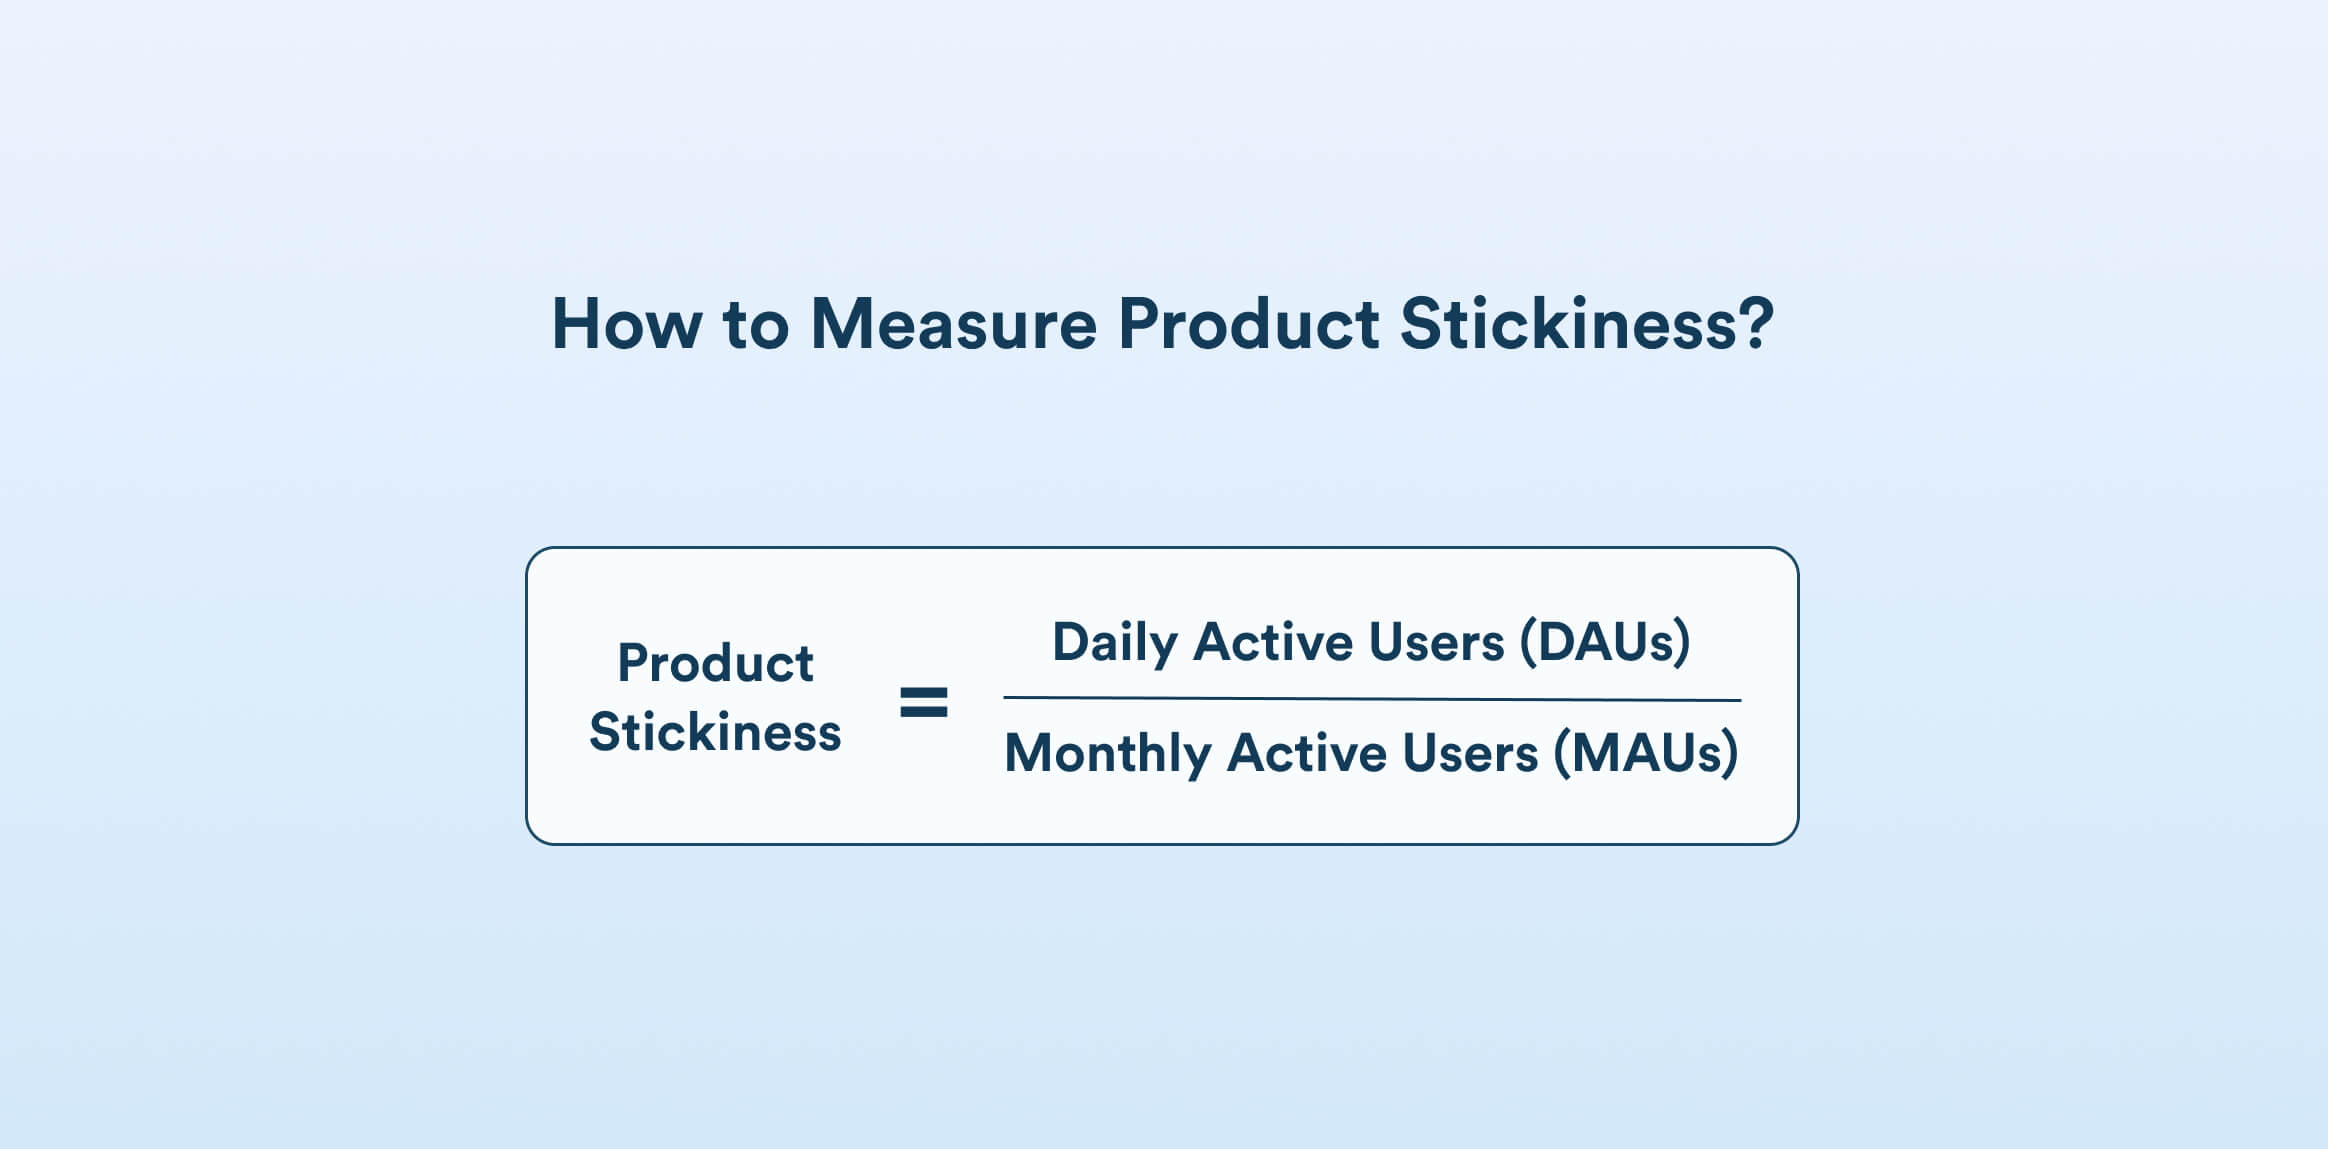
Divide the number of daily active users by the number of monthly active users to determine product stickiness.
Product Stickiness = Daily Active Users (DAUs) / Monthly Active Users (MAUs)
How to Improve Product Stickiness?
- Guide users through a smooth, engaging onboarding experience that highlights value
- Align product with daily or weekly user routines through timing and contextual value
- Send personalized reminders, notifications, or in-app prompts based on user activity
- Introduce useful features, updates, or content that keep users engaged and returning
- Use product surveys to collect feedback and improve the best features
12. Customer Effort Score (CES)
CES is a customer experience metric used to assess the level of effort a customer has to put in during a specific interaction, such as getting support or completing a transaction. The score is collected by using a survey that asks customers to rate on a scale of 1-5 or 1-7, with 1 being the most effort and 5 or 7 being the least effort.
How to Calculate Customer Effort Score?
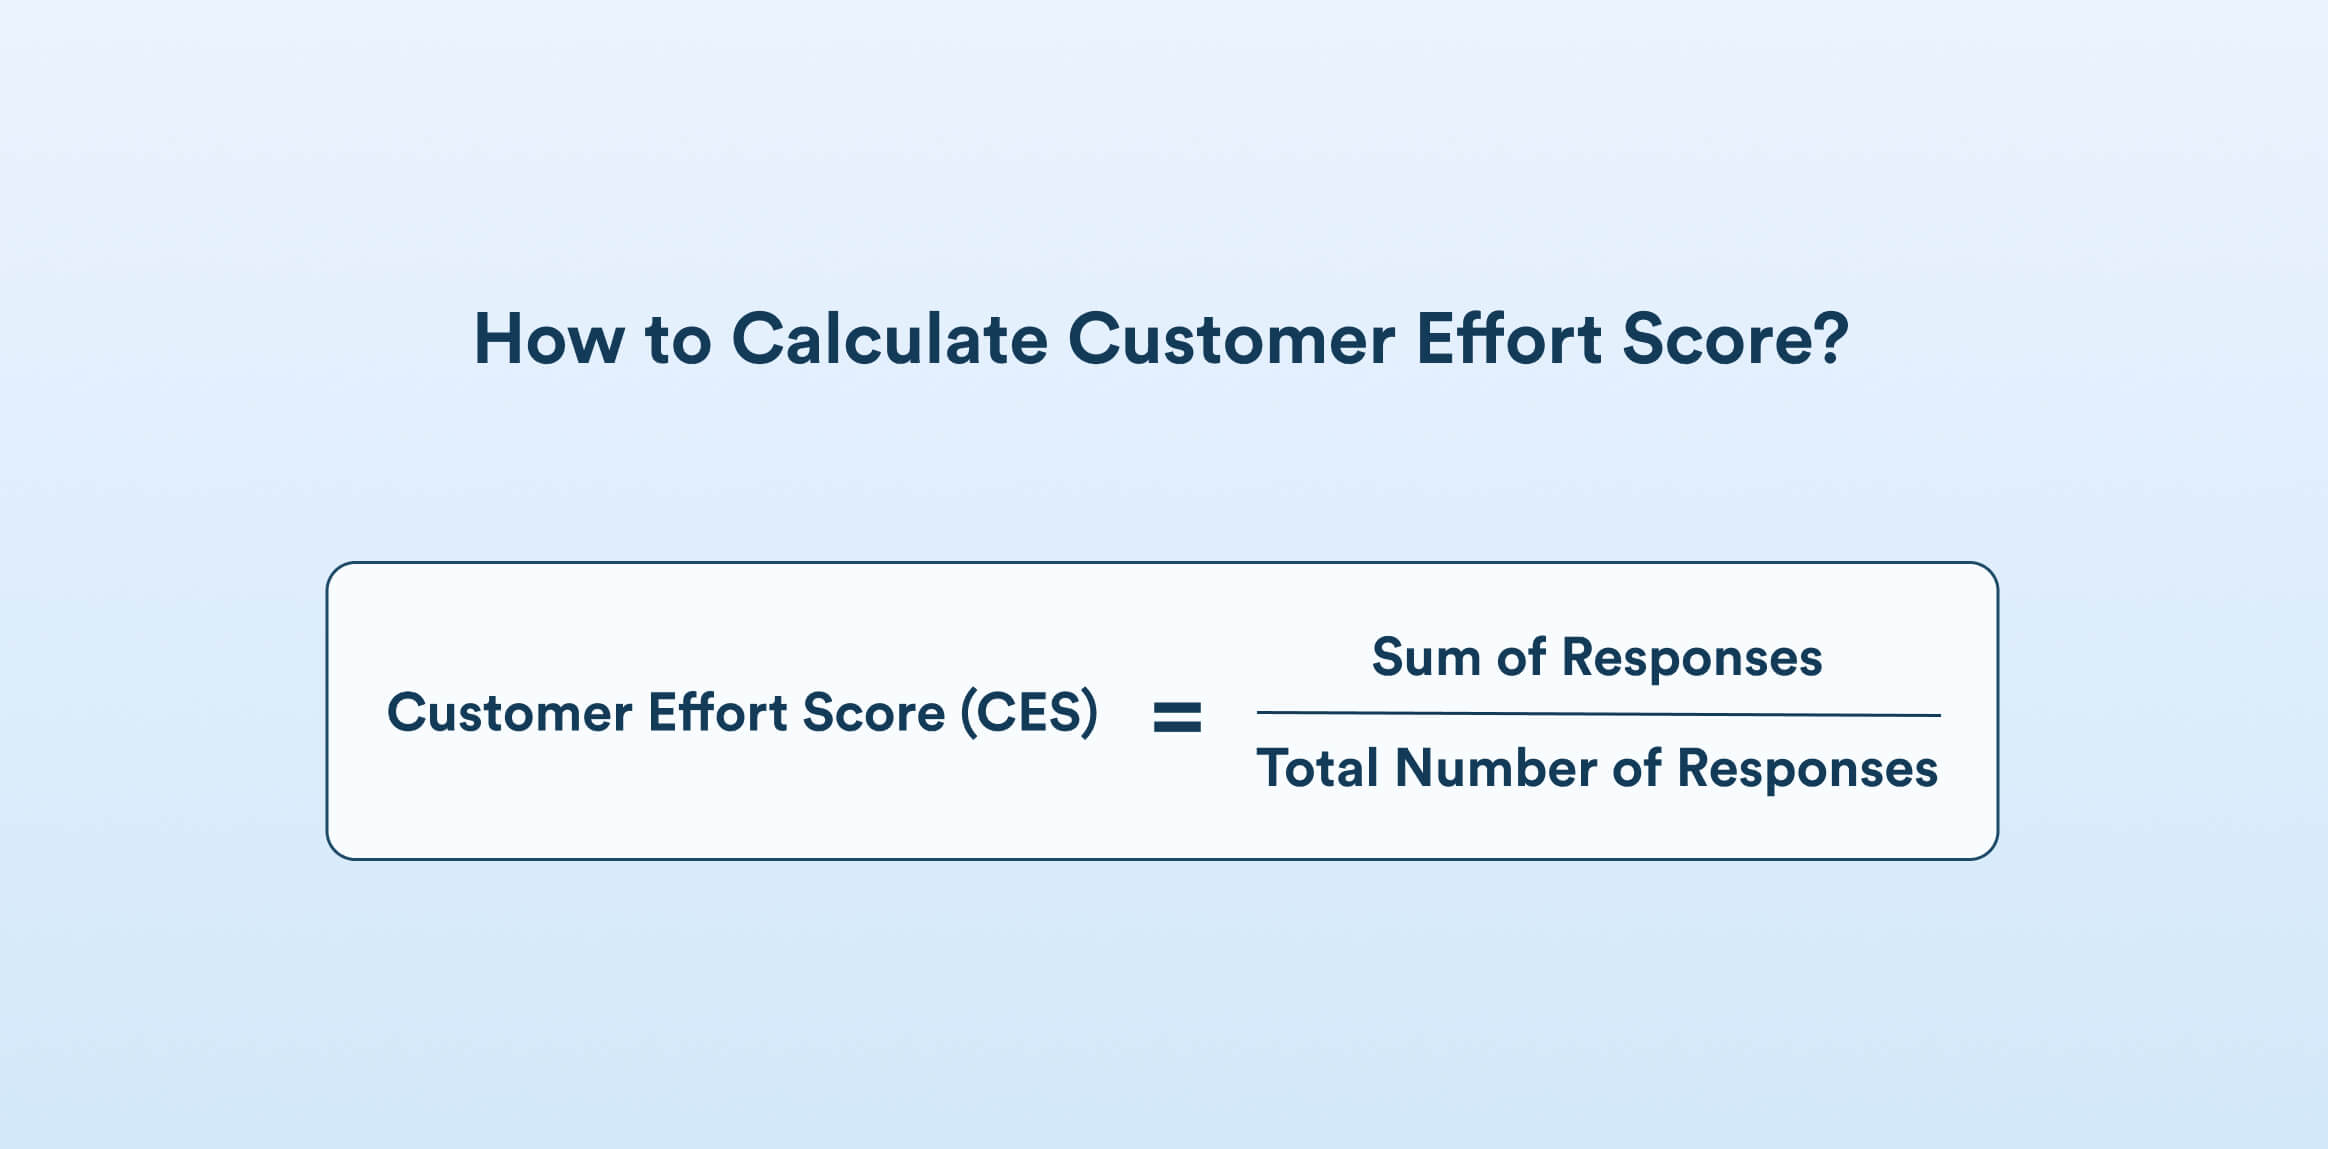
Divide the sum of all scores received by the total number of survey responses to get the CES.
CES = (Sum of Responses / Total Number of Responses)
How to Improve Customer Effort Score?
Businesses can increase the customer effort score by
- Simplifying steps for key actions like checkout, onboarding, and support resolution
- Monitoring user behavior and acting on pain points to improve future interactions
- Providing comprehensive FAQs, knowledge bases, and AI-powered chat support
13. Purchase Frequency
Purchase frequency measures how often a customer buys from the business during a set period, like a week, month, or year. It reveals patterns in the customer’s buying habits and shows how well the business encourages repeat purchases. Tracking this metric can help spot loyal customers and improve retention rates.
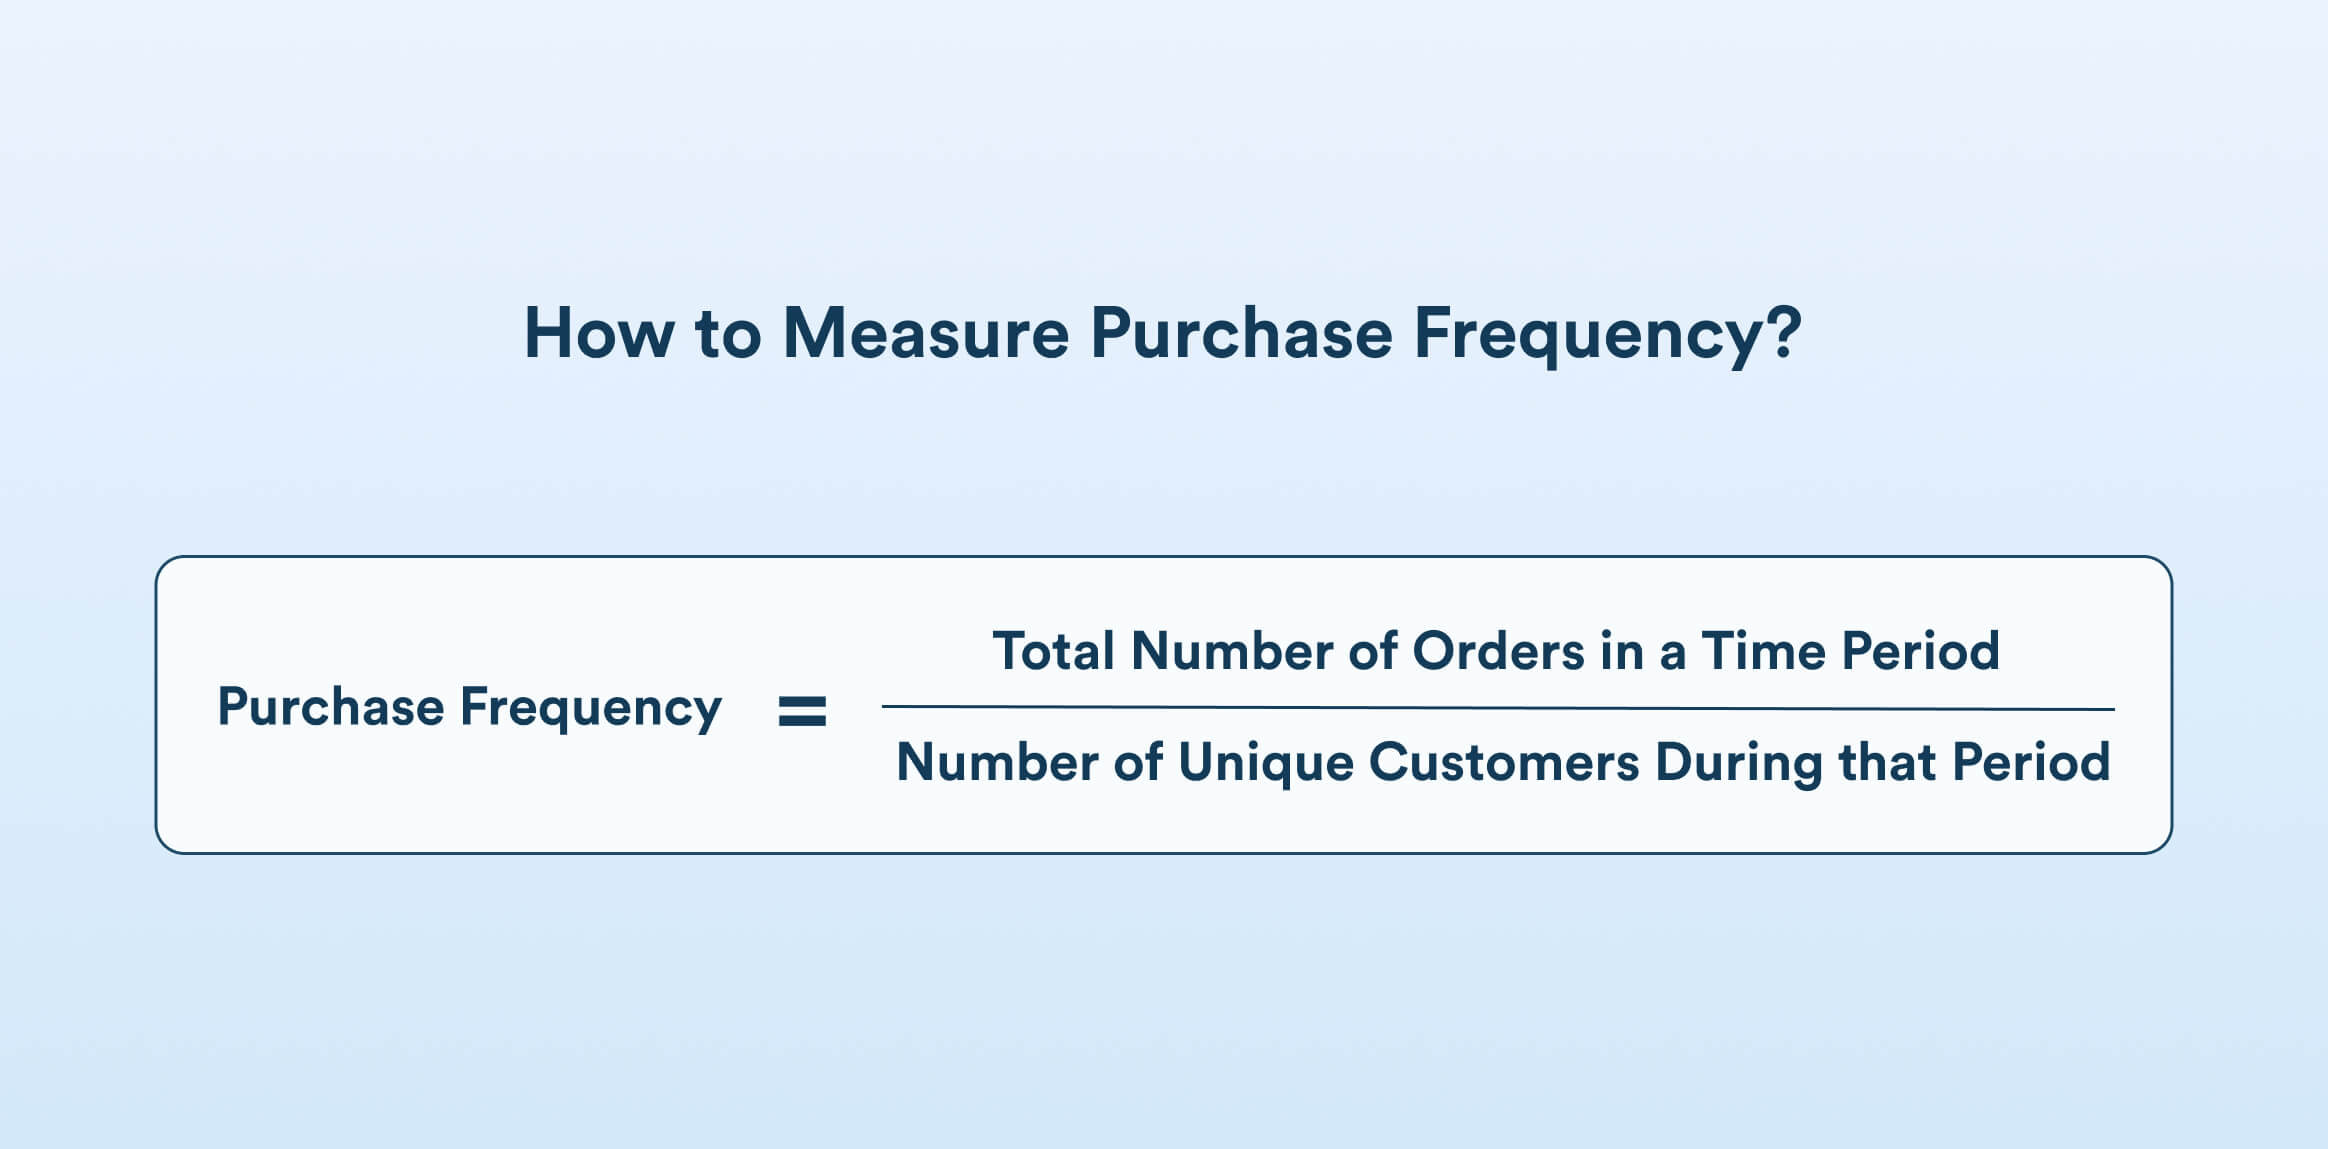
How to Measure Purchase Frequency?
Pick a time period and count all the orders placed during that period. Count the number of unique customers who made purchases and divide the total orders by this number.
Purchase Frequency = Total Number of Orders / Number of Unique Customers
How to Improve Purchase Frequency?
Follow the best practices mentioned below to improve purchase frequency.
- Improve purchase frequency by following up after a purchase.
- Provide care tips or related product suggestions to keep your brand top of mind and invite another visit.
- Set up customer loyalty programs with attractive rewards and perks.
- Provide returning customers with early access to sales.
- Use behavioral segmentation and marketing automation to deliver more relevant experiences.
- A/B test email content, subject line, CTA, and send times to decide what works best.
14. Product Return Rate
This metric is commonly used in retail, e-commerce, and other industries that sell physical products to assess customer satisfaction, product quality, and operational efficiency. Product return rate is the percentage of total products sold that have been returned to the business. Irrespective of the reason for return, this rate should be as low as possible.
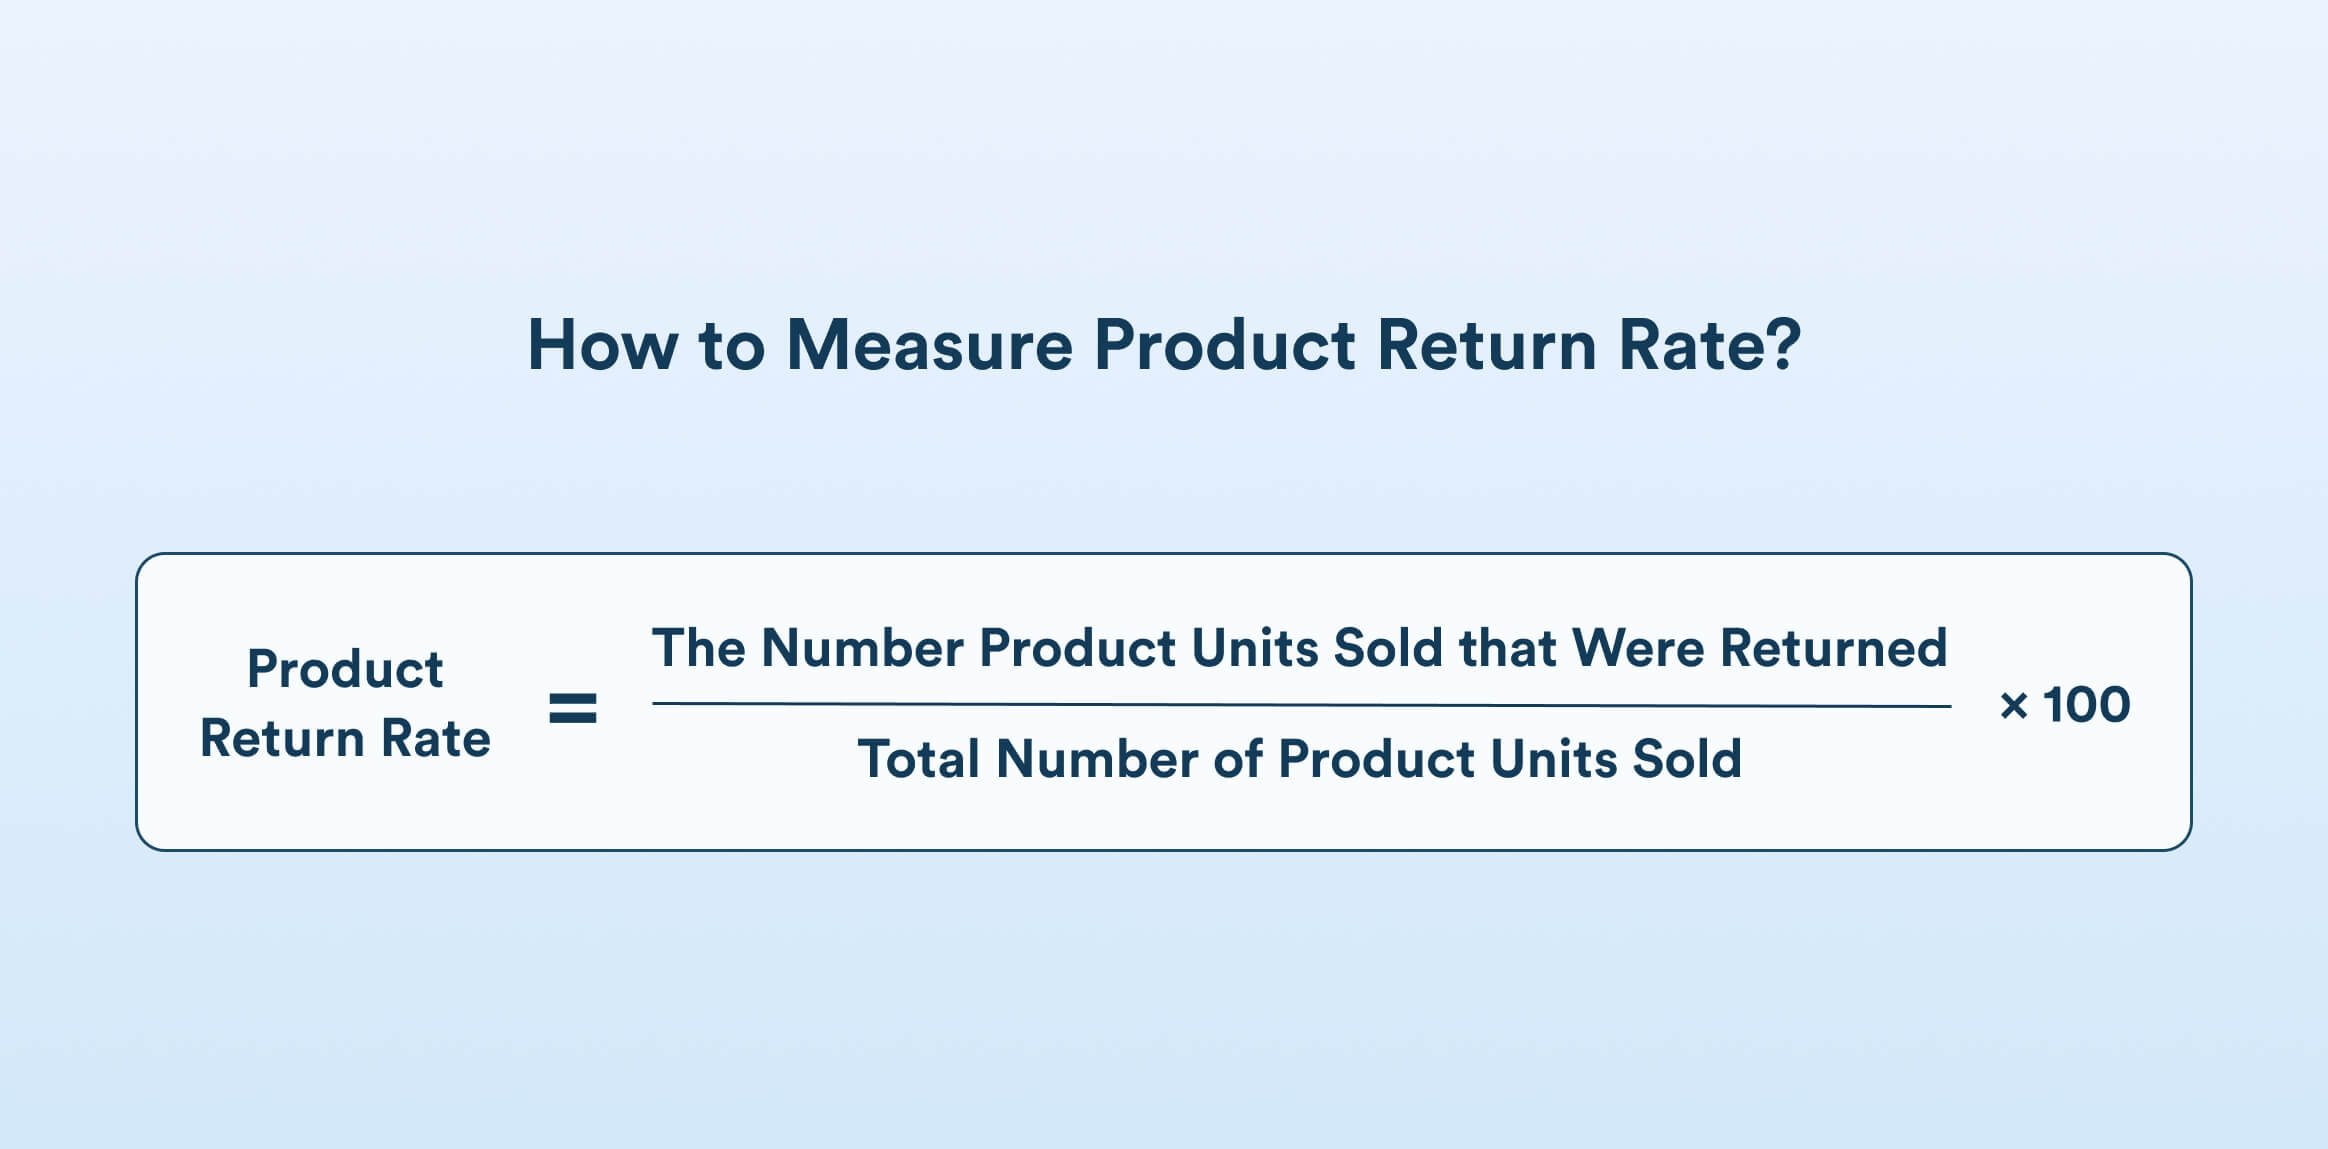
How to Measure Product Return Rate?
This rate is calculated over a specific period using the following formula:
Product Return Rate = (The number product units sold that were returned / Total number of product units sold) X 100
If you sold 1,000 items and 50 were returned, your product return rate is:
(50/1000) × 100 = 5%
A high return rate may signal poor product quality, misleading product descriptions, or unmet expectations. Product returns increase logistics, handling, and restocking costs.
How to Minimize Product Return Rate?
To minimize product return rates, ensure accurate and detailed product descriptions with high-quality images that reflect the item realistically. Offer size guides, FAQs, and customer reviews to set clear expectations. Invest in quality control to reduce defective products and provide excellent customer service to address concerns before a return is initiated. Simplify the buying process and use packaging that prevents damage during transit.
Strategies to Improve Customer Retention Metrics
Implement the following strategies to improve customer retention metrics and instill loyalty.
- Enhancing Onboarding Processes: Deliver personalized onboarding experiences that align with each customer’s needs. Communicate the product’s value proposition clearly to ensure customers understand the benefits of staying engaged.
- Regular Customer Engagement: Maintain consistent customer communication through various channels like emails, newsletters, product updates, and periodic check-ins to keep your brand top of mind. Launch loyalty programs and offer exclusive deals to incentivize repeat purchases and long-term relationships.
- Soliciting and Acting on Feedback: Actively collect feedback through regular surveys. Analyze NPS and CSAT to identify areas of improvement and implement the changes based on the feedback.
- Proactive Customer Support: Provide 24/7 support through multiple channels to promptly address customer issues. Supplement this with a comprehensive knowledge base and self-service options.
- Product or Service Improvements: Consistently update the product or service with new features based on user needs. Fixing bugs and enhancing performance also contributes to a seamless user experience, which is key to customer satisfaction.
How CleverTap Helped Rummy Passion Increase App Stickiness and Customer Retention Rate
Rummy Passion, with an Indian player base of 5 million, wanted to focus on improving player onboarding and engagement. The key performance metrics for the team were reducing churn and increasing the average revenue per user (ARPU). Here’s how CleverTap helped Rummy Passion uplift app stickiness by 23% and increase day-30 retention rate by 41%.
Omnichannel Campaigns and Journeys for Enhanced Player Engagement:
Rummy Passion implemented over 100 omnichannel marketing journeys and campaigns via emails, SMS, and push notifications to bring users to the app and optimize their gaming experience. These included the following:
- The install-to-registration series of journeys guided the onboarding process
- The first real-money deposit journey nudged users to deposit money and play their first game
- A 10-day series after the first deposit educated users on the app’s features and benefits, driving game adoption, and increased play time
- Increased ARPU through journeys that encouraged users to deposit and play more games
- These interactions focused on building positive user habits, thereby increasing their engagement and stickiness to the app
- Win-back and re-engagement campaigns targeted inactive users to reduce churn and player attrition.
Control Groups to Measure Effectiveness
The company monitored campaign effectiveness and fine-tuned performance metrics by using control groups. They performed several rounds of optimization to stabilize and measure results against the target group.
Player Behavior Analysis using Funnels and Cohorts
The business used CleverTap’s segmentation capabilities to create micro-segments based on the steps in the user funnel. Defining funnels helped understand where exactly users drop off, and showed them the friction points in the app. Rummy Passion could dive deeper into player behavior and gain a complete picture of how many users completed each step in the conversion funnel.
Using cohort analysis helped the business isolate players who had performed a certain action and determine how long it took them to revisit and perform another action.
Read the full case study of how Rummy Passion used CleverTap to increase their retention metrics.
Track The Right KPI to Increase Customer Retention
Businesses do not need to track all the customer retention metrics mentioned in this blog. Focus on the metrics most relevant to your business model and customer journey.
For example, a subscription-based business will benefit from monitoring monthly recurring revenue and repeat purchase rate. Whereas an e-commerce business will more likely focus on average order value and customer lifetime value.
Tracking the right KPIs helps businesses prioritize initiatives, allocate resources wisely, and focus on the actions that will have the biggest impact on retention.
Improve Customer Retention KPIs with CleverTap.
Subharun Mukherjee 
Heads Cross-Functional Marketing.Expert in SaaS Product Marketing, CX & GTM strategies.
Free Customer Engagement Guides
Join our newsletter for actionable tips and proven strategies to grow your business and engage your customers.
