


Table of Contents
Categories
Most Popular


Cast your mind back to 1997. The internet had momentum but hadn’t officially taken off yet. A search engine named Google wouldn’t launch for another year and a consumer could typically purchase advertised cable speeds of up to 1 Mbps*.
Fast forward 24 years and the internet, and by extension mobile devices, have become such huge parts of our lives that more than 90% of the global internet population uses a mobile device to go online*.
A mobile device isn’t complete without dozens of mobile apps. In 2020 consumers downloaded 218 billion mobile apps to their connected devices*. So what do these downloads and usage numbers tell us about the future of mobile?
In this post, we’ve chosen 63 key app download statistics to provide an in-depth look at the power of this growth and the buzz that downloads continue to generate on a global scale. Be sure to check out our infographic below for the most important statistics.
Top Mobile App Download and Usage Statistics
According to Simform*, if you have 40 apps installed on your mobile device, you are an average user. However, Millennials have more than an average of 67 apps installed. This bodes well for app developers and marketers, both current and future. Let’s look further at the top seven mobile app downloads and usage statistics.
| Time Spent in Mobile Apps Increased Across All Generations in 2020 | |||
| Generation | Baby Boomers (1946–1964) AND Gen X (1965–1980) | Millennials (1981–1996) | Gen Z (1997–2012) |
| % increase in time spent in most-used apps (per user, YoY) | 30% | 18% | 16% |
Source: App Annie*
- In 2020, users downloaded 218 billion mobile apps compared to 140.7 billion apps downloaded in 2016. [Source: Statista*]
- Consumers are now spending an average of 4.2 hours per day using apps on their smartphones. [Source: App Annie*]
- In the US, Gen Z, Millennials, and Gen X/Baby Boomers spent 16%, 18%, and 30% more time per user YoY in their most-used apps. [Source: App Annie*]
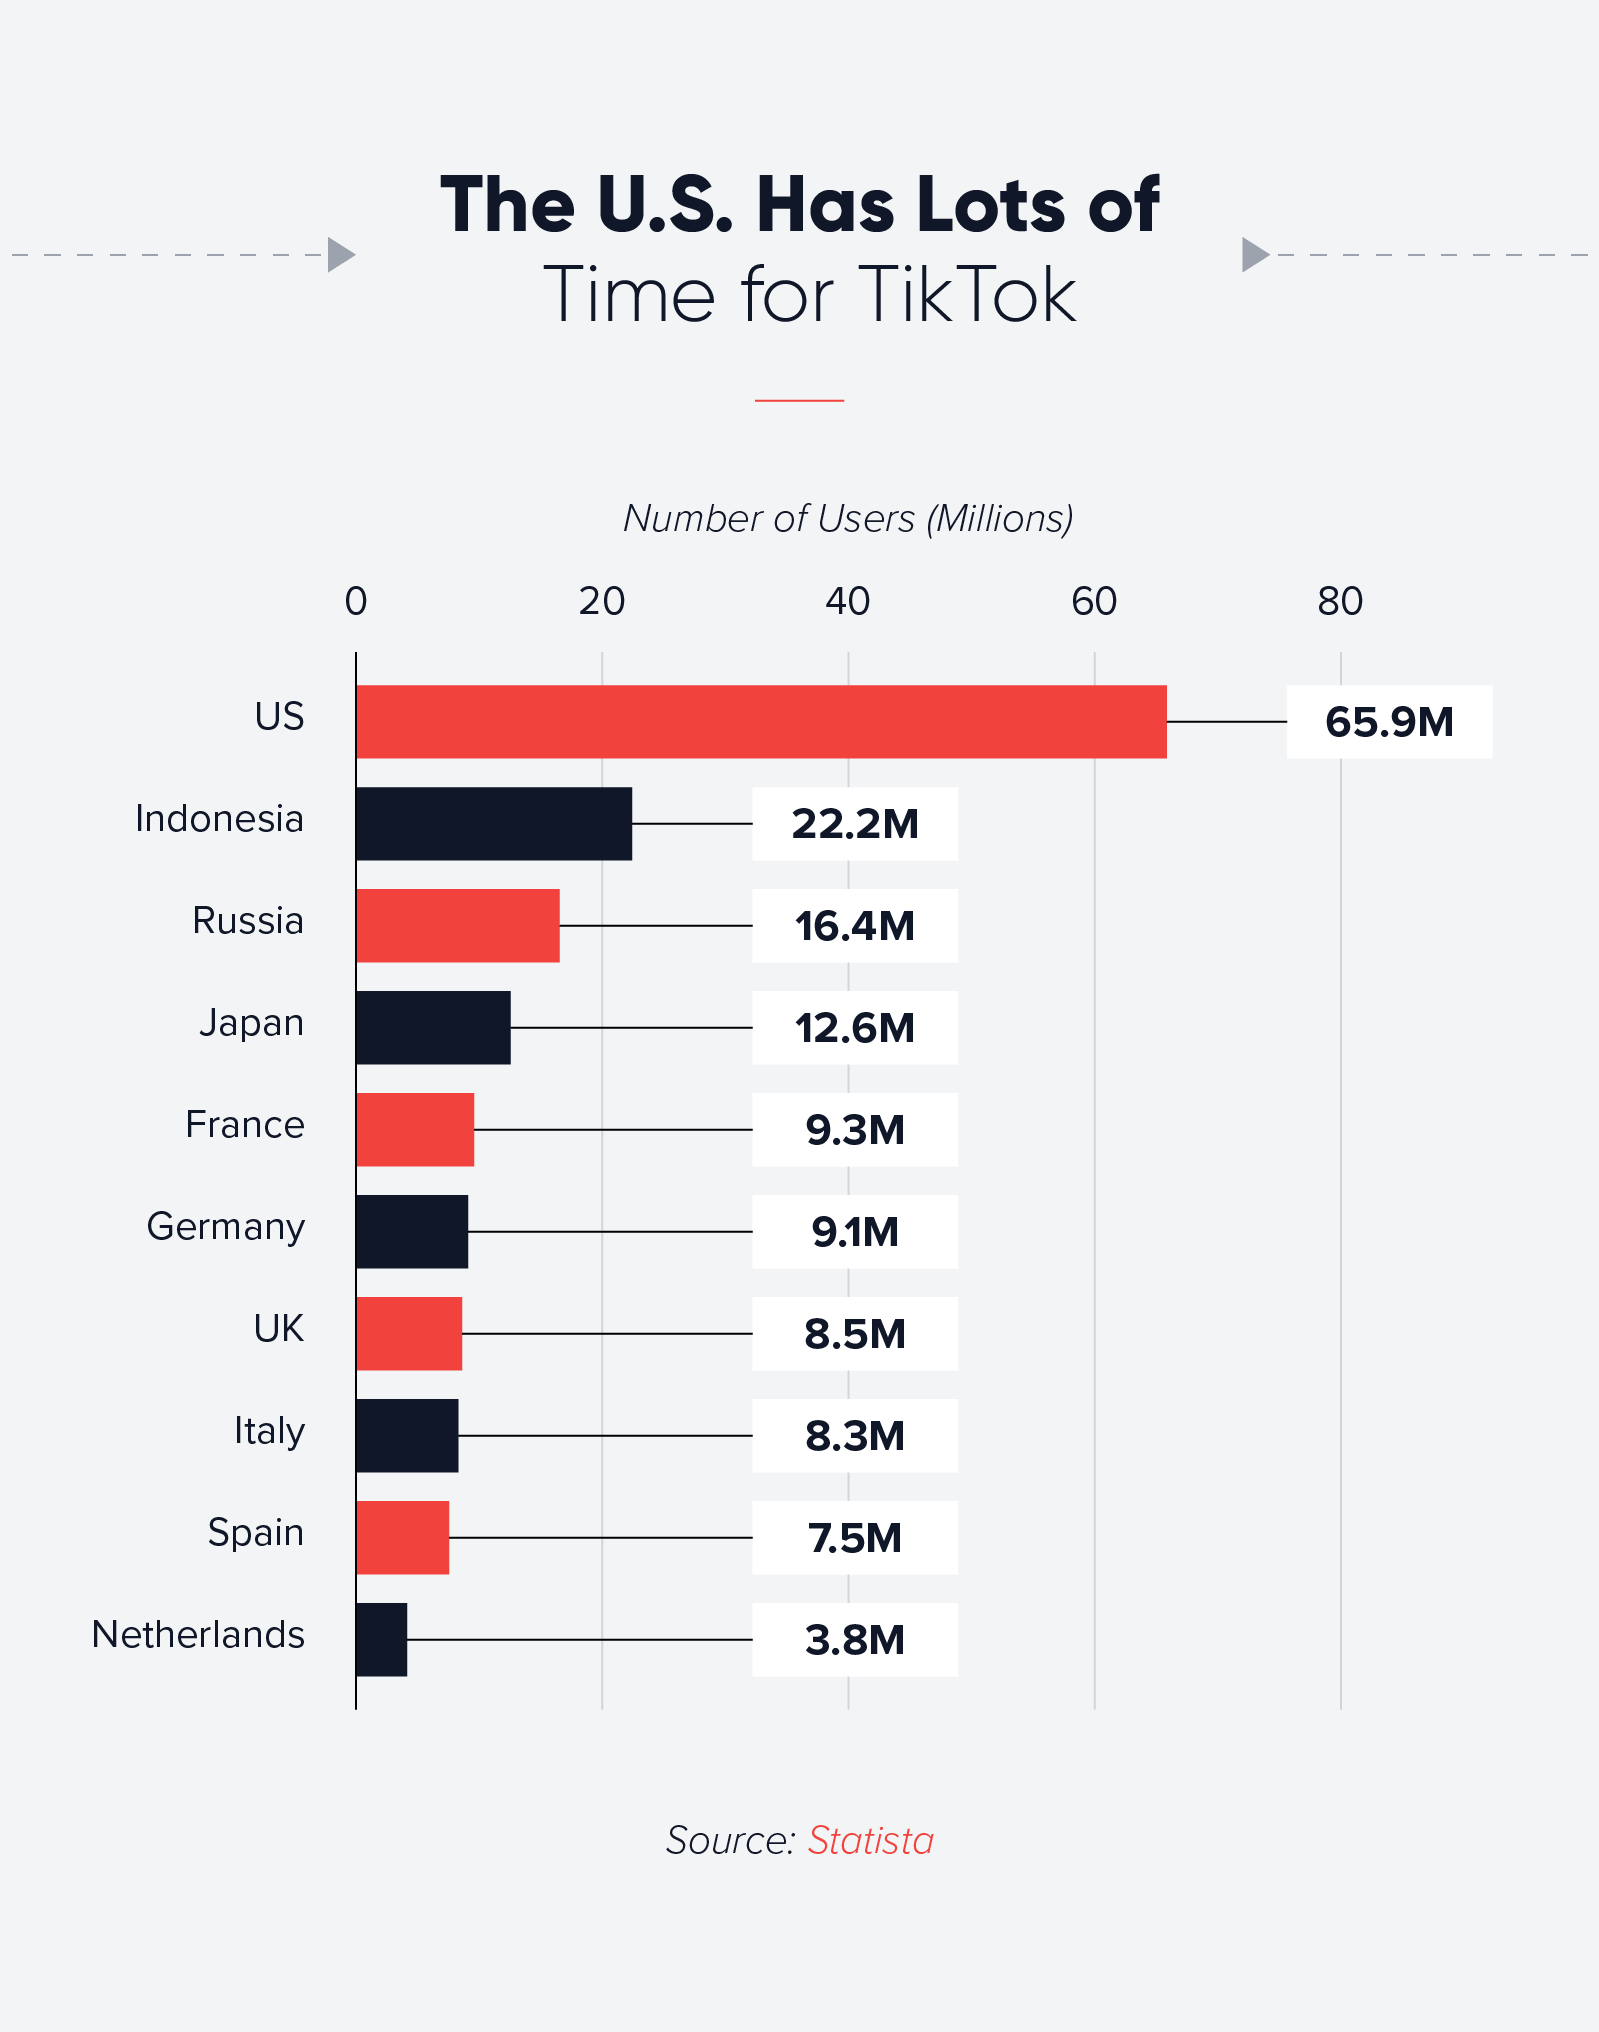
- As of April 2020, TikTok had been downloaded more than two billion times on the Apple App Store and Google Play. [Source: Sensor Tower*]
- TikTok had an estimated 65.9 million monthly active users in the US in 2020 [Source: Statista*]
- Google’s suite of apps have been installed a combined 200 billion times. Compare this to Facebook’s total app installs of 10 billion. [Source: AppBrain*]
- In 2020, Among Us was the most-downloaded game, with 264 million installs globally and 41 million in the United States. This includes both iPhone and Android apps downloaded on the App Store and Google Play. [Source: Apptopia*]
Fintech Apps Download and Usage Statistics
What makes a great fintech app? According to our research, there are four important categories for apps to consider including, App Store Optimization, user retention, key features, and colors/logos. Digital payments and an increased demand for a touchless society will continue to disrupt the previously traditional banking ecosystem.
- In 2020, the number of banking and fintech app downloads reached a record of 4.6 billion instances. [Source: App Annie*]
- Finance app downloads spiked by 15% during the pandemic, with mobile fintech applications outperforming banks by a factor of up to 10.8x. [Source: Liftoff and App Annie*]
- With 36 million monthly active users and more than 100 million downloads, CashApp is definitely a fintech leader. [Source: Business of Apps*]
- As of March 2021, PayPal reported that Venmo had 392 million active accounts. [Source: Nasdaq*]
- US consumers using two or more digital payments methods jumped from 45% in 2019 to 58% in 2020. [Source: McKinsey*]
- Looking at APAC countries, digital wallets make up more than half of regional ecommerce payments and have even surpassed cash at POS. [Source: Global Trade Mag*]
- Japan wins the race for banking downloads among countries analyzed. Stand-out markets by growth rates were Japan (142%), Germany (40%), Turkey (31%), and the US (27%). [Source: Adjust and Apptopia*]
Gaming Apps Download and Usage Statistics
In August 2020, DFC Intelligence published a report* revealing that the global game consumer community was at 3.1 billion. By 2022, that number has now grown to 3.24 billion.* This is a significant indicator of the power and potential of this community and how mobile gaming trends are becoming more than just predictions to watch out for. Read further to understand how gaming apps download and usage statistics stack up for gaming.
- Mobile games make up roughly 21% of all Android app downloads and 25% of all iOS app downloads. [Source: Business of Apps*]
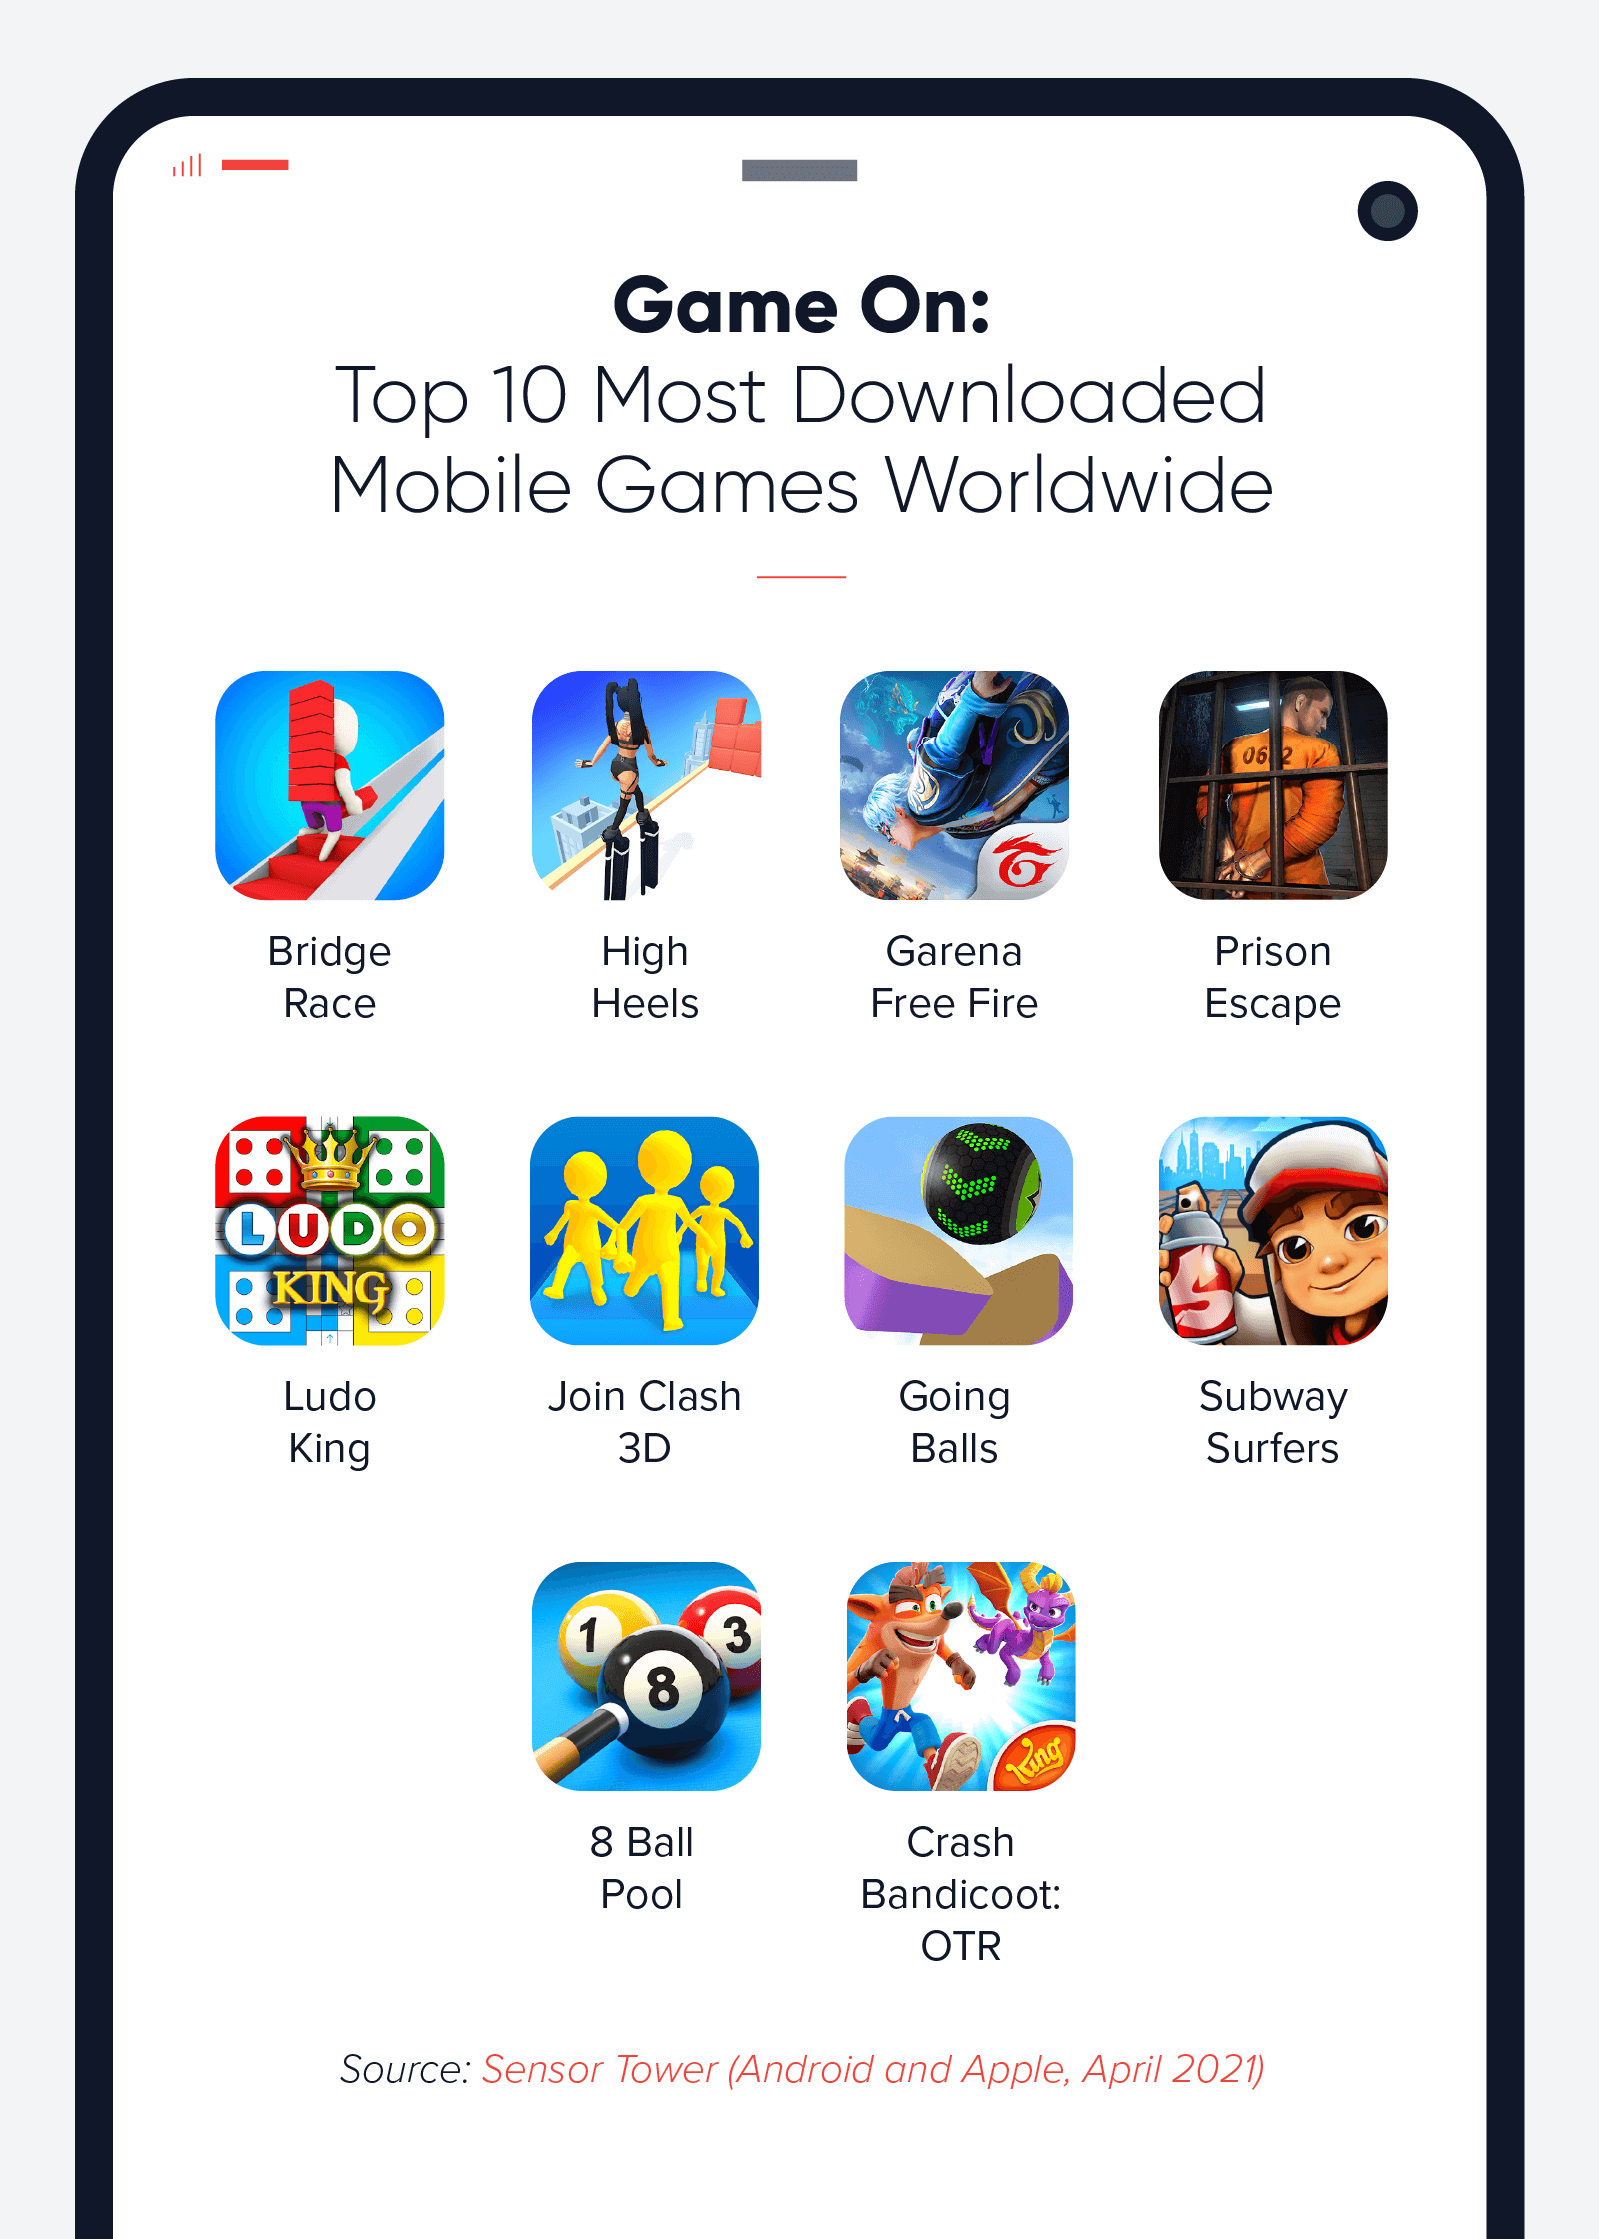
- In April 2021, Bridge Race, the mobile gaming app from Supersonic Studios, was the most downloaded mobile game worldwide with 28 million installs. [Source: Sensor Tower*]
- Supersonic Studios published three of the top 10 most downloaded games worldwide for April 2021. Other titles include Join Clash 3D and Going Balls. [Source: Sensor Tower*]
- You’ll find more gamers on Android — 78% are Android users.[Source: TechJury*]
- There were 303.7 million mobile users in the US and Canada in 2020 and 238.7 million are active mobile gamers. [Source: The NPD Group*]
- The worldwide cloud gaming market will grow to 124.7 million users by 2022 [Source: Newzoo*]
- In terms of gaming genres, casual gaming saw the most significant global download growth — 45% year over year in H1 2020. [Source: App Annie*]
- 51% of mobile gamers are women. [Source: MoPub*]
Ecommerce Apps Download and Usage Statistics
In the last year, the ecommerce industry has had a digital makeover, particularly when it comes to consumer behavior. Throughout 2020, more people stayed home and shopped online and through their favorite shopping apps. And it’s no surprise that convenience retailers such as Amazon saw some of the biggest uplifts in activity. Read on for key ecommerce app download and usage statistics.
- Amazon, Walmart, and Wish were the top three most downloaded shopping apps in the US in 2020 with 41 million, 34 million, and 30 million downloads respectively. [Source: Apptopia*]
- Wish has more than 100 million monthly average users and 500+ million partner merchants. [Source: Wish*]
- The Walmart Grocery app saw an all-time high in US downloads during the week of March 29 to April 4, 2020: 14.4 million, surpassing downloads of the Amazon app by 20%. [Source: App Annie*]
- Almost half (49%) of US mobile users said that they used shopping apps in 2020 to compare pricing. [Source: Statista*]
- 57% of shoppers use a retailer’s app while in the physical store. [Source: Data Axle*]
- The mobile wallet industry market will grow to $3.5 trillion in value by 2023. [Source: Finaria*]
- Consumer spending on non-game apps will overtake that of games on the App Store by 2024, while non-game app spend growth will surpass growth from mobile games on Google Play. [Source: Sensor Tower*]
- 53.9% of all US retail ecommerce will be mcommerce by 2021. [Source: Statista*]
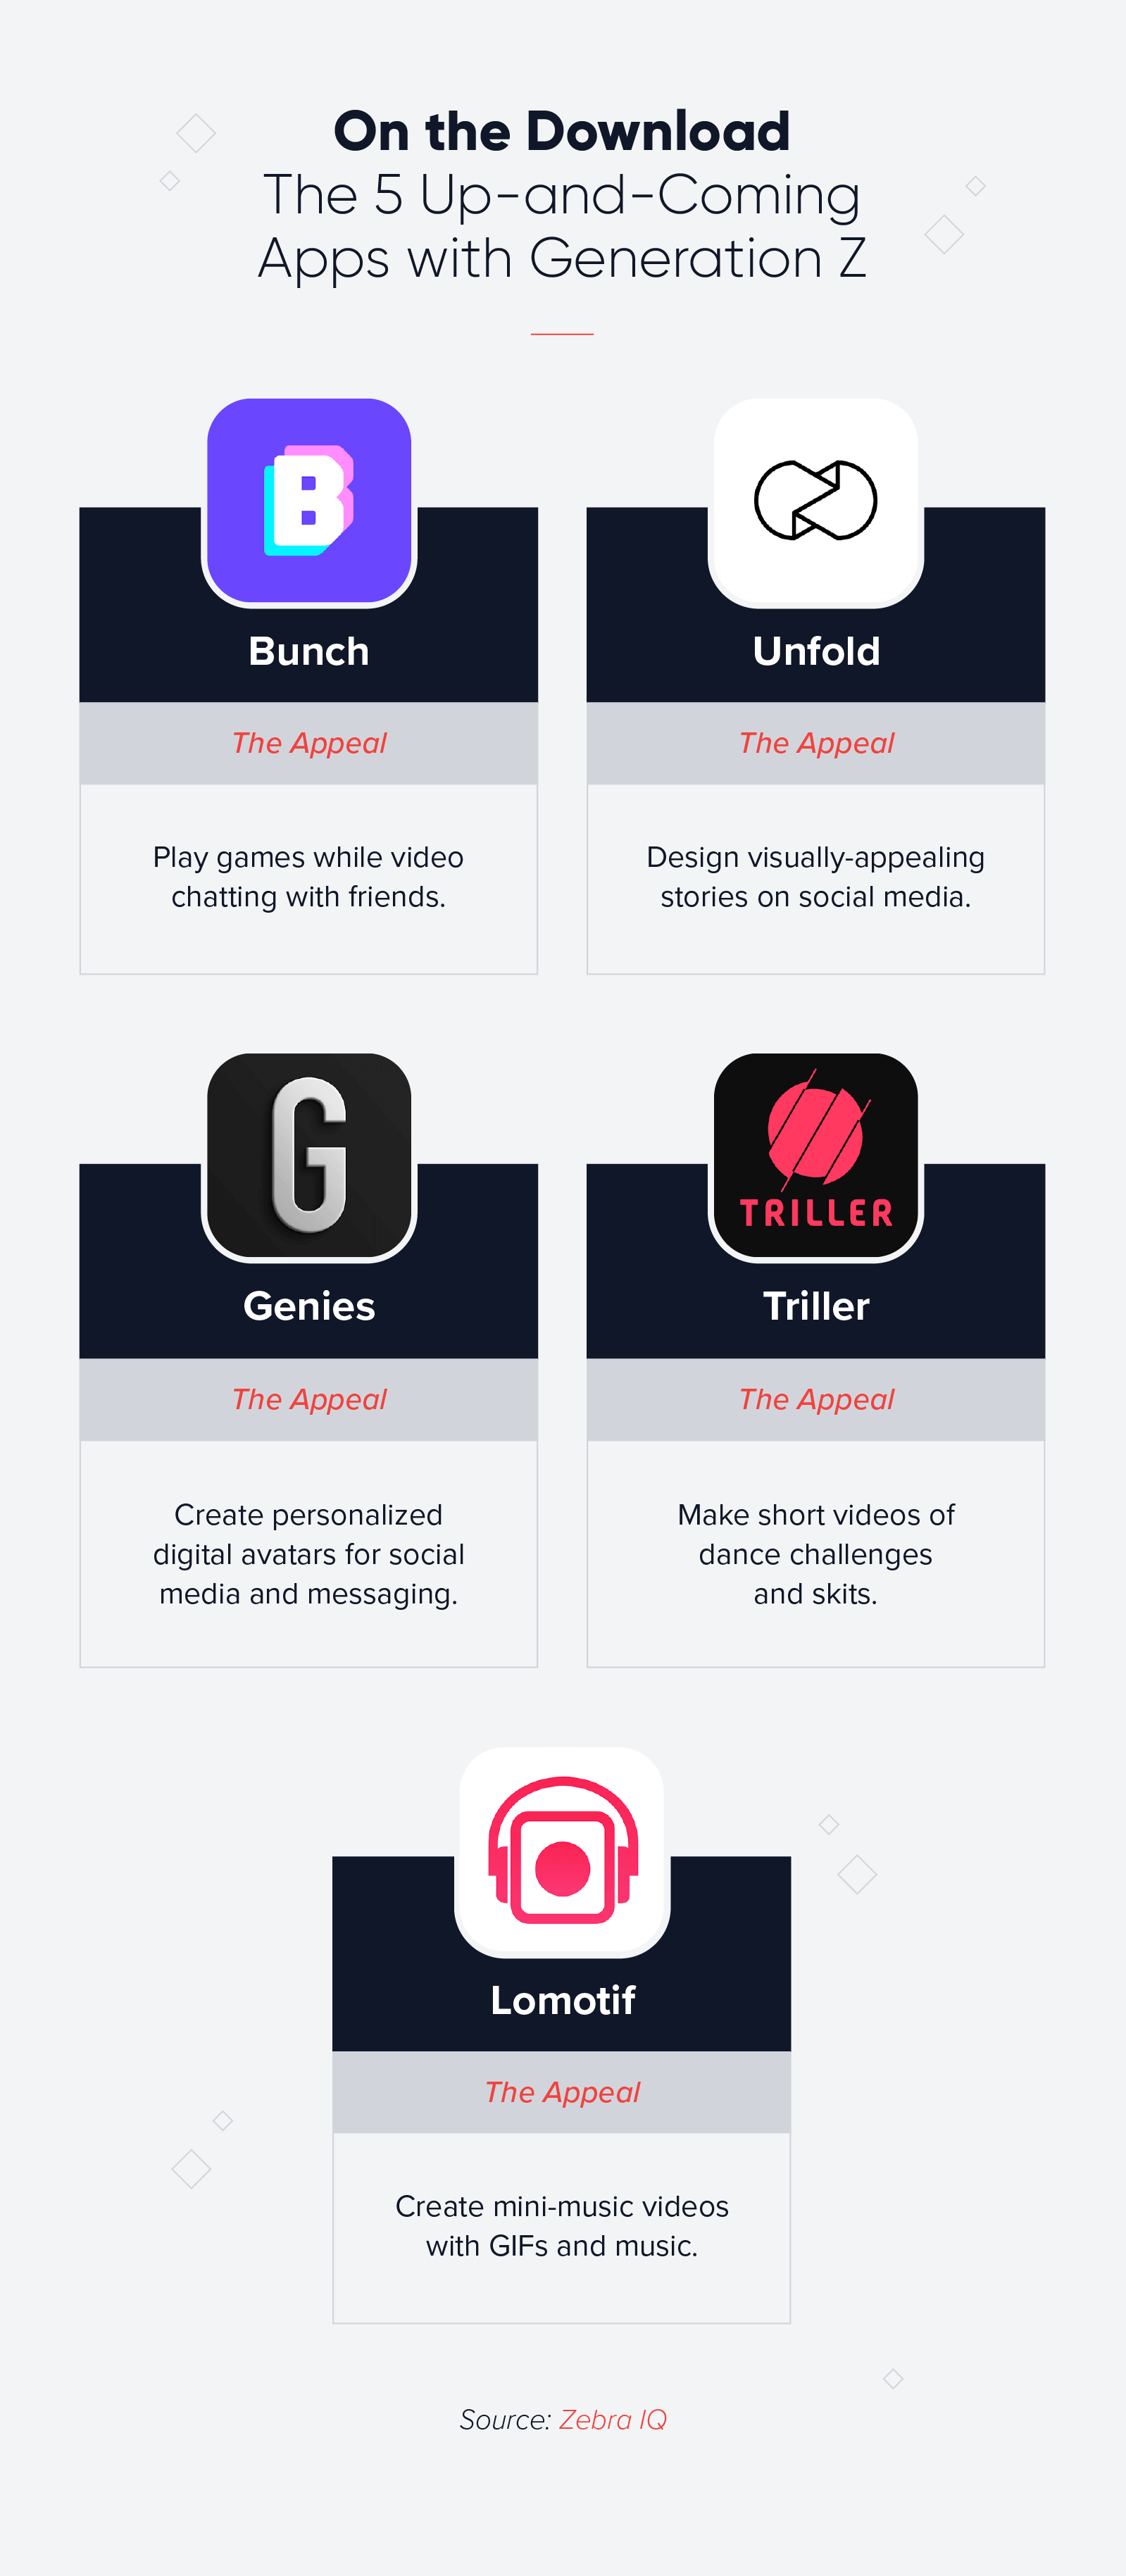
The Apps Favored by Generation Z
In case you’re unfamiliar with Generation Z, let’s do a quick refresher: anyone born between 1997 and 2012 is considered part of this generation. In 2018, an independent study estimated that Gen Z’s direct and indirect spending power would reach $143 billion*. This isn’t a number that brands can afford to miss out on, and when it comes to mobile apps, it’s not about present usage and downloads, but about what the future holds. Read on to learn more.
- Gen Z users spend an average of 4.1 hours per month in top non-gaming apps. [Source: App Annie*]
- Out of all generations, Gen Z are the most likely to cite online sources for all of their top three favorite places to research luxury fashion. [Source: Econsultancy*]
- In the majority of markets analyzed, TikTok and Snapchat are the most over-indexed apps among Gen Z. [Source: App Annie*]
- As of June 2020, roughly 70% of Generation Z members in the United States frequently used in-store shopping reward apps and savings apps. [Source: Statista*]
- Gen Z spent 60% of their time with apps in finance and shopping app categories during Q3 2020 compared to the same quarter the year before. [Source: App Annie*]
- Just 33% of Gen Z identify as mobile gamers compared to 40% of Millennials. 47% of Gen Z play mobile games from 11 to 30 minutes at a time. [Source: AdColony*]
- 28% of Gen Z are currently watching content on Twitch weekly or more. [Source: YPulse*]
- TikTok will have 37.3 million Gen Z monthly users by the end of 2021 compared to 33.3 million on Instagram. [Source: eMarketer*]
Top Mobile Apps by Country and Category
If there was ever a barometer of the state of the world, it’s the most popular apps of 2020 by category and country. As mentioned above, TikTok was a clear leader on this list, and in multiple markets, and apps like Zoom and Google Meet saw significant growth due to an increase in working from home. Food delivery apps also saw growth as more people sought the necessary convenience of food at home. The following eight statistics are all from an Apptopia report*.
The Most Popular Apps of 2020, Globally
- Gaming: Among Us (264 million downloads)
- Health and Fitness: Mi Fit (41 million downloads)
- Video on Demand: Netflix (220 million downloads)
- Shopping: Amazon (169 million downloads)
- Dating: Tinder (74 million downloads)
- Communication: WhatsApp (600 million downloads)
- Social Media: TikTok (850 million downloads)
- Food and Drink: Uber Eats (82 million downloads)
10 DAU and MAU Statistics You Need to Know
Two very important metrics for marketers to keep track of are Monthly Active Users (MAU) and Daily Active Users (DAU). When you look at DAU over MAU, you are able to calculate the ratio of users that return every day compared to those returning on a monthly basis. Here are eight key DAU/MAU statistics for some of the world’s most popular apps.
- The latest data shows the Facebook DAU count stands at more than 1.8 billion, which means 66% of registered Facebook monthly users log in daily. [Source: Statista*]
- As of October 2020, according to TikTok’s own analytics, the app was reaching 732 million MAUs around the world, and more than 100 million MAUs in the United States. [Source: TikTok*]
- In October 2020, Among Us hit 50 million DAUs and 250 million MAUs. [Source: Business of Apps*]YouTube has more than 2 billion logged-in monthly users. [Source: YouTube*]
- As of April 2021, Microsoft Teams has 145 million DAUs. In comparison, reports say that Zoom had 300 million daily active participants in 2020. [Source: The Verge*]
- Twitch has more than 15 million DAUs. [Source: Business of Apps*]
- In 2019, more than 4,600 apps saw 1 million MAUs. [Source: Tech Crunch]
- Roblox, the online gaming platform, averaged 42.1 million daily active users in Q1 2021. [Source: Statista*]
It’s no secret that the mobile app space is highly competitive but that doesn’t mean that opportunities are lost in this crowded ecosystem. Just as there is no shortage of available apps, there is no shortage of mobile users. However, the success of your apps is largely dependent on how sophisticated and effective your mobile marketing strategies are.
With the right combination of behavioral segmentation, retention, and growth, your mobile app can go to the next level in 2021 and beyond.


See how today’s top brands use CleverTap to drive long-term growth and retention
Subharun Mukherjee 
Heads Cross-Functional Marketing.Expert in SaaS Product Marketing, CX & GTM strategies.
Free Customer Engagement Guides
Join our newsletter for actionable tips and proven strategies to grow your business and engage your customers.
