


Table of Contents
Categories
Most Popular


You sent out a weekend price drop notification on domestic flights to your users. The campaign got a 4.8% click-through rate — twice your daily average.
Awesome!
But is that a good click-through rate… or just good for you? What kinds of CTRs are your competitors and fellow travel apps seeing?
One of the biggest challenges mobile marketers face is measuring performance and results. In a world where the competitive landscape for mobile apps is changing constantly, its critical for marketers to benchmark their growth against industry standards.
We analyzed anonymous users who performed over 55 billion events across 1 billion devices in 2018 to understand what makes the fastest-growing travel apps succeed.
Our latest benchmark report lets you quantify where your app stands in the travel app industry by providing all the essential metrics for each stage of the user lifecycle.
Compare your app’s metrics to the industry standard, spot the areas that need your attention and get data-driven insights to improve conversions at every stage. Plus you’ll get unique insights into how many users transition to the next stage in the customer journey — and how long it typically takes.
Want to jump straight to the report?
Let’s Look at Onboarded Users
Marketers need to monitor the opt-in rates of new users. These opt-in rates signify the percentage of users who have give permission to contact them on various channels like in-app, push, email, SMS, etc.
Here’s the industry benchmark for opt-in rates for Travel apps: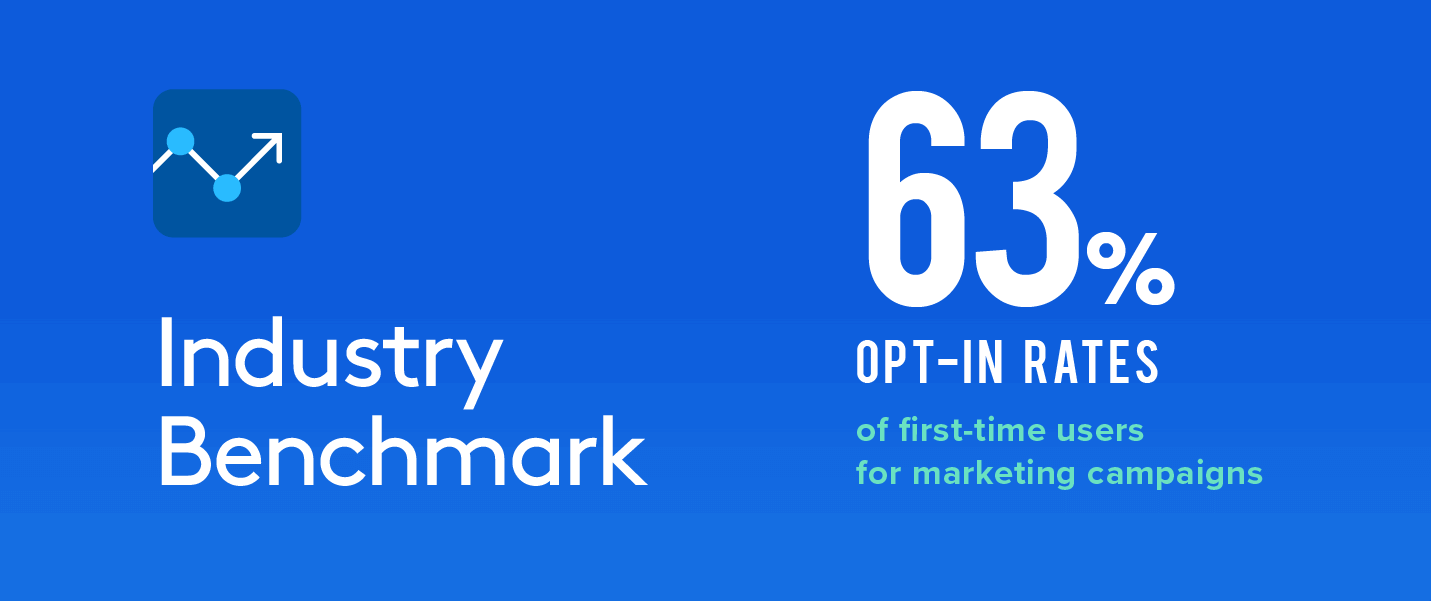
With this metric, you can understand how effective your app’s onboarding process is and what you can do to drive opt-ins.
Here are a few pointers to improve opt-in rates:
- Welcome your new users with a personalized in-app message on their first launch
- Promote opt-ins by conveying the value notifications can provide users
- Understand when users are most active in your app to engage them at the right time
Transitioning from Onboarding to Engagement
How many of your new users are moving to the next stage? How long does it take them? And what’s the industry standard for this?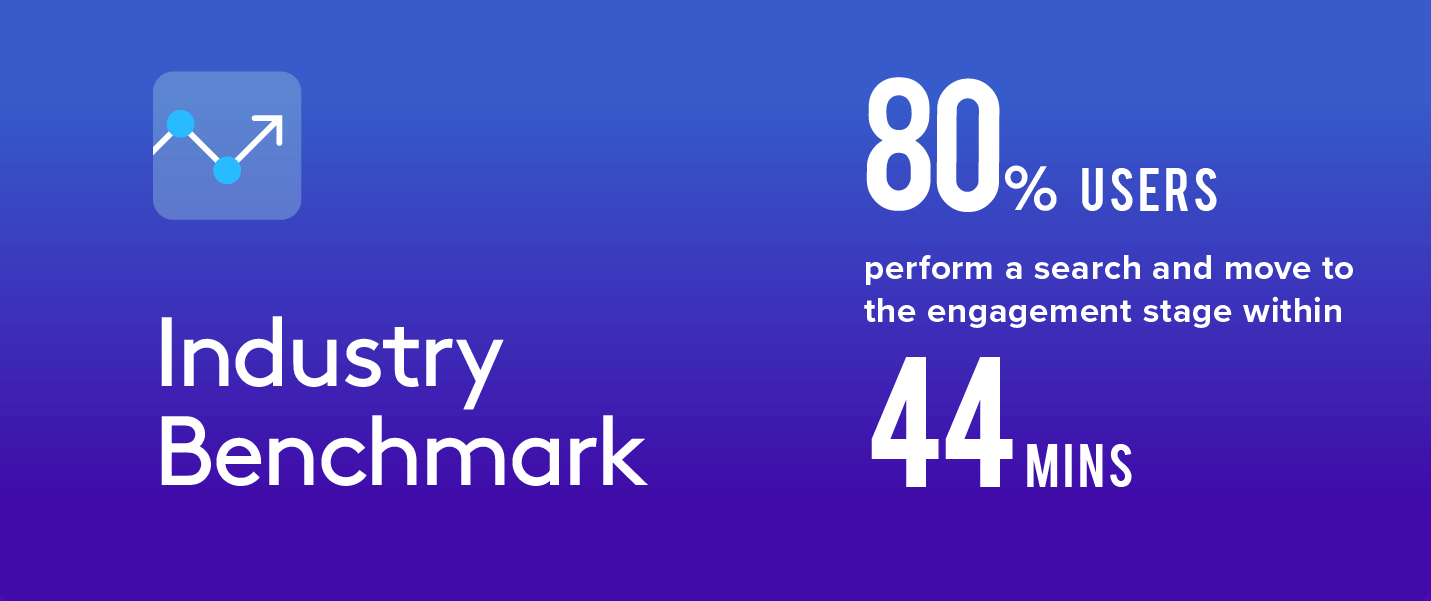
By comparing how many new users advance to the engagement stage, and the time it takes, you can quickly spot any problem areas in the user journey.
Here are a few ways to optimize the user journey funnel from onboarding to engagement:
- Send offers and coupons to first-time users via SMS
- Use geolocation to send personalized recommendations based on region, language, timezone
- Provide a seamless experience by using deep links to take users directly to the booking page
About-to-Churn Users
Churn represents the number of users who stop using your app within a given period. Here’s the industry benchmark for churn rates for Travel apps: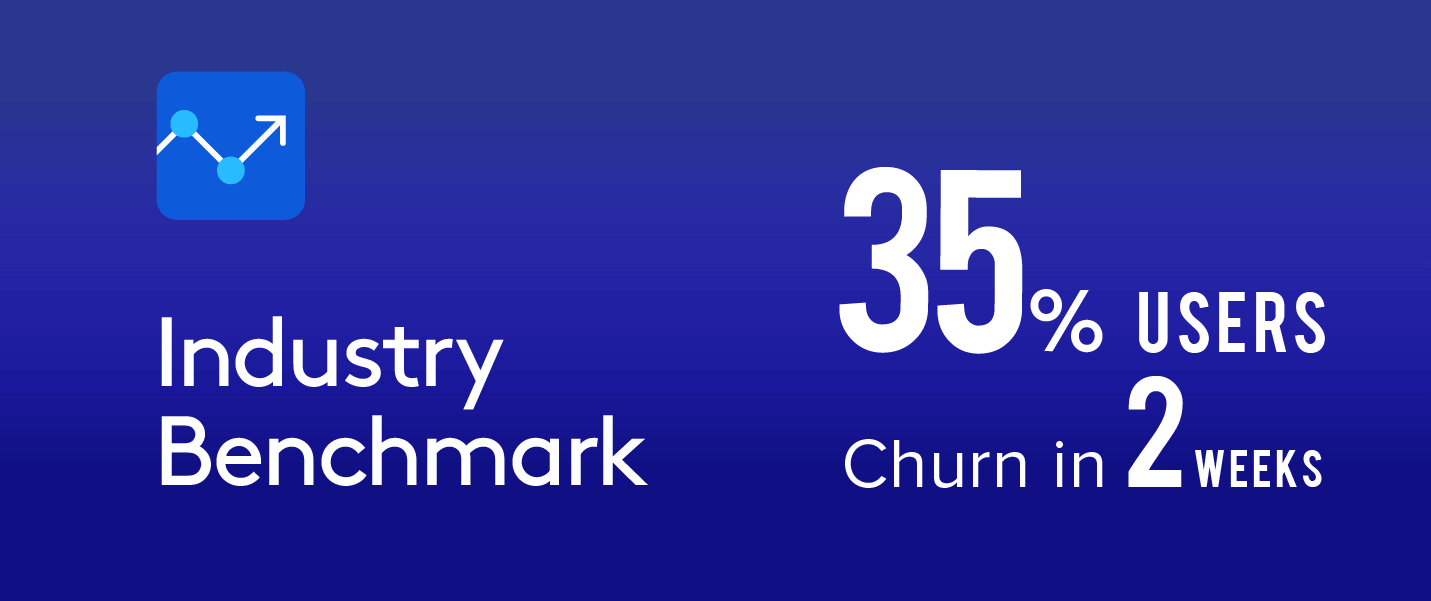
Users you’ve nurtured over time should be monitored closely to ensure they don’t churn. Identify early signs of potential uninstalls to proactively engage users and reduce the chances of them turning inactive.
Here are a few pointers to prevent churn:
- Understand what most of your users do right before they uninstall your app
- Use search history to send price drop alerts to users who are about to churn
- Remind users of unexplored features or benefits of your app
Get the Complete Report
Download the full report to get all the essential data and metrics for every user lifecycle stage.
Armed with the latest data, you’ll be able to benchmark your app’s performance as well as get a deeper understanding of the current state of the travel app industry — and where it’s headed.
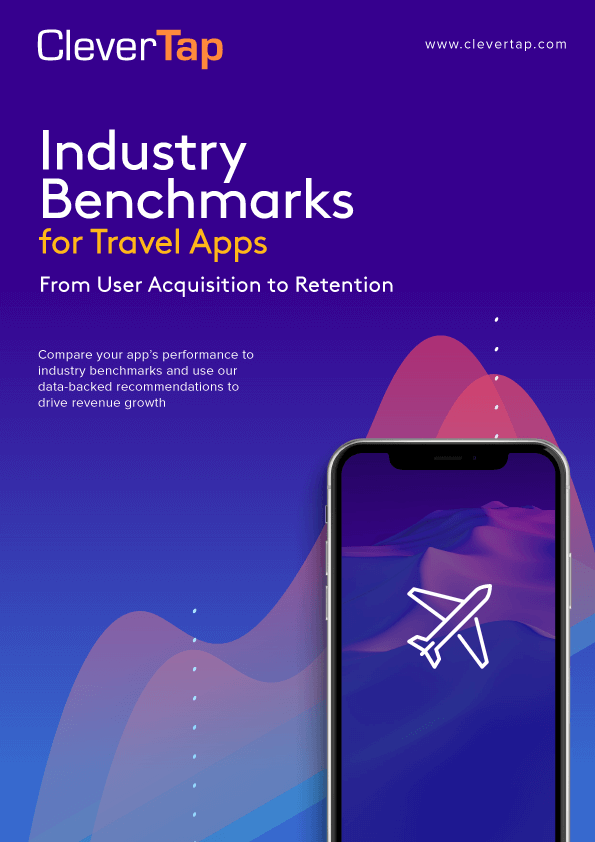
Industry Benchmark for Travel Apps
Subharun Mukherjee 
Heads Cross-Functional Marketing.Expert in SaaS Product Marketing, CX & GTM strategies.
Free Customer Engagement Guides
Join our newsletter for actionable tips and proven strategies to grow your business and engage your customers.
