











































Table of Contents
Categories
Most Popular

SWOT analysis is only useful when it leads to action.
In marketing, that action can mean changing your budget or the campaigns you run. If you’re doing it just to fit it on a slide, rethink it.
SWOT analysis in marketing is meant to help a team decide where the next dollar and the next sprint go. Used effectively, it creates an impact on the real marketing metrics that you actively monitor.
SWOT analysis’ main purpose is to help a team decide where the next dollar and the next sprint go.
What Is a SWOT Analysis in Marketing?
In marketing, strengths, weaknesses, opportunities, and threats (SWOT) analysis is a framework that shapes growth into four boxes. Strengths and weaknesses describe what’s true inside a brand. And opportunities and threats tell what’s happening in the market around it.
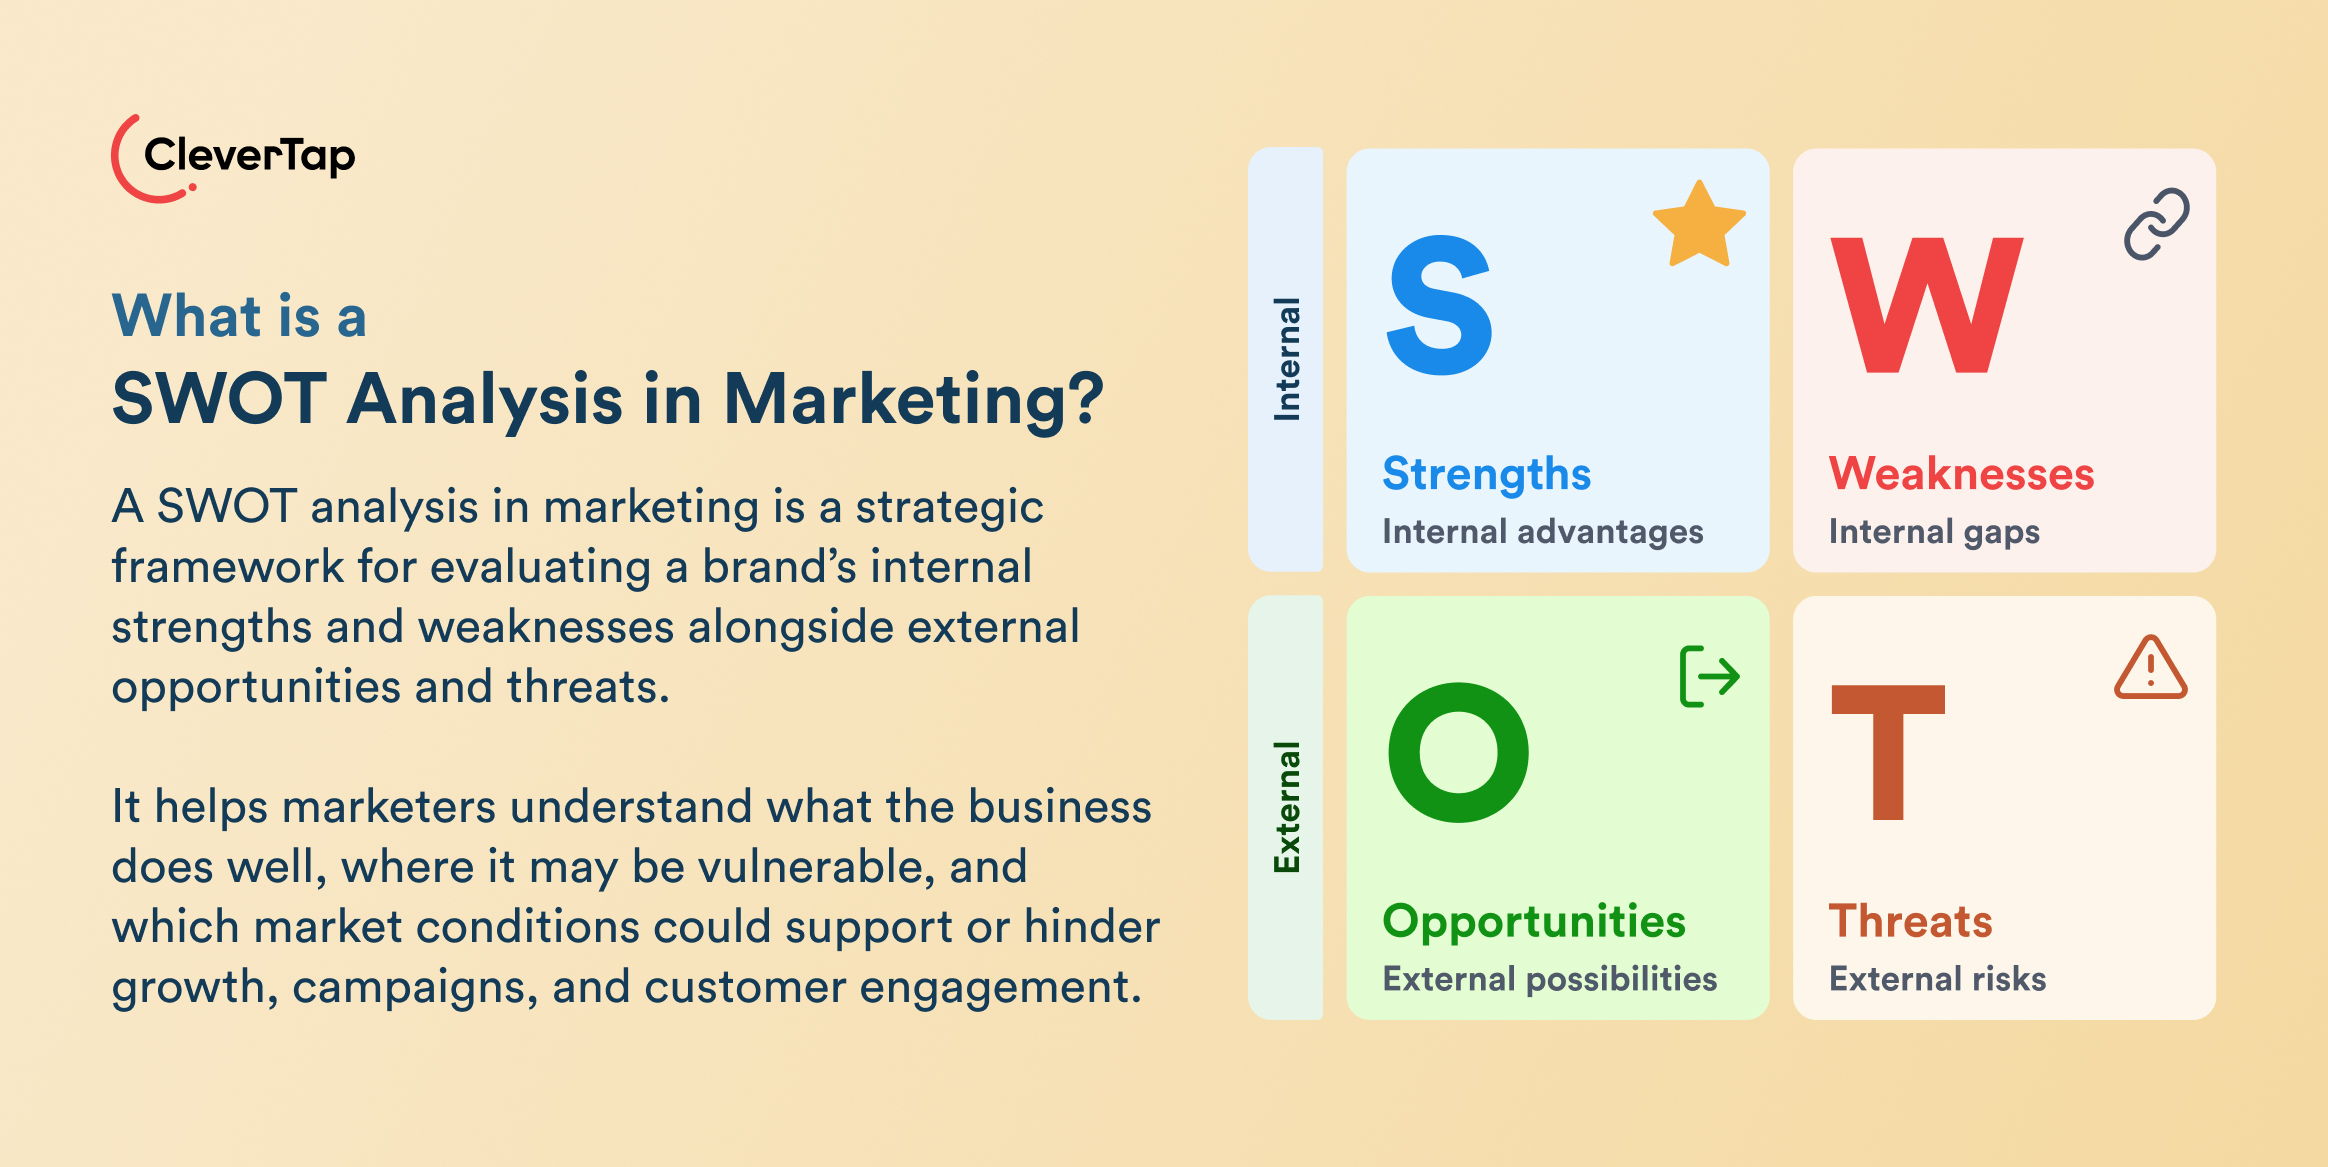
What SWOT means in marketing:
- Strengths are internal advantages you can build on: high brand trust, a clean first-party data pipeline, or strong app engagement.
- Weaknesses are internal gaps that hold campaigns back: high app churn, an onboarding flow that leaks users, or a legacy tech stack that slows every launch.
- Opportunities are external conditions you could use: AI personalization becoming affordable, a new region opening up, or a competitor leaving a segment.
- Threats are external forces that could hurt you: tightening privacy rules under GDPR and CCPA, aggressive competitor discounting, or rising ad costs.
The line between internal and external is the whole point of the exercise. As Prof. Mark Harvey puts it, opportunities and threats “come from outside of you, things that you can’t usually control.” Strengths and weaknesses are yours to change.
| Helpful to your goal | Harmful to your goal | |
| Internal (you control it) | Strengths | Weaknesses |
| External (you respond to it) | Opportunities | Threats |
The split tells you which lever to pull. For an internal weakness, you need to fix it. But if it’s an external threat, you’ll need to defend against it.
What a SWOT is not: SWOT analysis isn’t a strategy, a roadmap, or a list of campaign ideas. The most common beginner mistake is confusing opportunities with project ideas. A SWOT is “a description of a current situation,” he explains. Initiatives belong in a later step, which this guide covers in the TOWS section.
Knowing what the four boxes hold is the easy part. The harder question is why a marketing team should bother filling them at all.
Why Is a SWOT Analysis Essential for Modern Marketing Strategies?
SWOT analysis’ main purpose is to help a team decide where the next dollar and the next sprint go.
For example, customer acquisition cost (CAC) in fintech is roughly $202, and $258 for banking apps. This cost pays back only if a customer stays. Another report that discusses finance apps’ 30-day retention mentions that the retention percentage dropped from 3 to 2 percent year over year.
If you put these facts in a SWOT matrix, you’ll put churn in a weakness box and acquisition cost in a threat box. It guides you toward a decision that you’ll need to fix the onboarding first to raise return on every customer acquisition that follows. But if you invest heavily in acquisition first, it just pours budget into a leaky bucket.
This way of decision-making makes SWOT analysis essential in marketing. In this case, there are only two variables at play, so the decision seemed obvious. But when you do a real analysis with all variables realistically contributing to decisions, a SWOT grid helps you see what decisions contribute toward your goal.
The other reason is defense. External threats change shape faster than most annual plans. For example, Google’s decision to keep third-party cookies in Chrome removed a deadline many teams had planned around, but it did not remove the privacy pressure behind it.
A quarterly SWOT analysis helps you see that shift and strategize accordingly.
The 4 Quadrants of a Marketing SWOT Analysis (+ Examples)
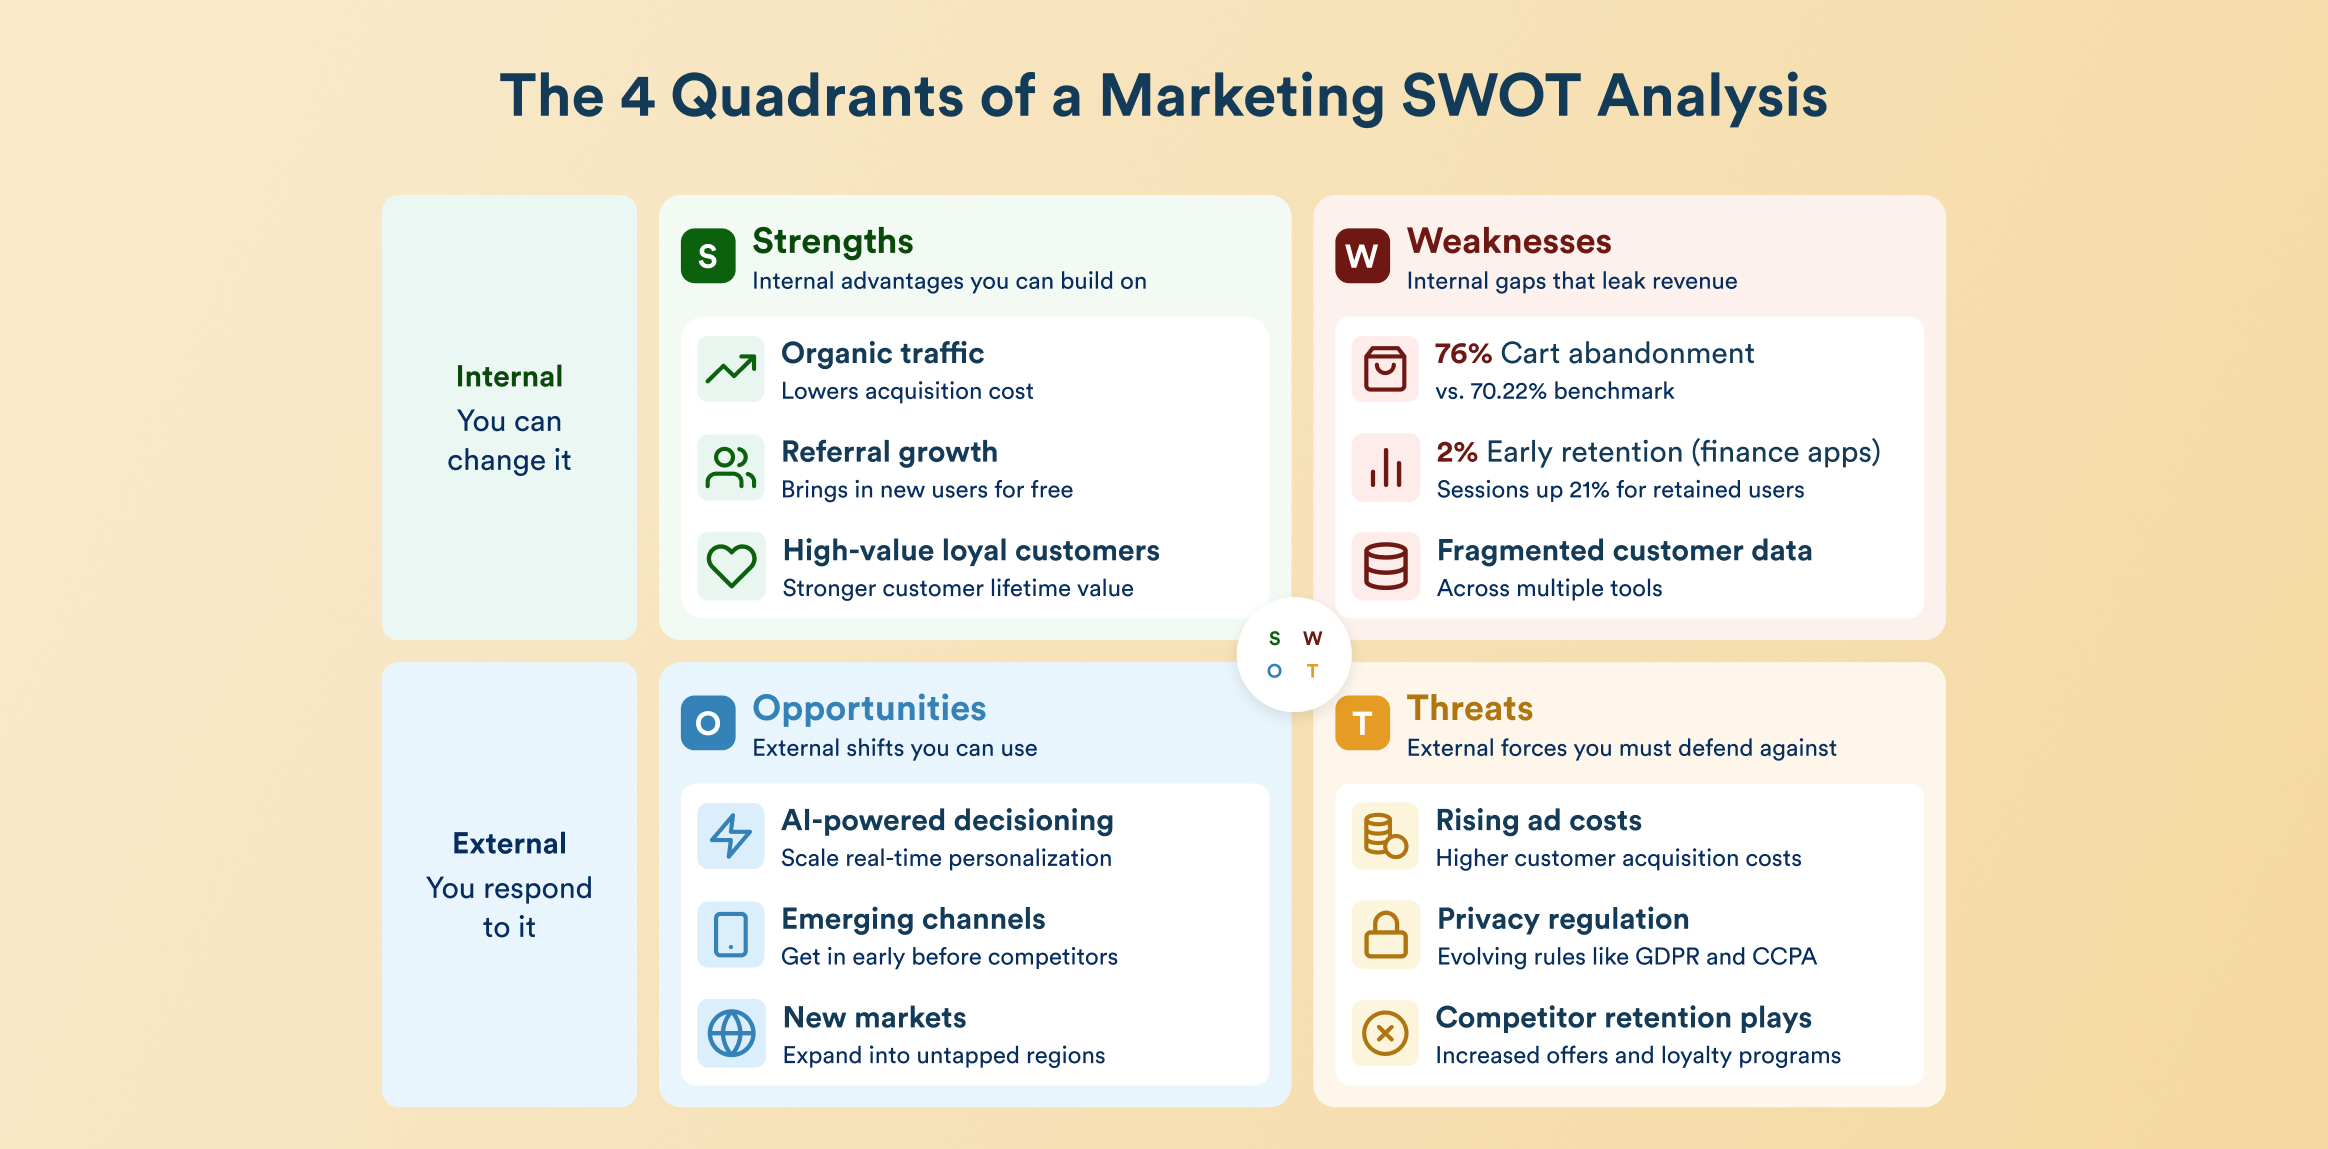
When filling the 4 quadrants of a marketing SWOT analysis, you have to add actionable entries that carry a metric, a benchmark, or a direction. If you fill it with vague entries like “strong brand,” it doesn’t support decision-making.
Strengths: Internal Advantages You Can Measure
Open your strengths quadrant with the assets your competitors cannot copy quickly.
For a consumer brand, those usually include organic traffic that lowers blended acquisition cost and a referral rate that grows the user base for free.
A loyal cohort with strong customer lifetime value belongs here too. It can also be something like first-party data. A clean pipeline of consented behavioral data is a compounding strength that later feeds personalization and prediction models.
If possible, quantify each one against a benchmark.
Weaknesses: Internal Gaps That Leak Revenue
Start your weaknesses quadrant where the funnel leaks.
For e-commerce and D2C brands, the largest leak is usually the cart. Baymard Institute’s running average across 50 studies puts online cart abandonment at 70.22%. If your rate sits above that, the weakness is specific and fixable.
For app-led brands, the leak is early retention. Research reports a 2% retention rate for finance apps, and finds that the same report observed app sessions increase by 21%. This means users who stay tend to use the app more. The weakness is the first 30 days.
There are two weaknesses that rarely show up in a dashboard, but they belong. For example, fragmented user data across tools and slow campaign launch cycles. These are internal, controllable, but still quietly cap how fast you can act on anything in the analysis.
Opportunities: External Shifts You Can Use
Fill your opportunities quadrant with conditions that exist whether or not you act on them. AI is the clearest example right now. Scaling real-time AI decisioning into live campaigns, while most competitors are still experimenting, is an opportunity.
Emerging channels belong here too. A platform where your competitors are not yet strong is an external condition you can exploit, but only for as long as it stays that way.
Threats: External Forces You Must Defend Against
Populate your threats quadrant with forces that raise your costs or lower your returns. Ad-cost inflation leads the list.
Privacy regulation is the second threat, and it needs careful wording. Additionally, competitor retention plays and economic downturns round out the quadrant. Both are external, both are unavoidable, and both punish brands that scaled acquisition before they fixed retention.
A grid built this way already tells a story. To see the full story in one place, it helps to run the exercise on a single brand.
SWOT Analysis Marketing Example: A FinTech Mobile App
The figures in the matrix below are example values, not sourced benchmarks. The verified numbers around it show why each entry belongs where it sits.
Say you run marketing for a growing consumer fintech app. You compete with traditional banks on one side and well-funded challenger apps on the other. Your growth team owns activation, engagement, and paid acquisition, and you are deciding where next quarter’s budget goes.
| Helpful | Harmful | |
| Internal | StrengthsS1: 4.8-star app store ratingS2: Real-time push engine with event-level triggersS3: 40% of new users arrive through organic referralS4: Consented first-party behavioral data on every user | WeaknessesW1: Sharp drop-off at the KYC verification stepW2: No personalization of in-app credit offersW3: Day-30 retention below the 2% vertical average |
| External | OpportunitiesO1: Gen Z demand for automated savings toolsO2: Open-banking APIs enabling account aggregationO3: AI decisioning maturing faster than competitors can scale it | ThreatsT1: Incumbent banks cloning challenger featuresT2: Rising CPI on paid channels driven by competitionT3: Banking CAC benchmark of $258 per customer |
Every weakness in this grid has a real-world echo. Fenergo’s 2025 survey of 600 financial-institution decision-makers found 70% lost prospective clients in the past year because of slow or inefficient onboarding, up from 48% in 2023.
Onboarding abandonment now averages about 10%. W1 is not a hypothetical problem. It is the most common one in the vertical.
How the Team Extracts Priorities From the Matrix
Read the grid for tension. Three tensions stand out.
- W1 and T3 sit in the same funnel. The app pays roughly $258 to acquire a banking customer and then loses a meaningful share of them at KYC. Every point of KYC drop-off recovered is worth more than any paid channel improvement, because it raises the return on spend already committed.
- S4 and T2 point to the same answer. Rising CPI hurts brands that depend on third-party targeting. A brand with consented first-party data can build lookalike audiences, retarget from its own signals, and shift budget toward the 40% organic referral engine in S3.
- W2 and O3 form a matched pair. The app already has the data and the push engine. It lacks the decisioning layer that turns them into personalized credit offers. That gap is exactly what maturing AI tooling closes.
Noticing these pairs is the beginning of strategy. Doing it reliably, quarter after quarter, needs a process.
How to Conduct a Data-Driven SWOT Analysis in Marketing in 5 Steps
A marketing SWOT is only as good as its inputs. Here’s how to build the grid based on evidence:
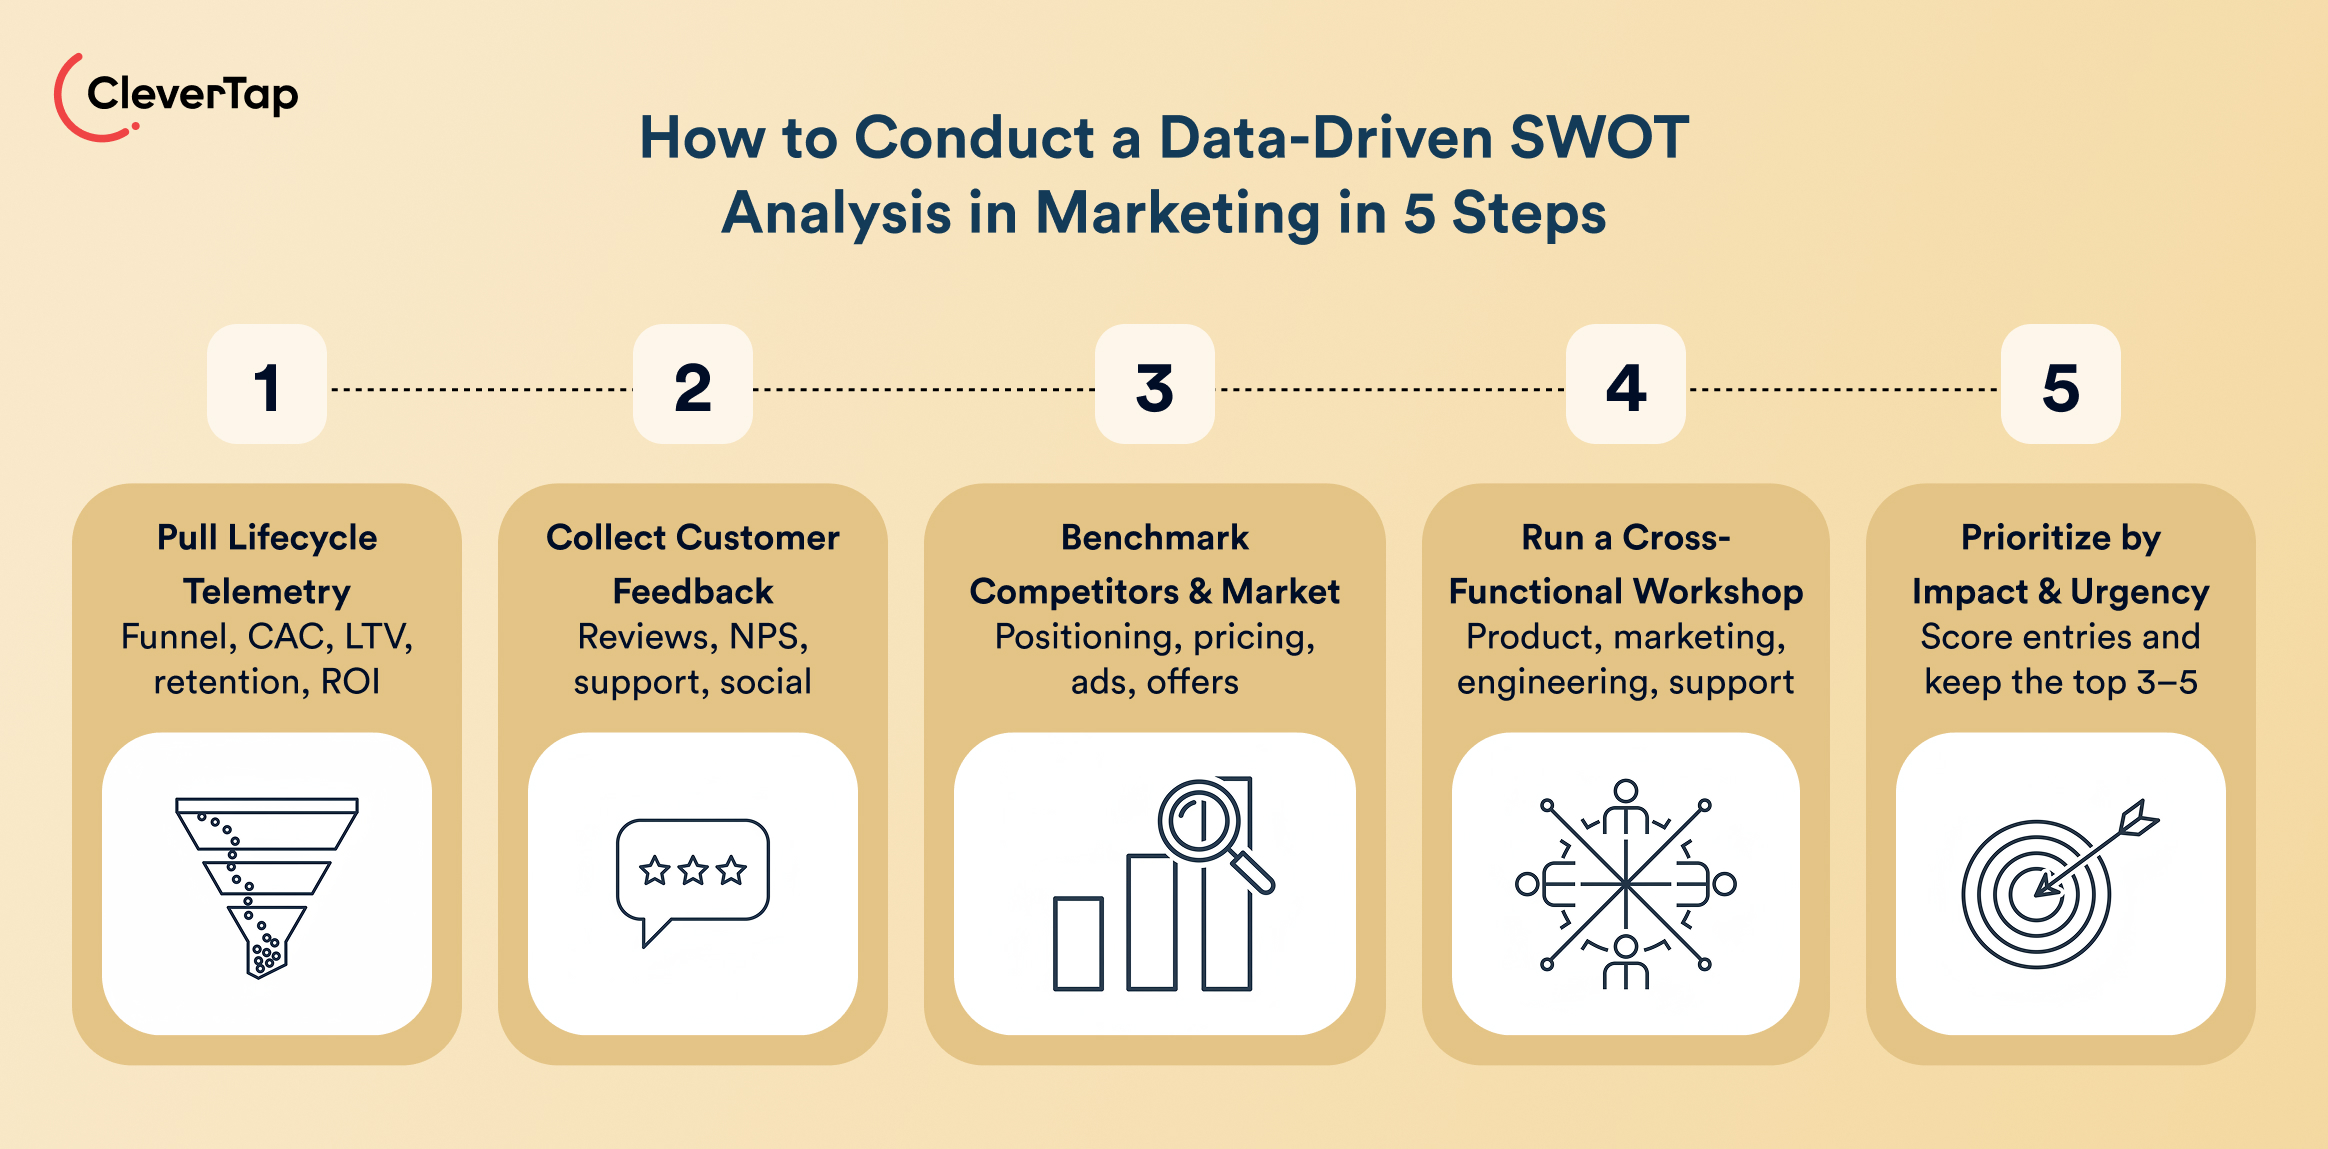
1. Pull Lifecycle Telemetry Before Anyone Opens a Whiteboard
Export the numbers that describe your funnel today. At minimum: drop-off by onboarding step, CAC by channel, LTV by cohort, Day-1, Day-7, and Day-30 retention, and campaign ROI for the last two quarters.
Compare each to a published benchmark, such as the $202 consumer fintech CAC or the 70.22% cart abandonment average. Any metric that sits meaningfully above or below its benchmark is a candidate strength or weakness. This step alone removes most of the vague entries that make SWOTs useless.
2. Collect Voice-of-Customer Feedback
Read what users say in their own words. App store reviews, NPS verbatims, support tickets, and social mentions reveal weaknesses the dashboard cannot name. A retention curve would show that users leave at day three. It’s the one-star review that explains why.
Speak with the client-facing teams. Look closely at what people request, ask about, or complain about. When these change, it hints at changes in the market.
3. Benchmark Against Competitors and the Market
Audit how competitors position, price, and advertise. Pull their app store ratings, their ad creative, their onboarding flows, and their retention offers. This step populates the external quadrants.
A competitor’s new feature is a threat. A gap none of them fills is an opportunity.
4. Run a Cross-Functional Audit Workshop
Bring product, marketing, engineering, and support into one room with the data from steps 1 to 3 already on the wall. Marketing alone will over-weight brand and under-weight the tech debt that slows every launch. Engineering alone will do the reverse.
Have each person write entries independently before discussion, then group and consolidate. This keeps loud voices from setting the agenda.
5. Prioritize by Impact and Urgency
Score every entry on two axes: how much it moves the goal, and how soon it must be addressed. Keep the top three to five per quadrant and cut the rest.
At the end of step 5, you have a ranked, evidence-backed grid. It’s still a description. The next section turns it into decisions.
How to Use the TOWS Matrix to Build Your Marketing Plan
A TOWS matrix crosses your internal factors against your external ones. Instead of asking what your strengths are, it asks what becomes possible when a specific strength meets a specific opportunity or threat.
SWOT categorizes your data points effectively, but it doesn’t provide the logic to connect those factors into an actionable plan. TOWS supplies that logic through four crossings.
| Opportunities (O) | Threats (T) | |
| Strengths (S) | SO (Maxi-Maxi): use strengths to seize opportunities | ST (Maxi-Mini): use strengths to counter threats |
| Weaknesses (W) | WO (Mini-Maxi): fix weaknesses by using opportunities | WT (Mini-Mini): minimize weaknesses to avoid threats |
Applied to the fintech app from the example above, each crossing produces a campaign rather than a bullet point. Together, the four form the core of a SWOT analysis marketing plan.
- SO Strategy (S3 + O1): The app has a 40% organic referral rate, and Gen Z wants automated savings tools. The campaign can be to launch a round-up savings feature with a referral bonus attached, so the feature spreads through the channel that already works.
- WO Strategy (W2 + O3): Credit offers are not personalized, and AI decisioning is now mature enough to scale. Replace the static in-app credit banner with offers ranked per user by likelihood to accept.
- ST Strategy (S4 + T2): First-party data meets rising CPI. The campaign: shift acquisition budget from broad paid prospecting toward first-party lookalikes and referral, and hold paid spend for the segments that data shows convert.
- WT strategy (W3 + T3): Weak Day-30 retention meets a $258 acquisition cost. The decision: pause the least profitable paid channels until onboarding retention clears a set threshold, then reopen them. It is the least glamorous crossing and often the highest-return one.
Every crossing above ends in a campaign. Running those campaigns well is a separate skill, and it is where most of the value gets captured or lost.
Translating Your SWOT Into Real-Time Customer Engagement Tactics
To turn a TOWS strategy into a working program, you need practices that work at scale, while giving customers new reasons to come back to your application.
Fix Weaknesses With Automated Journeys
Build an onboarding journey that responds to what each user does, not to a calendar.
- A KYC drop-off weakness, for instance, becomes a triggered sequence.
- An in-app nudge fires when a user stalls at document upload.
- A push notification follows if they leave, and an email with a one-tap return link goes out if they stay away.
Each touchpoint fires on behavior, so the journey meets users where the drop-off actually happens.
Kippa, a financial-management app for small businesses across Africa, took this approach with CleverTap. The growth team built onboarding journeys covering every event from install to activation and segmented users by the actions they took. It then used in-app messages to cross-sell features like invoicing and payments.
Against control groups, Kippa saw a 5% to 6% uplift in user activation, which fed directly into more weekly transacting users. That is a WO strategy running in production.
Seize Opportunities With Live Personalization
Replace static segments with ones that update as behavior changes.
A “high intent, no purchase” segment built once is stale in a week. A dynamic segment that adds and removes users in real time keeps every campaign pointed at the right people.
Layer contextual offers on top: a credit offer shown after a user checks their balance three times lands differently than the same offer shown on install.
This is where an agentic AI layer earns its place. CleverAI™ handles the decisioning that a SWOT identifies as an opportunity but a marketing team cannot run by hand.
- Its Segment Builder Agent turns a plain-language description into an editable segment.
- Its Predictions Agent scores who is likely to churn or convert, and its Recommendations Agent picks the right product or offer per user.
- Its Send Time Optimizer Agent and Channel Optimizer Agent decide when and where each message lands.
Together they make the WO crossing from the previous section a configuration task rather than an engineering project.
Keep the SWOT Alive With Continuous Monitoring
Treat the grid as a living document synced to your analytics.
In practice, that means a quarterly review where each SWOT entry has a metric attached and a dashboard behind it. When Day-30 retention crosses the threshold you set in your WT strategy, the paused channels reopen.
When CPI on a channel climbs past your ceiling, budget shifts. The review becomes a check on numbers that already moved.
With the loop in place, the remaining questions are mostly about cadence and scope.
Stop Filing the Grid and Start Running It
A SWOT that ends in a slide is a waste of the hours it took to build. A well-done marketing SWOT analysis runs in a loop. Telemetry and customer feedback populate the quadrants.
The TOWS matrix crosses them into a short list of strategies. Automated journeys and live personalization execute those strategies. Analytics feed the results back into the next quarter’s grid. The exercise never sits still.
CleverTap is built for the execution half of that loop. Its journey builder turns a weakness into a behavior-triggered sequence, and its segmentation keeps every campaign pointed at the right users. CleverAI™ supplies the decisioning that most teams identify as an opportunity but never manage to scale. The analysis stays yours. The platform handles the follow-through.
See how CleverAI™ turns your next SWOT into live campaigns
FAQ’s About SWOT Analysis In Marketing
1. How often should a marketing team conduct a SWOT analysis?
Run a full SWOT at least once quarterly if you operate in a fast-moving category like fintech, gaming, or D2C. Also run one before any major pivot, product launch, or market expansion, because those decisions change both the internal and external quadrants at once. Between full reviews, keep the metrics behind each entry visible on a dashboard so you catch shifts early.
2. What is the difference between a business SWOT and a marketing SWOT?
A business SWOT covers the whole company: solvency, operations, supply chain, and talent. So what is SWOT in marketing, by contrast? It narrows the lens to acquisition, retention, brand positioning, and channel performance. The internal and external logic is identical. The inputs differ. A marketing SWOT is built from lifecycle telemetry, customer feedback, and competitor benchmarking rather than balance sheets.
3. What is the difference between SWOT and TOWS?
SWOT describes your situation. TOWS decides what to do about it. A SWOT sorts factors into four boxes. A TOWS matrix crosses those boxes to produce four types of strategy: SO, WO, ST, and WT. Most teams stop at SWOT, which is why so many analyses end up as documentation. TOWS turns the grid into a marketing plan.
4. What are the biggest mistakes to avoid in a marketing SWOT?
Four mistakes account for most failed SWOTs. Writing vague entries like “strong brand” instead of measured ones. Ignoring negative user data, especially app store reviews and churn signals, because it is uncomfortable. Relying only on internal assumptions without benchmarking against competitors. And stopping at the grid without converting findings into campaigns.

Subharun Mukherjee 
Heads Cross-Functional Marketing.Expert in SaaS Product Marketing, CX & GTM strategies.
Free Customer Engagement Guides
Join our newsletter for actionable tips and proven strategies to grow your business and engage your customers.