


![New Report: Media & Entertainment [OTT] Mobile App Industry Benchmarks](https://clevertap.com/wp-content/uploads/2018/10/Media-OTT-Benchmark-Report-e1551873037906.png)

Table of Contents
Categories
Most Popular


The OTT space has seen tremendous adoption in the recent years. 53% of households in the US have at least one OTT service, consuming 2.2 hours of content a day an average of 19 days a month.1
In a dynamic and competitive ecosystem where customer preferences keep changing, it becomes increasingly challenging for OTT apps to deliver unique experiences that keep users coming back.
So how do the top OTT apps deliver an engaging user experience?
We analyzed 8.7 billion data points across 100 million devices and 80 million unique users to help you compare your customer engagement strategies against OTT industry benchmarks.
Our latest benchmark report provides data points for each stage of the customer lifecycle, and provides data-backed recommendations and campaign ideas to drive long-term retention.
Want to download it right now?
Onboarding Insights
After a user downloads and launches your app, you need to deliver a perfect First Time User Experience (FTUX) that helps them experience the aha! moment as soon as possible.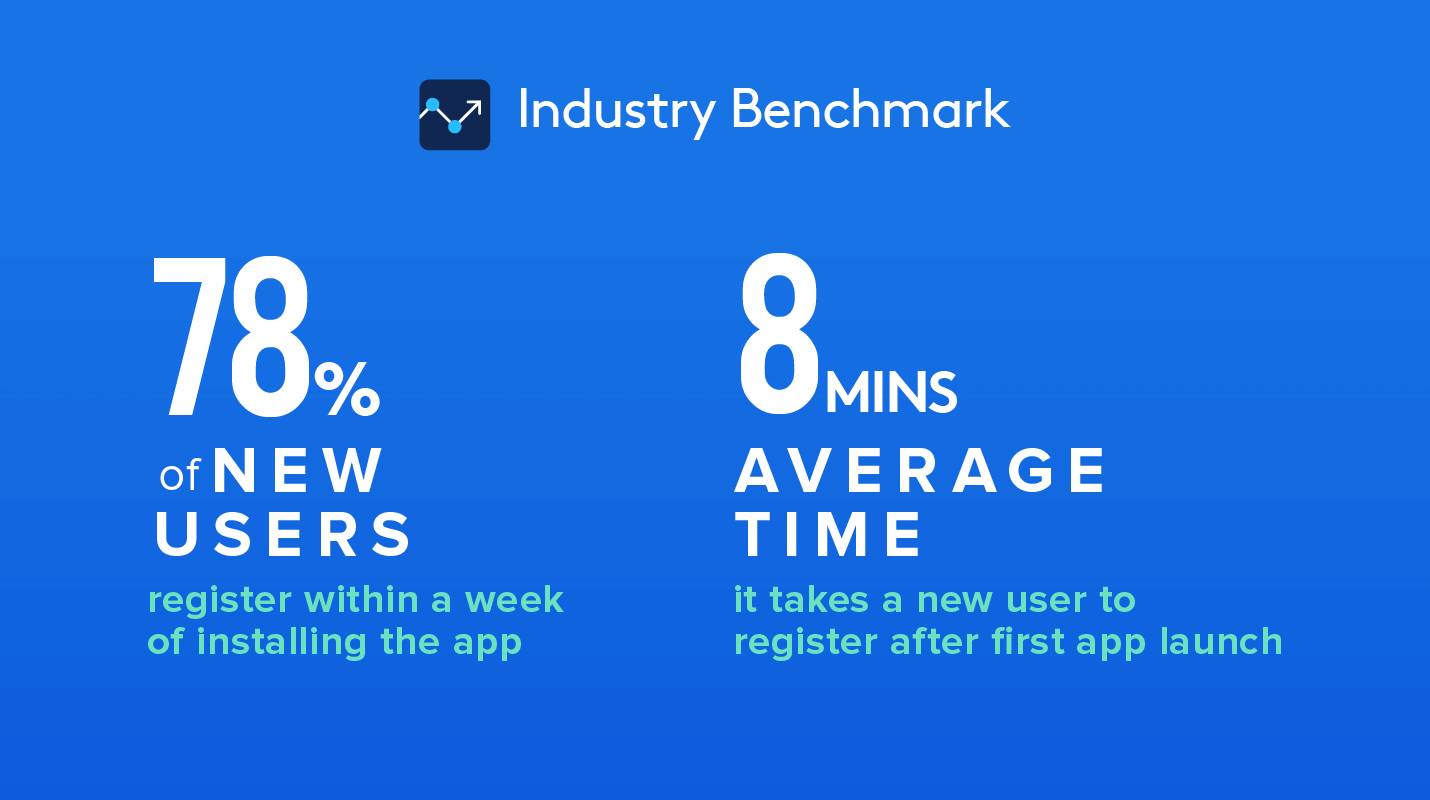
Install to Registration Rate refers to the percentage of users creating an account after installing the app. On an average, 78% of new users register within a week of installing the app.
However, the average time to register is 8 minutes after first app launch, making the FTUX critical to successful user activation. Closely monitor your install to registration rate and the average time to register to optimize your user onboarding process.
From Onboarding to Engagement
Onboarded users who see immediate value in your offering are most likely to stay engaged and build brand loyalty.
During this initial phase, you need to know their interests and preferences so you can create personalized user experiences. Do they prefer comedy or horror? Kate Winslet or Arnold Schwarzenegger? All-day TV binges or weekend movie nights?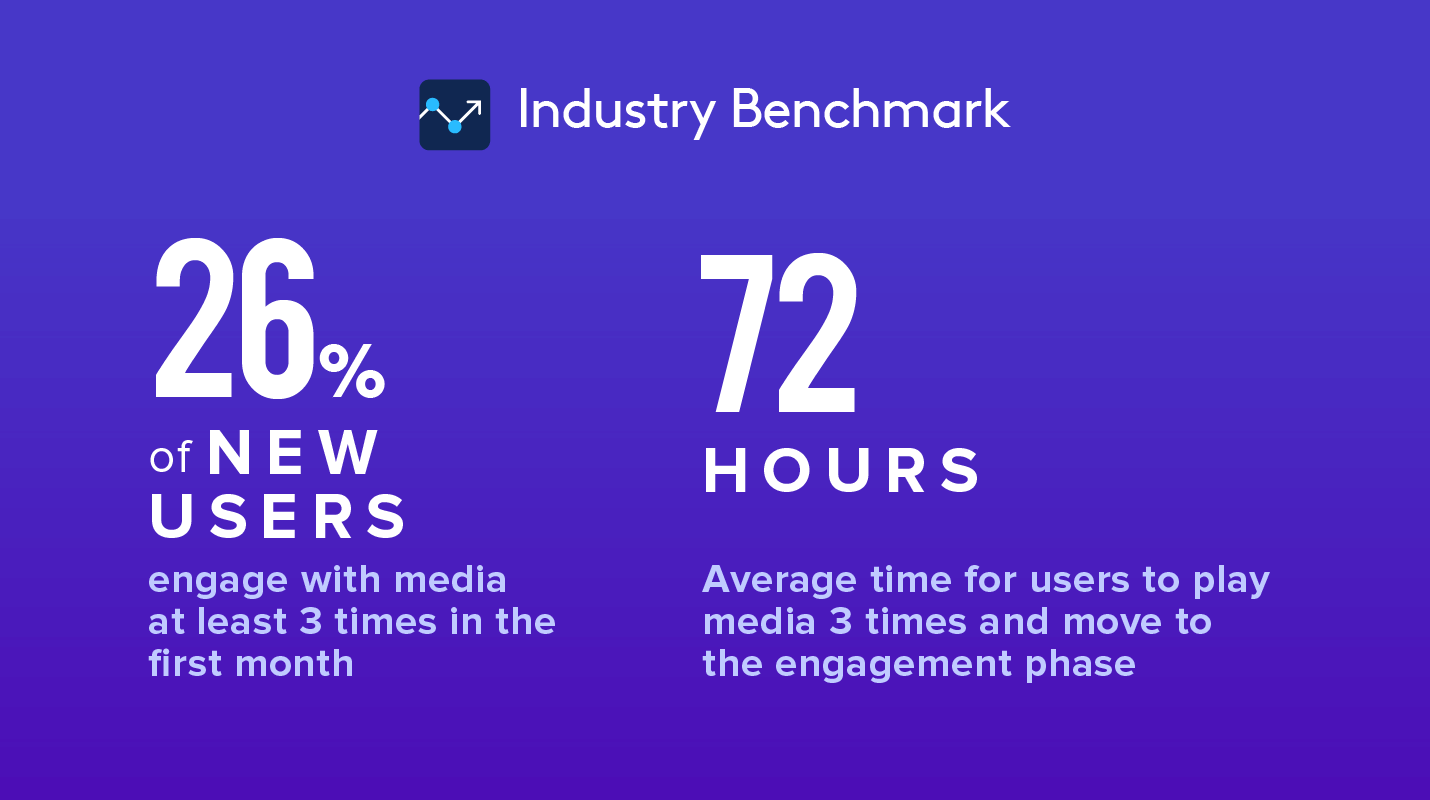
On an average, it takes 72 hours for a user to start engaging with an app. For marketers, this is a critical window of opportunity to keep users hooked and send them relevant content recommendations that will keep them engaged.
Engagement rate is measured by a combination of user actions, like video played, added to watchlist, or playlist created.
Engagement Stage: Keeping Users Hooked
Personalized user engagement campaigns nurture your brand’s relationship with customers and drive higher brand recall. It’s the foundation for better user retention in the long term.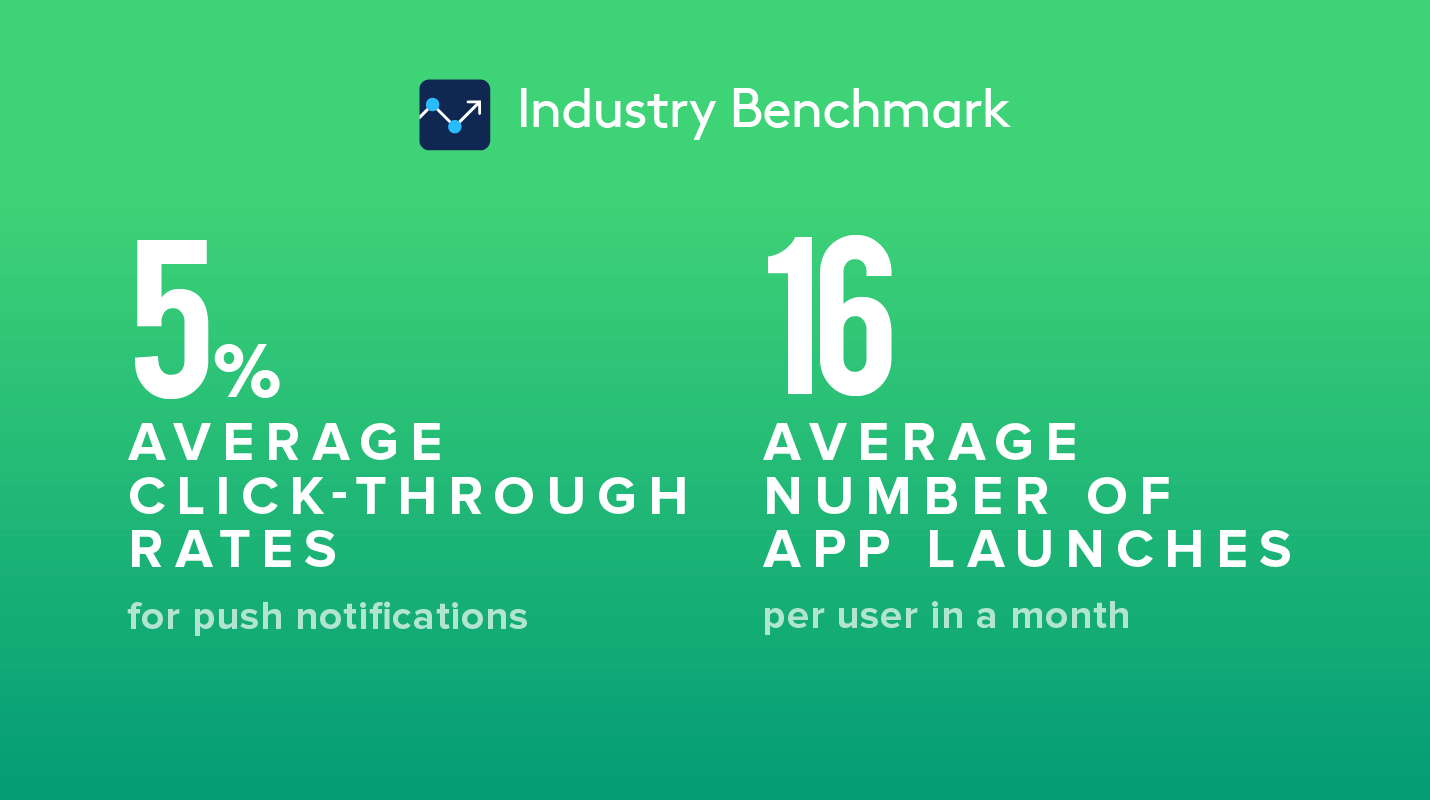
Click-through rates (CTRs) help measure the effectiveness of your marketing campaigns. The average CTR for push notifications is 5%. The average session frequency is 16 sessions in a month.
Once you’ve identified the customers that visit your app frequently you have to ensure that they keep returning to the app. You can keep them hooked by personalizing their experience with recommendations and sending contextual updates of new releases.
Get the Complete Report
Download the full report to get all the essential data and metrics for every user lifecycle stage.

Industry Benchmark for Media & Entertainment Apps
Subharun Mukherjee 
Heads Cross-Functional Marketing.Expert in SaaS Product Marketing, CX & GTM strategies.
Free Customer Engagement Guides
Join our newsletter for actionable tips and proven strategies to grow your business and engage your customers.
