


Table of Contents
Categories
Most Popular


Research in consumer psychology shows that convenience has a major impact on buying decisions.
That’s why Amazon patented one-click buying in 1999. By doing this, Amazon ensured that no other online business could offer the convenience of one-click purchasing to customers, giving them a sustainable competitive advantage for many years.
A more recent example is consumers going cashless – moving from cash to cards, mobile payment apps, or wallet apps.
The majority of transactions in developed countries are cashless; for instance 70.7% of payments made in Canada1 are made through non-cash methods. Being cashless is a growing phenomenon in developing nations as well where consumers are choosing mobile payment apps over cash because of poor banking infrastructure.
The global mobile payment technology market valued at $123 B in 2017 is expected to grow at a CAGR2 of 60% between 2018 and 2024. The industry is seeing intense competition with a host of payment service providers including big names like Amazon Pay, Google Pay, and Apple Pay. With competition heating up, the focus is increasingly on providing a seamless payment experience to customers.
Challenges in Delivering Great Customer Experiences
When it comes to delivering a great customer experience, there are challenges that the growth and marketing teams at mobile payment apps face. They constantly grapple with:
- How to increase user base and sustain growth in the long term
- How to measure the key metrics for different stages of the customer lifecycle
- The best ways to engage customers from acquisition to brand advocacy
- How to increase repeat transactions and therefore the ARPU
We analyzed billions of anonymous data points across 700+ million devices and over 583 million unique users to find the answers. We put together all the insights in a single report to help you measure your own user engagement strategies against some of the most successful apps in the mobile payments industry.
User Onboarding Insights
With intense competition in the space, mobile payment apps need to offer a differentiated and superior customer experience to users as soon as the user installs the app.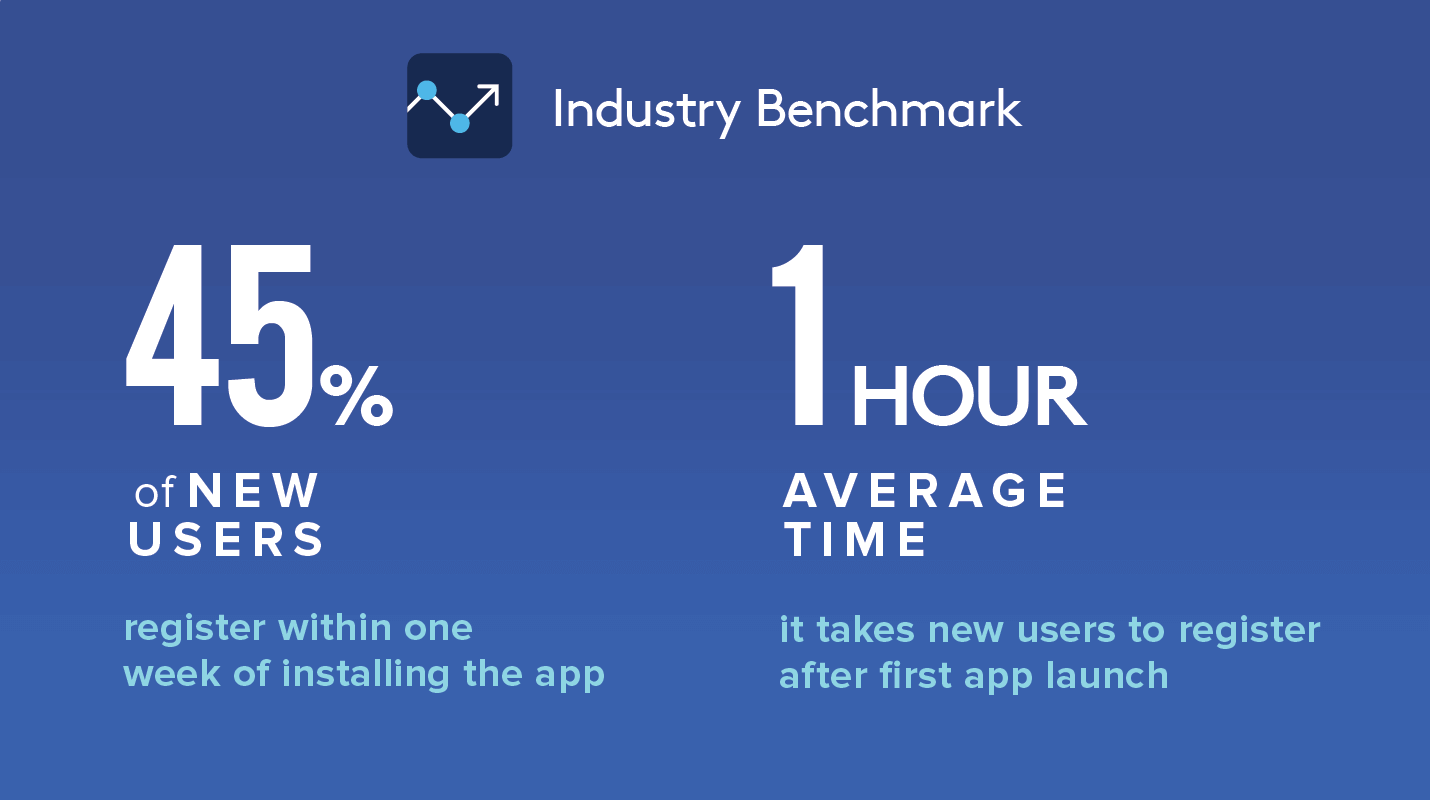
The average install to registration rate for mobile payment apps is 45% within a week of users installing the app. Moreover, the average time to register is 60 minutes after first app launch.
At the onboarding stage, the goal is to get users to quickly perform critical actions like registering their account, adding money, or using the app for payments.
Onboarding Users to Engaging Them
Leading mobile payment platforms engage users with relevant cashback offers, and nudge users to select their preferred service providers for utility bill payments during onboarding. This helps to deliver a more personalized experience with compelling offers on services and features they are most likely to use.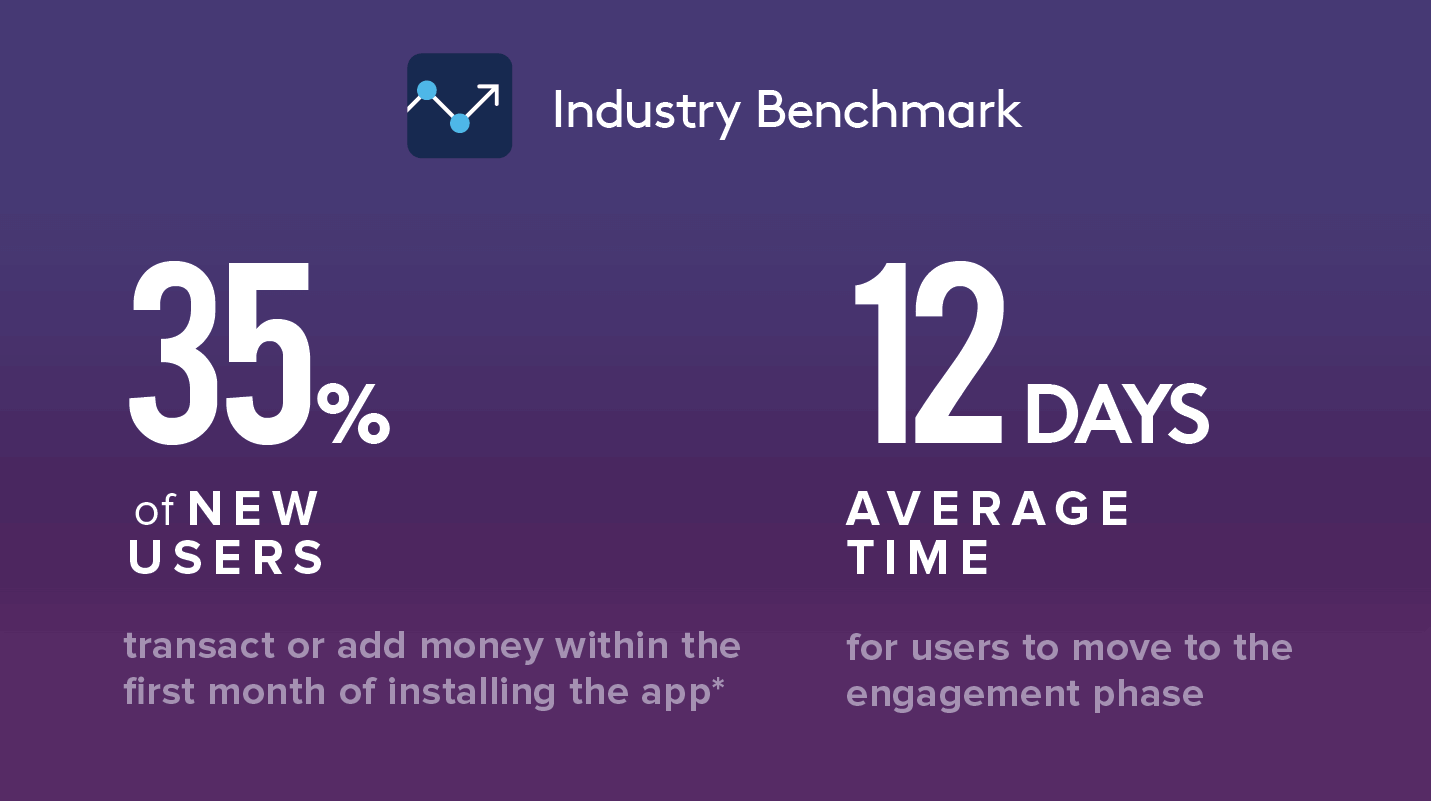
This indicates that only a third of the users continue to see value in your app, presenting a tremendous opportunity for improvement. Apps that fail to recognize this in the first 3-4 weeks of a user registering with the app often find it challenging to bring them back altogether.
Boosting User Engagement
Personalized user engagement campaigns nurture your brand’s relationship with customers and drive repeat transactions.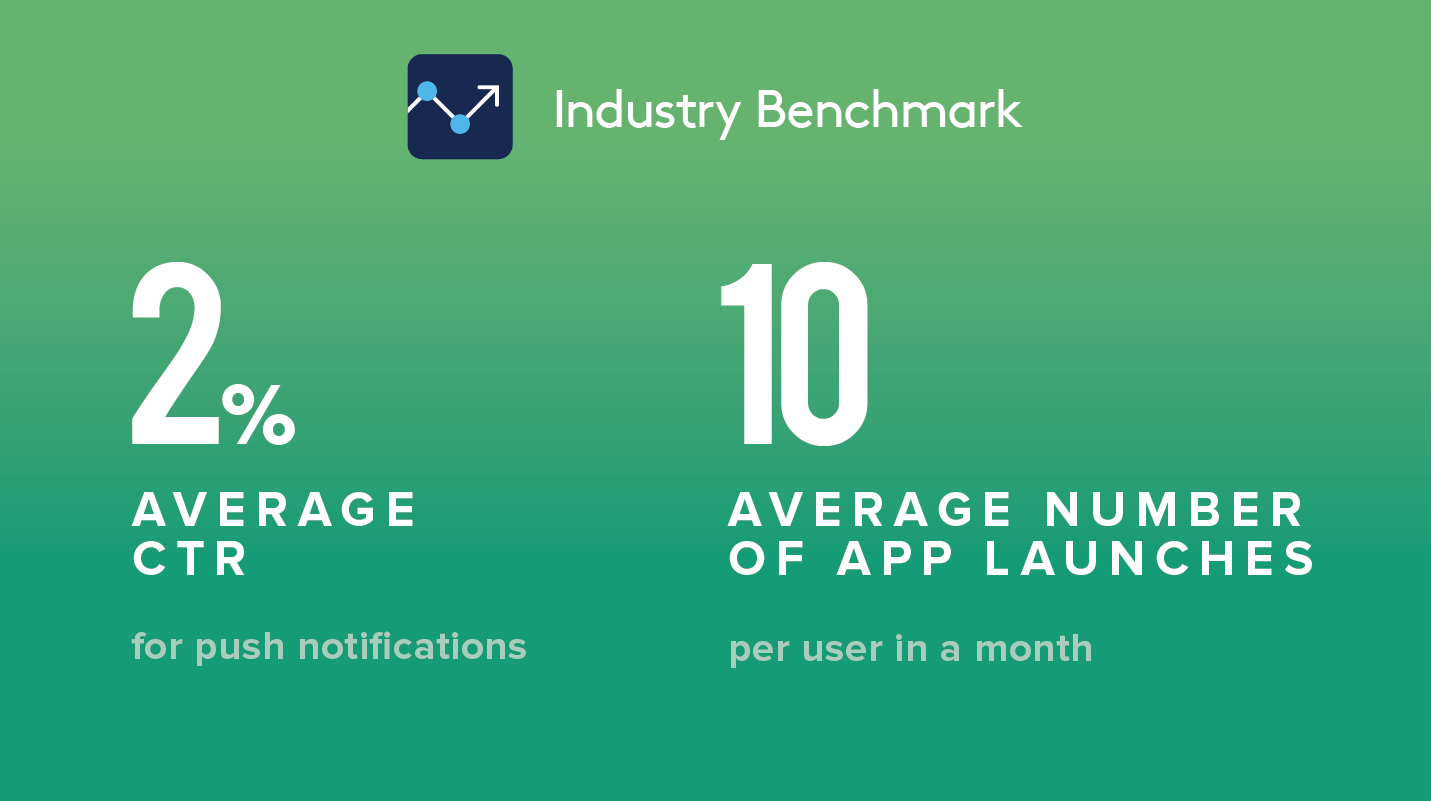
During the engagement phase, you need to track key metrics like click-through rates of your engagement campaigns, frequency of app launch, average session duration, and transaction abandonment rates, among others.
Get the Full Report
Download the full report to get all the essential data, recommendations, and metrics for every user lifecycle stage.
Industry Benchmarks for Mobile Payment Apps
Subharun Mukherjee 
Heads Cross-Functional Marketing.Expert in SaaS Product Marketing, CX & GTM strategies.
Free Customer Engagement Guides
Join our newsletter for actionable tips and proven strategies to grow your business and engage your customers.
