


Table of Contents
Categories
Most Popular


Churn quietly undermines B2C growth by eroding revenue and customer lifetime value. Customers disengage through skipped logins, stalled purchases, or dropped subscriptions, creating hidden costs that compound over time. Senior growth marketers and retention leaders recognize churn not as a simple metric but as one of the biggest barriers to efficient scaling.
Churn prediction changes how teams approach this problem. Instead of analyzing losses after customers leave, predictive models analyze behavioral signals to identify users who are likely to churn in the near future. These models detect patterns such as declining engagement, longer purchase gaps, or reduced product usage and assign probability scores that highlight customers who may need intervention.
This forward-looking approach allows marketing teams to act before churn happens. Instead of reacting to cancellations, teams can launch re-engagement campaigns, targeted offers, or personalized nudges when early warning signals appear.
This guide explains how churn prediction works, what data fuels these models, and how marketers can use churn risk signals to power smarter retention strategies. By the end, you’ll see how modern marketing platforms make churn prediction accessible without requiring a dedicated data science team.
What is Churn Prediction?
Churn prediction uses data analysis and machine learning to spot customers showing early signs of leaving your product, service, or subscription. It uncovers patterns in their behavior, like fading engagement or negative service interactions, and assigns probability scores to flag those who need attention most. Retention teams turn these insights into targeted interventions, catching attrition before it hits.
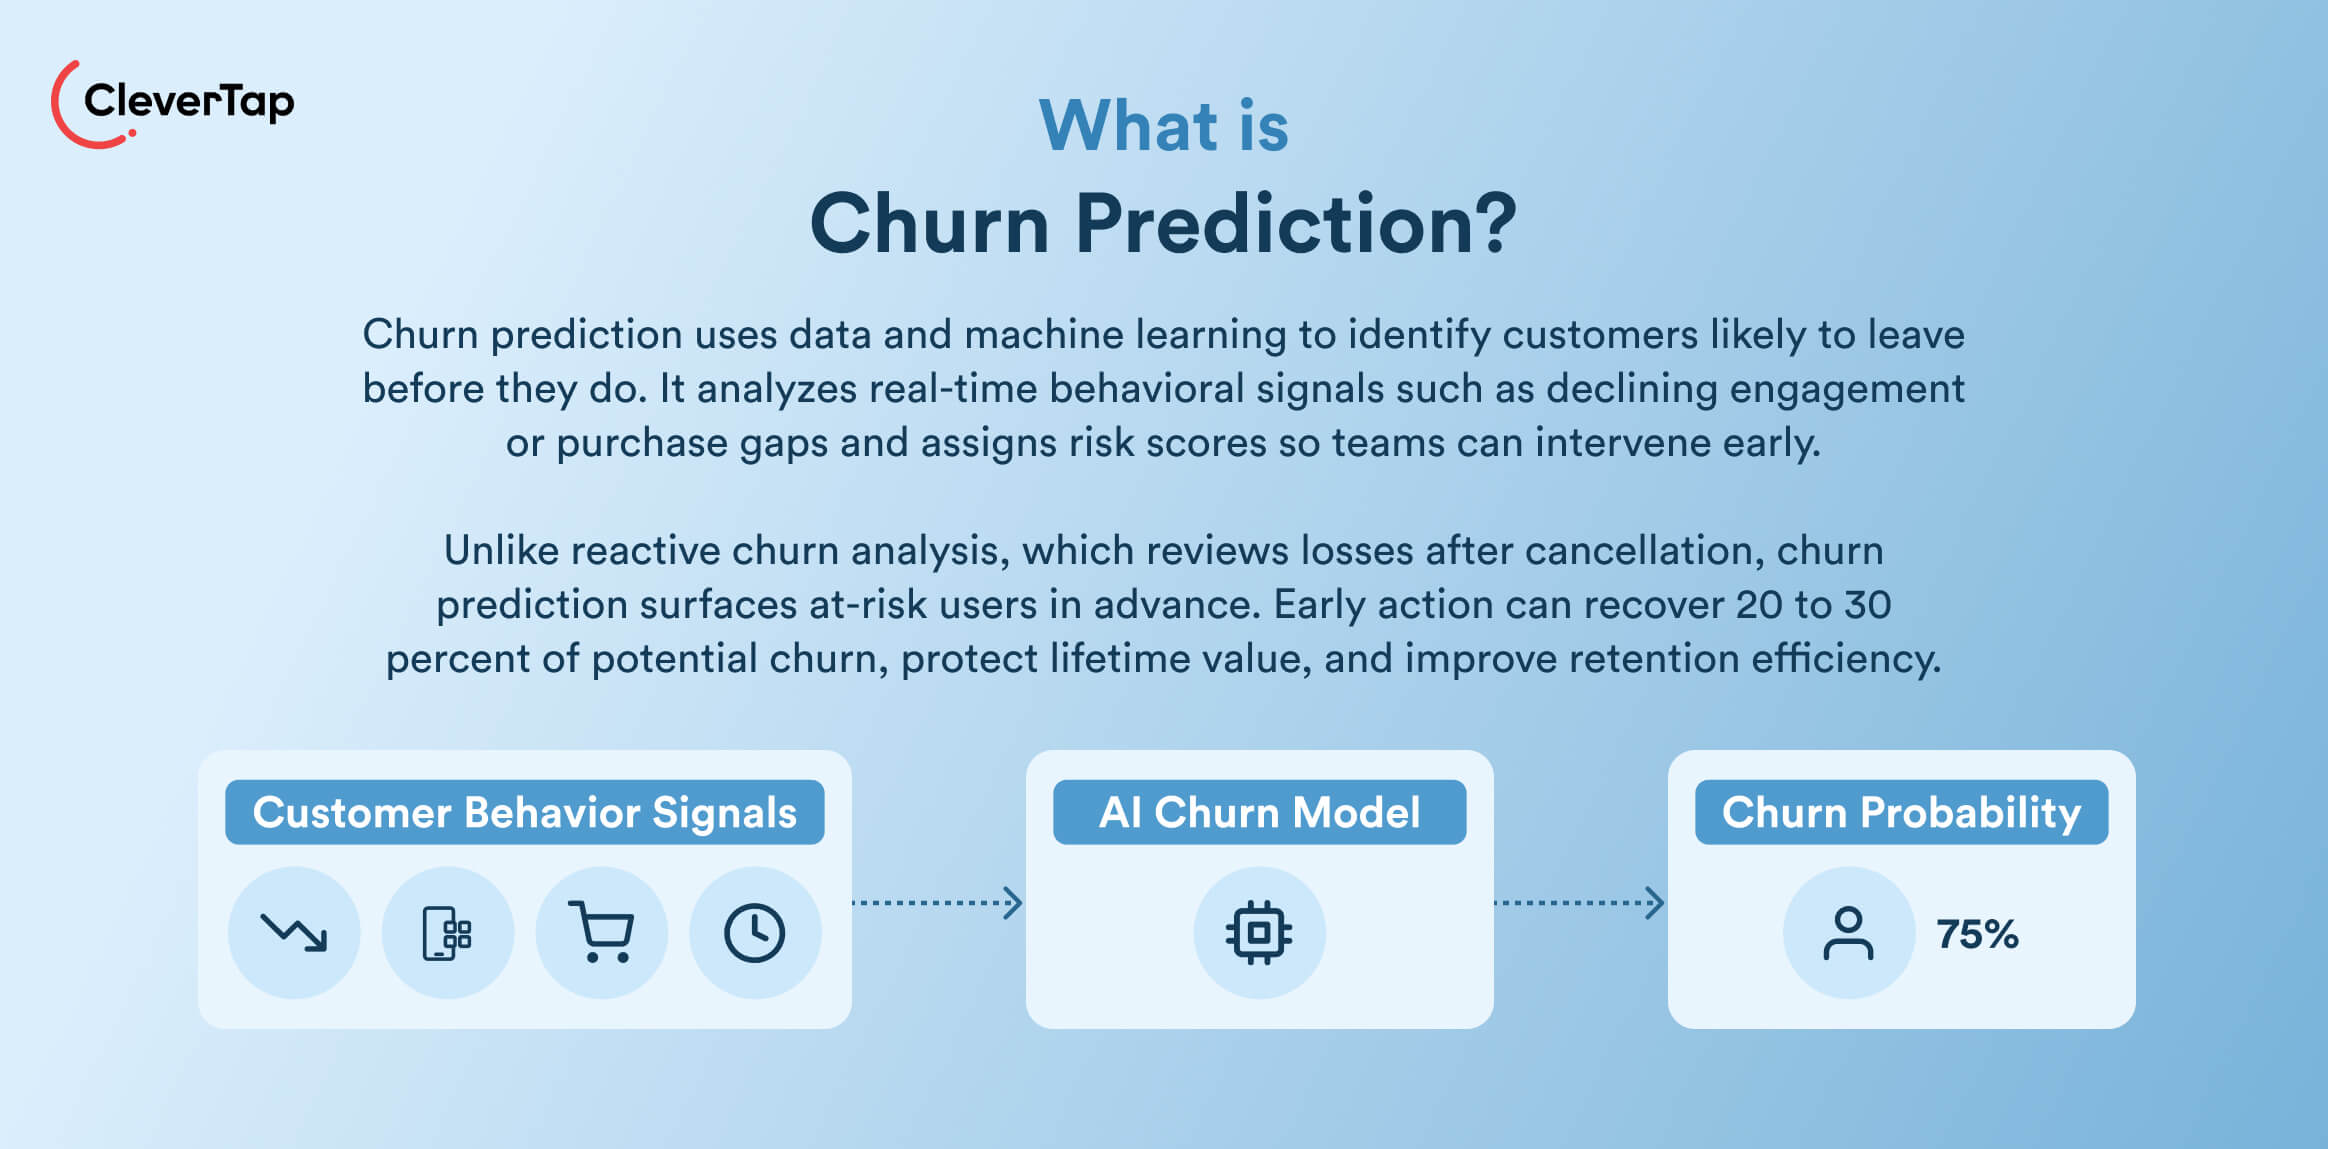
This approach differs sharply from reactive churn analysis, which digs into historical metrics like cancellation rates only after customers exit. Cohort reviews or exit surveys explain past losses but deliver answers too late for action. Churn prediction models instead monitor live signals, like session drops, purchase gaps, and support spikes, to surface at-risk users weeks ahead.
The value compounds because prediction directly lifts customer lifetime value and growth efficiency. Subscription businesses lose 5-7% of customers monthly on average, but early detection enables 20-30% recovery through timely personalization. Marketers build precise re-engagement segments rather than firing blanket campaigns, sustaining acquisition ROI since retaining customers costs far less than replacing them.
What is Churn Prediction Analysis?
Churn prediction analysis focuses on interpreting churn prediction outputs and translating them into actionable retention decisions. While churn prediction models generate probability scores that identify who may churn, churn prediction analysis explains why those users are at risk and how teams should respond. It combines customer data with behavioral patterns and probability calculations to reveal why and when customers might leave, creating a foundation for targeted marketing strategies.
At its core, churn prediction analysis integrates historical behavior, like login frequency drops, purchase gaps, or feature underuse, with current signals to establish baselines. These patterns are the training ground for models, where past churners help teach the system to spot similar trajectories early. Marketers benefit from this because it contextualizes scores; for example, a 75% churn probability tied to 30-day dormancy becomes a clear signal for re-engagement.
Analysis supports decision-making by layering probability with business context, not just forecasting risk. Teams use it to rank users into risk bands (low/medium/high), allocate budgets to high-value at-risk segments, and test interventions like personalized offers. In e-commerce, for instance, analysis might flag subscription users with declining cart activity for win-back flows, recovering revenue before cancellations hit.
Related: Top 12 Leading Causes of Customer Churn and Ways to Prevent It
Why Churn Prediction Matters for B2C Businesses
Churn hits B2C businesses hardest by directly eroding revenue, growth efficiency, and customer lifetime value. A 5% increase in retention can boost profits by 95%, because high churn forces constant acquisition spending just to stand still. Subscription platforms lose millions when users with strong early engagement silently drop off, turning potential LTV into write-offs.
Impact on Revenue and Growth
Acquisition-led growth fails without churn prediction because it ignores retention leakage. Marketers pour budgets into new users, while monthly churn in subscriptions wipes out gains, and replacing lost customers costs a lot more than keeping them. Without prediction, teams chase symptoms like low NPS scores instead of root signals, trapping businesses in a cycle where customer acquisition cost (CAC) outpaces lifetime value (LTV).
Enabling Sustainable Growth
Churn prediction breaks this cycle by prioritizing retention as a growth engine. It identifies at-risk segments early, letting teams deploy targeted interventions that recover would-be churners through personalization. For example, e-commerce brands use it to re-engage dormant carts, and fintech firms flag inactive accounts for security nudges. This shifts focus from endless acquisition to efficient scaling, where retained customers fund organic expansion.
Growth leaders integrate churn prediction into lifecycle marketing, turning forecasts into campaigns that sustain LTV and free up budget. Platforms like CleverTap make this seamless, embedding predictions into daily workflows.
Types of Customer Churn Businesses Should Track
Churn prediction systems target distinct attrition patterns across the customer lifecycle, each driven by recognizable behavioral shifts. Subscription renewal churn focuses on users approaching expiration who skip engagement signals like content previews or payment setup. Voluntary churn identifies explicit cancellations tied to frustration indicators such as repeated support contacts or feature complaints. Passive churn detects gradual disengagement where activity simply fades without a formal exit. Revenue churn tracks high-value customers quietly reducing spending while remaining technically active.
How the System Works
Churn prediction systems operate as continuous monitoring loops that analyze customer behavior and surface churn risks before they materialize.
- Customer data collection over time: Systems capture daily interactions, creating rich longitudinal profiles. These reveal engagement baselines and emerging trends across user journeys.
- Behavioral pattern identification: Algorithms scan for deviations from normal activity, comparing individual users against similar cohorts. A sudden drop in key actions flags potential trouble early.
- Probability generation: Outputs deliver risk scores (0-100%) rather than binary alerts, showing churn likelihood over specific windows like 30 or 90 days. Higher scores prioritize immediate action.
- Role of prediction models: At the analysis core, models process this data to generate probabilities, then feed results into marketing segments. Campaign outcomes loop back to improve accuracy, creating a self-refining retention engine.
The Churn Prediction Workflow Explained
While churn prediction systems monitor user behavior continuously, the churn prediction workflow explains how businesses turn these signals into actionable retention programs. It describes the operational process that connects historical data, model predictions, and marketing interventions into a repeatable retention cycle.
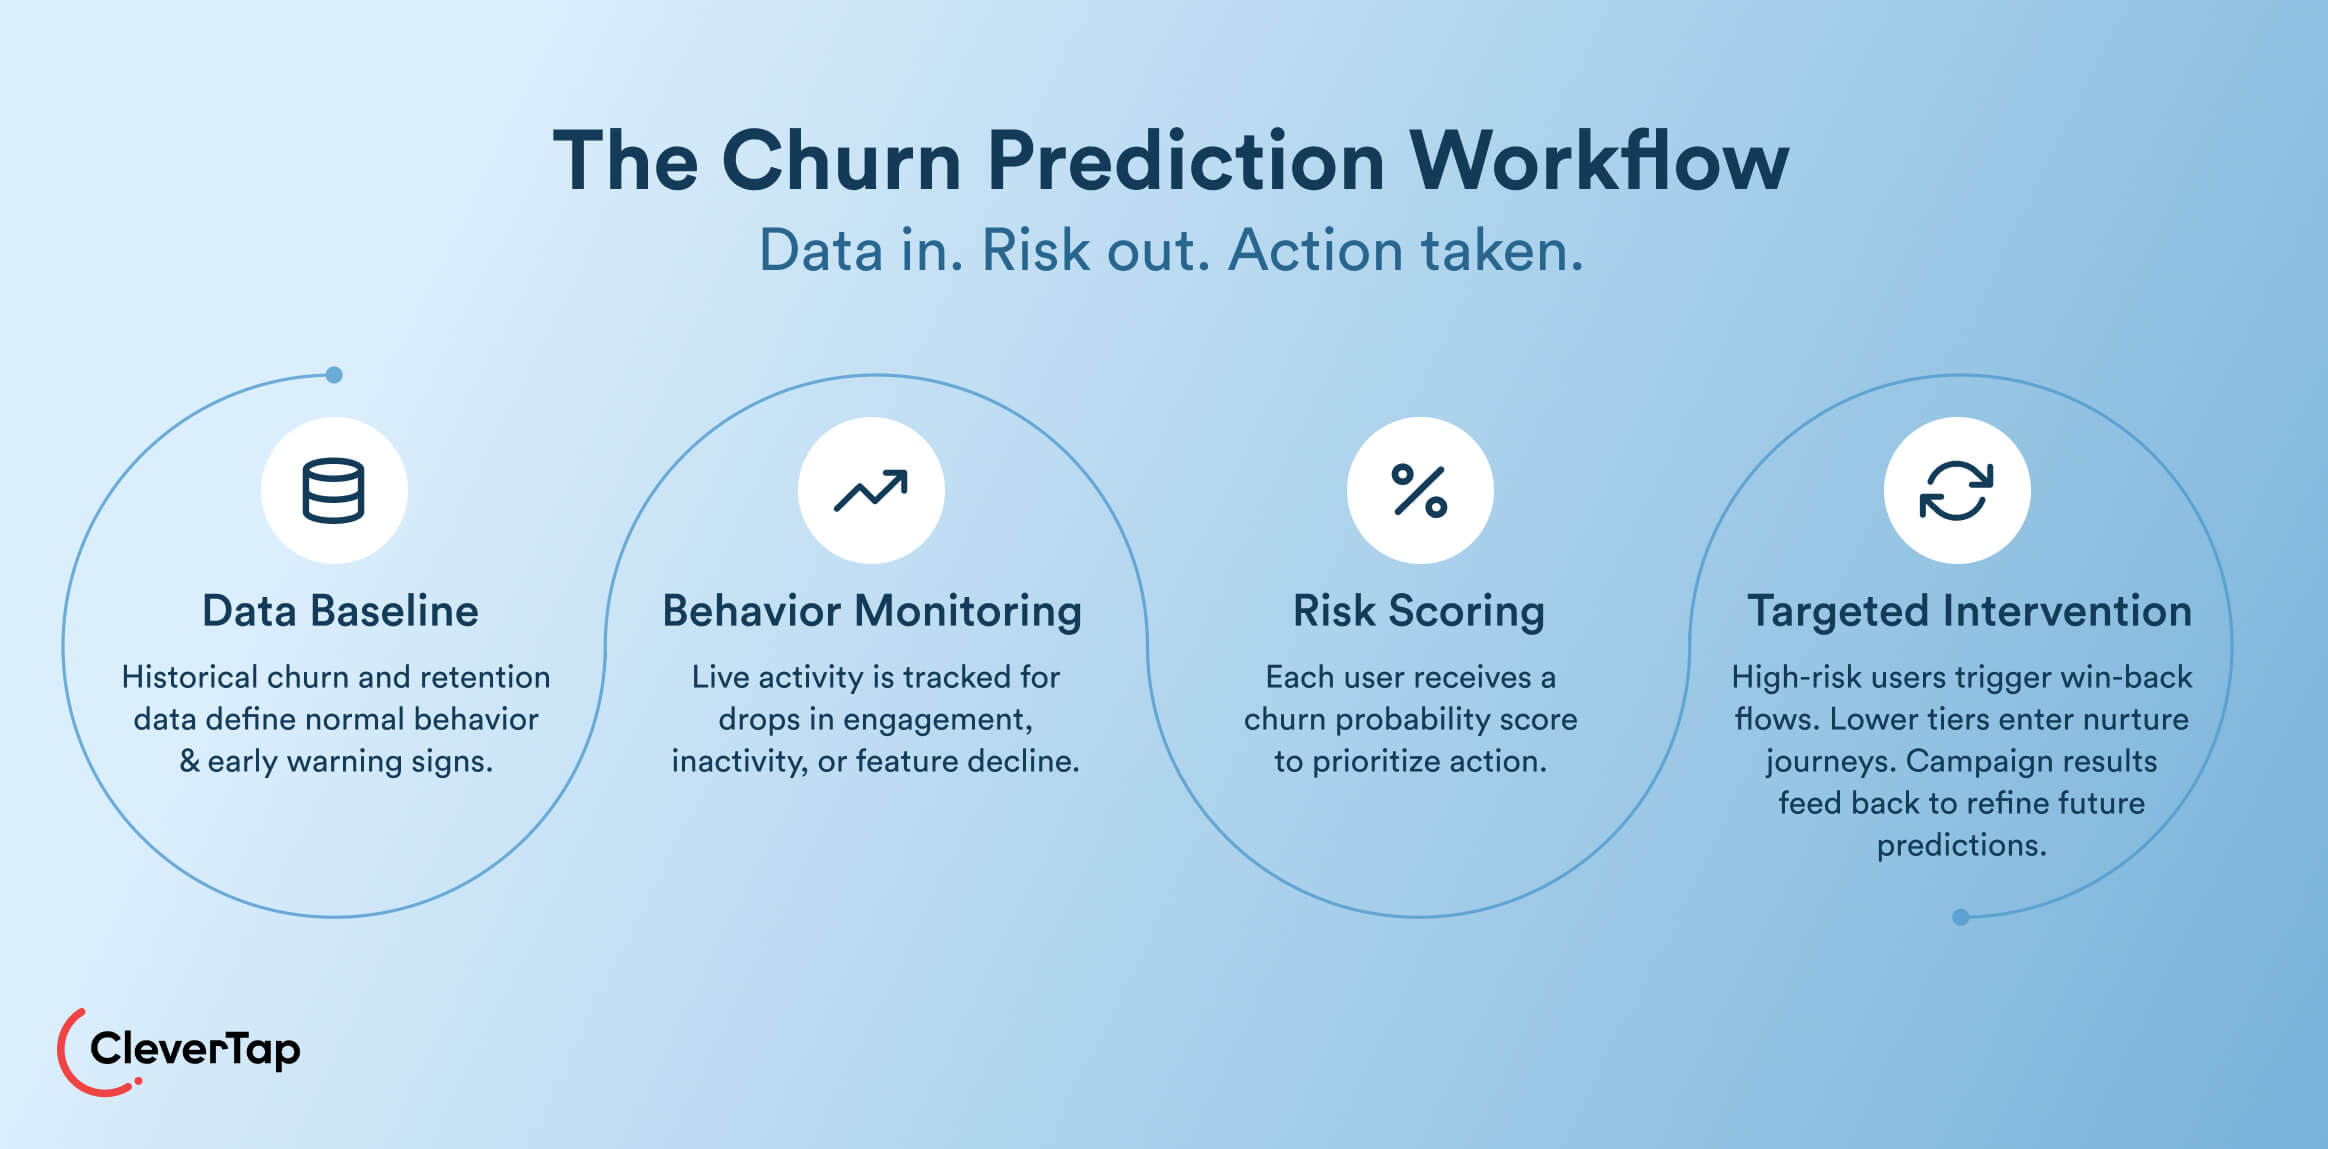
Historical Data as Foundation
Historical data anchors the entire process, capturing what happened before to predict what happens next. Platforms pull records of past churners alongside retained users for comparison. E-commerce teams might analyze 12 months of cart views and checkouts. This baseline reveals what “normal” engagement looks like before decay sets in.
Pattern Recognition Over Time
The system scans for deviations in real time, spotting trends like 50% login drops or feature underuse that mirror past churners. In a fintech or mobile banking app, a user who normally logs in several times a week but suddenly stops opening the app for two weeks may trigger a risk review against cohort engagement patterns. Recognition happens continuously, updating risk as behaviors evolve.
Probability-Based Outcomes
Outputs deliver nuanced scores (20% risk, 65% risk) rather than binary alerts, letting teams prioritize high-stakes users. A 75% score on a high-LTV e-commerce customer prompts urgent win-back flows, and lower scores enter nurture tracks. This feeds customer segmentation for campaigns, personalized offers for medium risk, and educational content for low.
Data Used in Churn Prediction Models
Churn prediction models rely on granular customer data that reflects real behaviors and intent across the customer journey. These inputs create accurate risk profiles without requiring complex setups, enabling marketers to act on familiar signals from their platforms.
Behavioral and Engagement Data
This category captures how customers interact with products daily.
- Session frequency: Tracks logins and time spent, where sudden 40% drops signal disengagement.
- Feature adoption: Monitors which tools users access, for example, SaaS users ignoring new updates or gaming players skipping events.
- Support interactions: Counts tickets or chat usage, as frustration spikes often precede churn. E-commerce brands analyze click paths to spot browsing fatigue.
Transactional and Usage Data
Financial and consumption patterns show value decay.
- Purchase frequency: Gaps between orders, like fintech users halting transfers.
- Average order value: Declines in spend are critical for subscription AOV drops.
- Payment failures: Repeated card declines pre-cancellation.
- Content consumption: Tracks engagement with in-app content such as video views, articles, or learning modules, where declining consumption may signal fading interest.
Lifecycle and Recency Signals
Stage-specific markers predict exits by cohort.
- Days since last activity: Recency thresholds like 30-day dormancy.
- Onboarding completion: Users stuck post-signup vs. fully activated.
- Renewal windows: Pre-expiration signals for subscriptions.
- Milestone gaps: Spots missed progression points. These prioritize actions by urgency across the journey.
What are Churn Prediction Models?
Churn prediction models form the analytical core of retention systems, processing customer data to forecast attrition risk with precision. These models examine behavioral, transactional, and lifecycle signals to assign probability scores to individual users, identifying who will likely churn within defined timeframes, like 30 or 90 days. Marketers use these outputs to trigger campaigns, segment audiences, and allocate resources efficiently, turning forecasts into measurable retention wins.
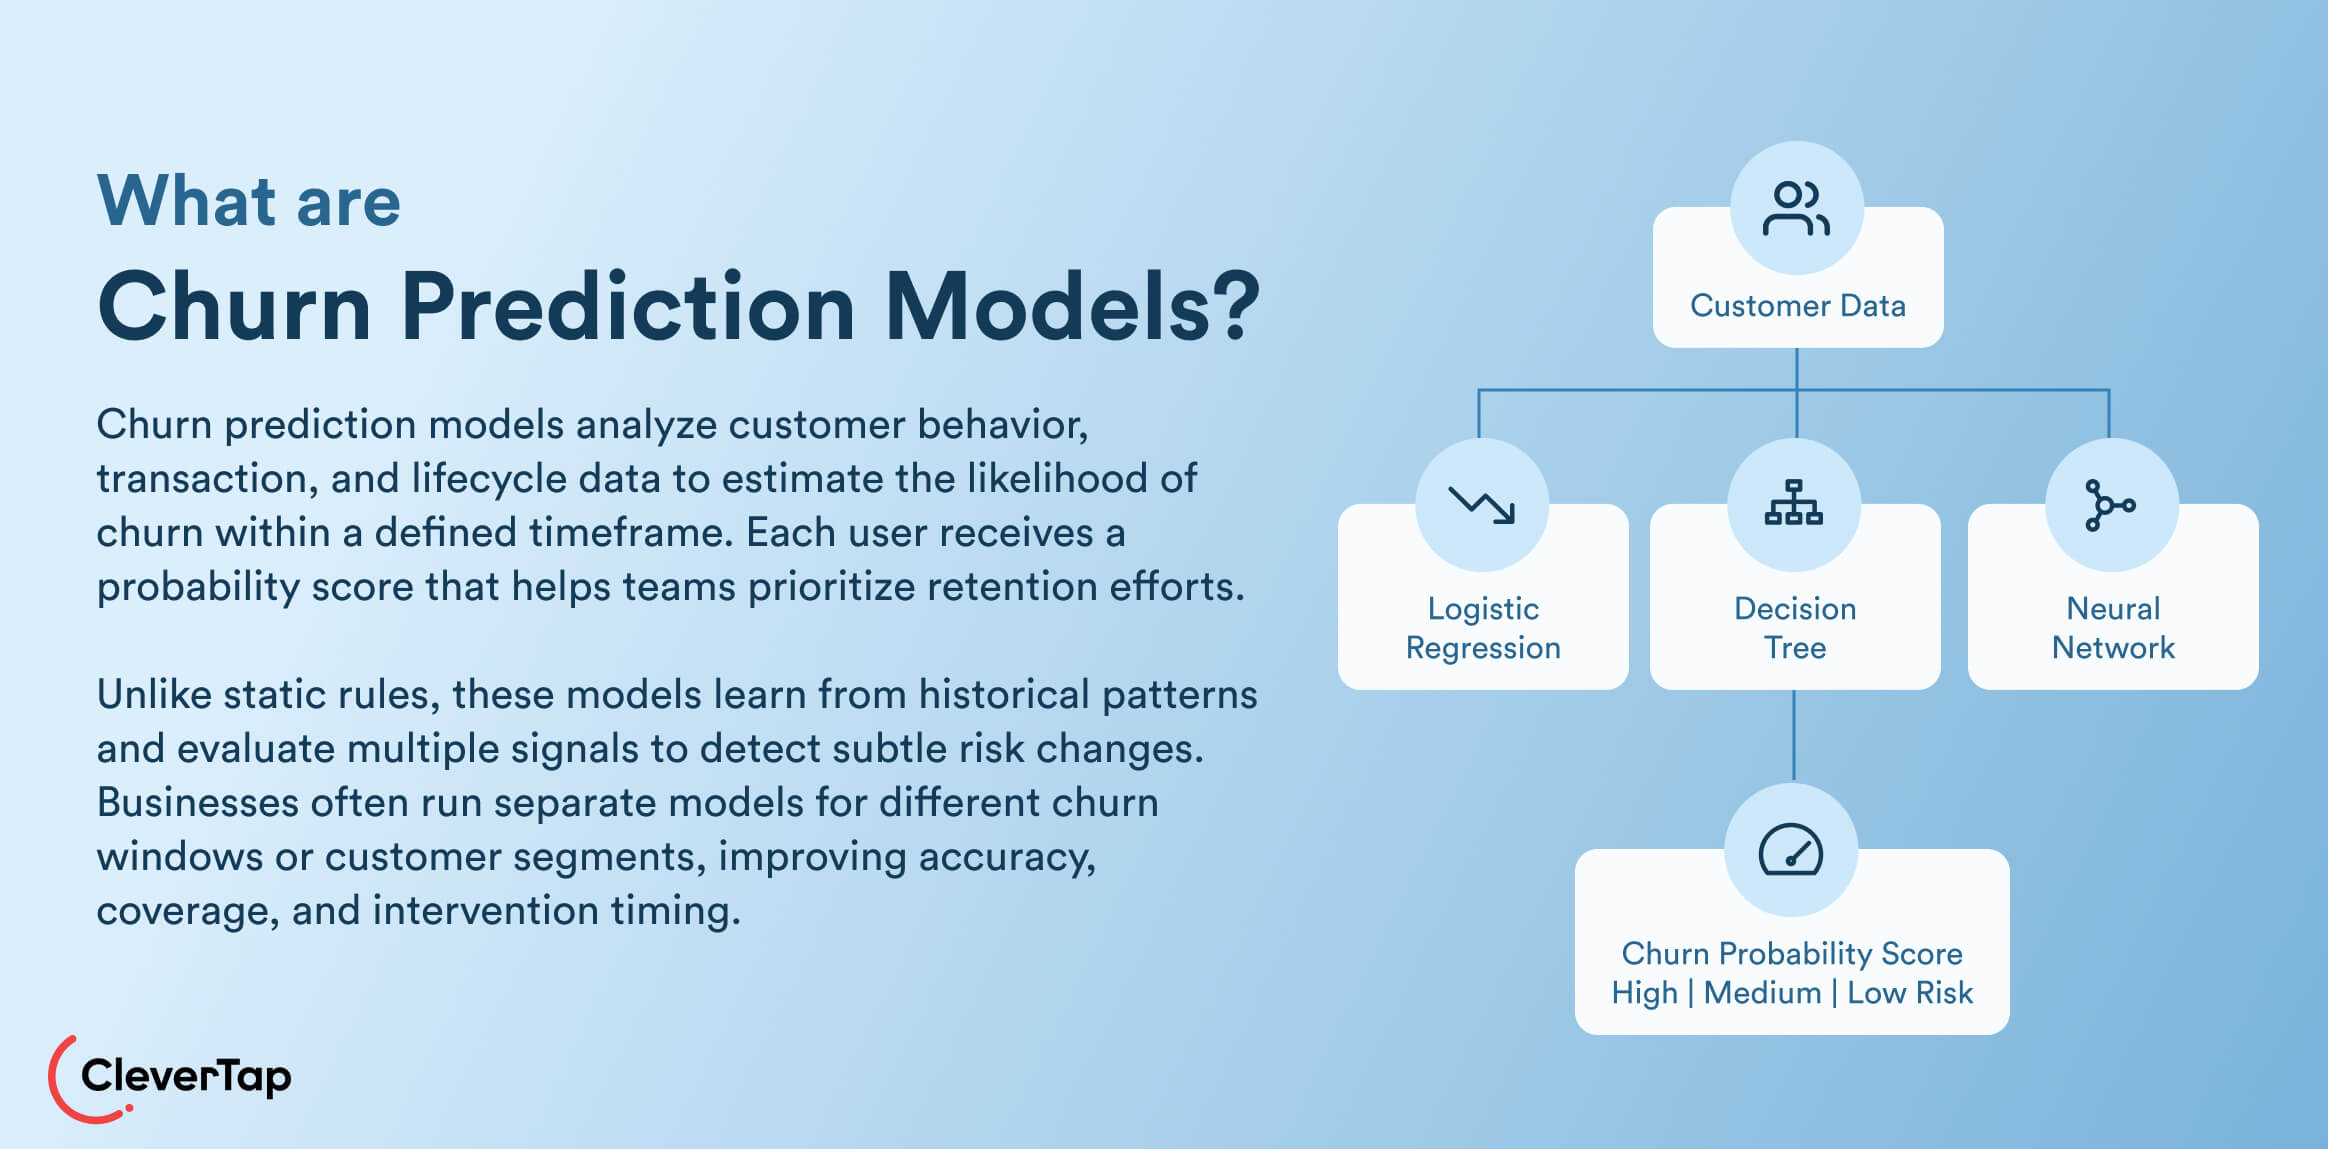
Unlike rules-based logic, predictive models learn from historical patterns dynamically. Rules work for simple scenarios but miss nuanced signals, such as a high-value user with normal activity who suddenly skips key features. Predictive approaches weigh hundreds of variables, adapting to shifting behaviors and delivering accuracy that static rules can’t match. Retention teams favor them for scalability across large user bases.
Businesses often run multiple models to cover different churn horizons and segments. One might predict short-term voluntary cancellations, while another flags long-term passive drop-off. Separate models for high-LTV vs. low-value users ensure tailored interventions. This layered approach maximizes coverage, as a single model risks overlooking context-specific risks. By streamlining deployment, platforms enable growth teams to test and improve models without the need for coding knowledge.
Common Types of Churn Prediction Models
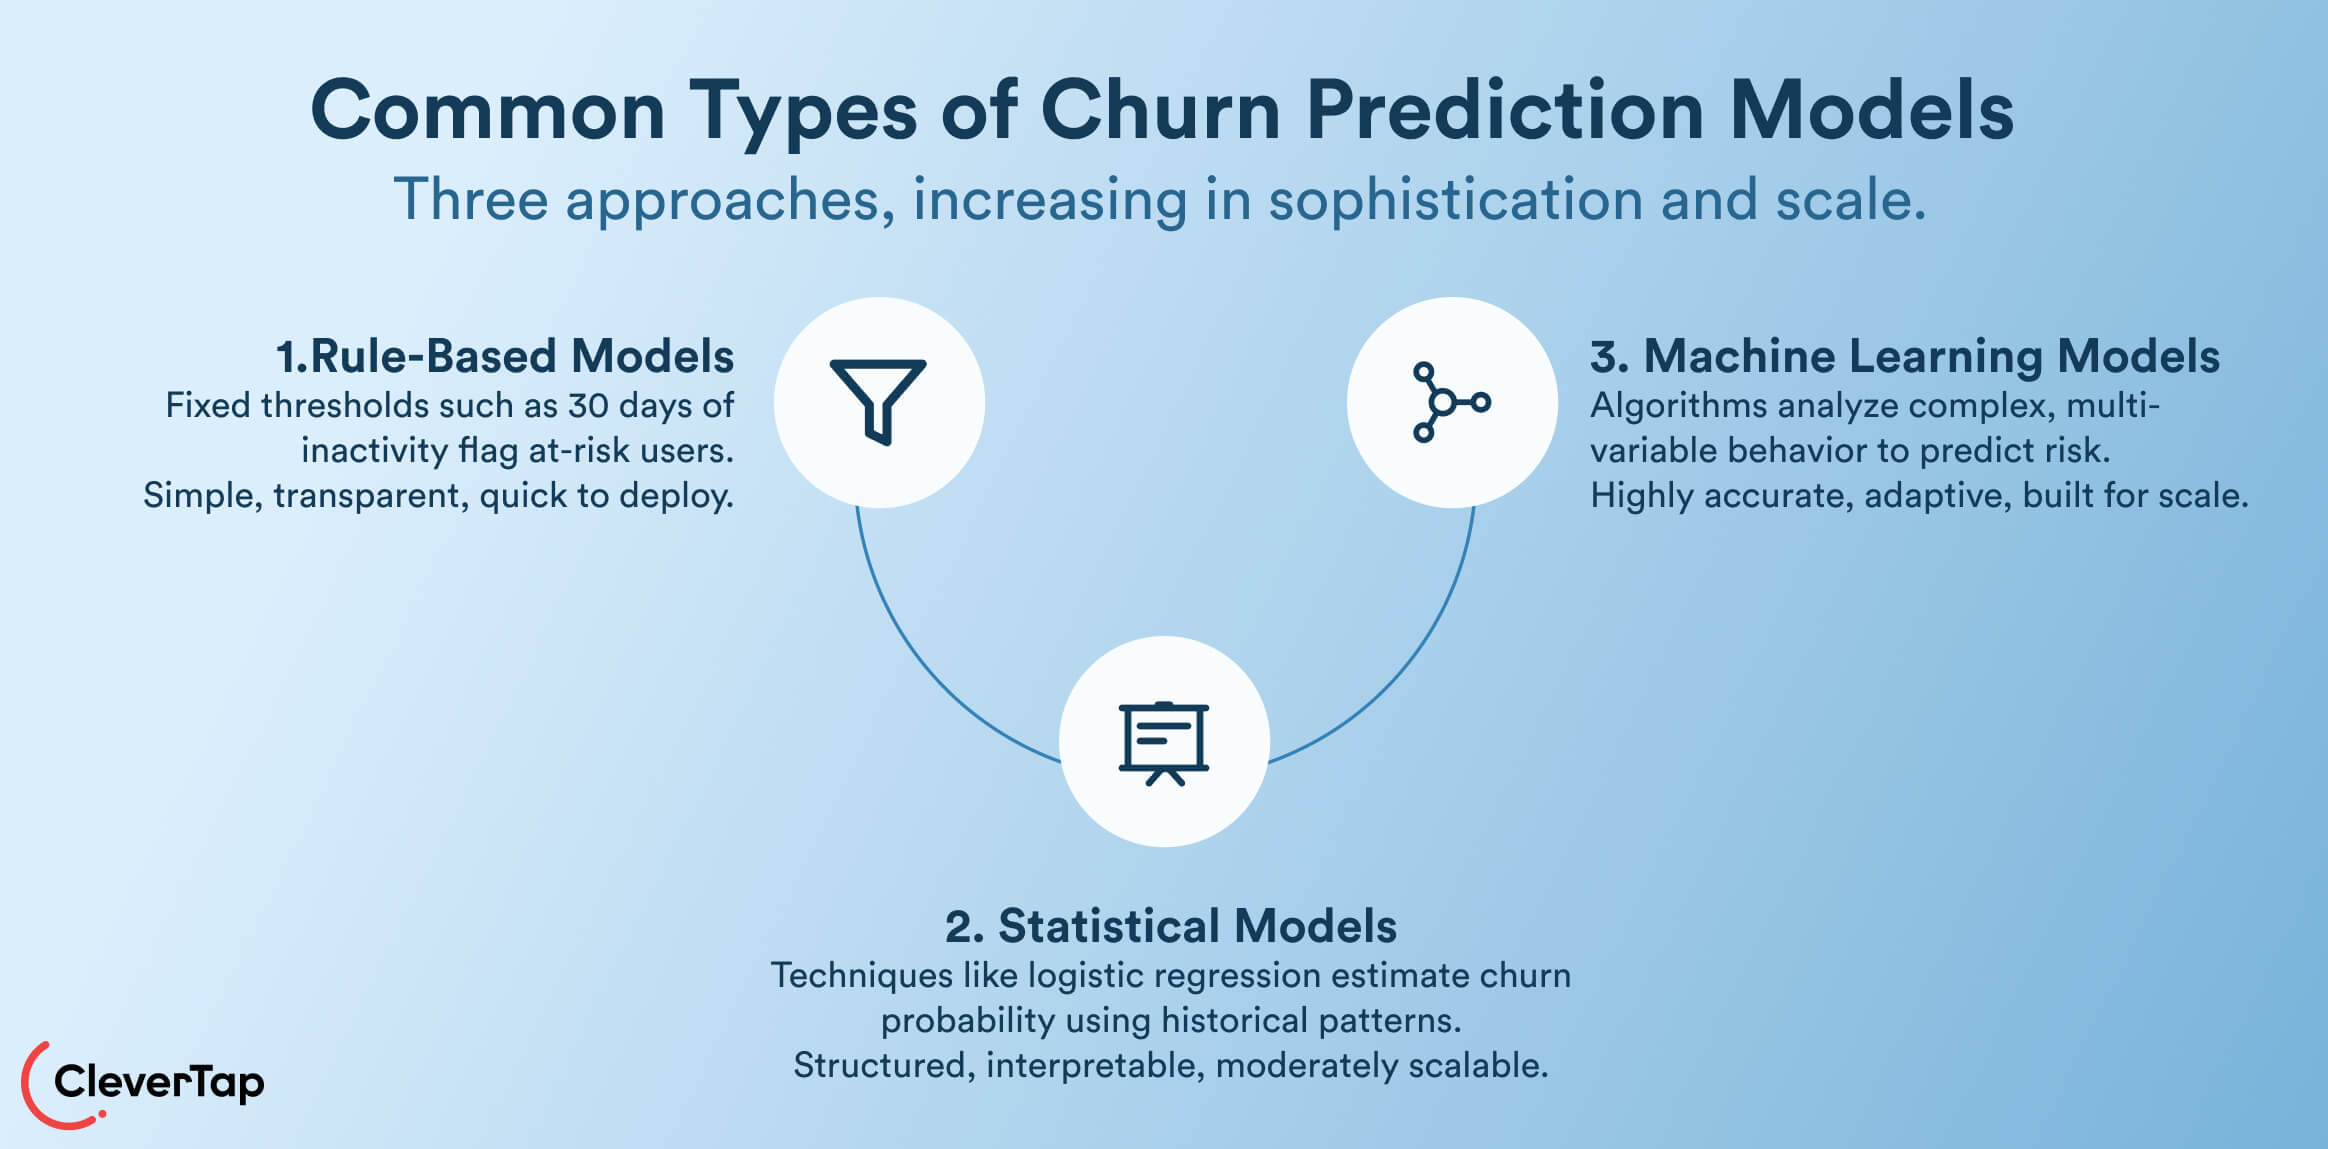
Churn prediction models fall into three main categories, each suited to different data maturity levels and team capabilities. Rule-based models offer simplicity for quick starts. Statistical models add sophistication through proven formulas. Machine learning models deliver precision at scale. Retention marketers choose based on their data volume, technical resources, and prediction needs, often starting simple and layering complexity over time.
Rule-Based Churn Models
These models apply predefined business logic to identify at-risk customers without advanced analytics. Teams define thresholds like “no activity for 30 days” or “zero transactions in 60 days” to generate alerts. Implementation uses standard platform filters, making them ideal for quick deployment or smaller datasets.
They offer full transparency and launch immediately. A subscription team might target users skipping renewal previews. While effective for basic scenarios, rules struggle with subtle patterns where activity appears normal, but the intent to leave grows. They build team confidence before advancing to predictive methods.
Statistical Churn Prediction Models
Statistical models leverage established relationships in customer data for reliable forecasts. Logistic regression, the standard choice, weighs factors like recency and engagement to calculate churn probability. Historical data trains the model, which then reveals the strongest predictive signals.
These work well for datasets with clear patterns but limited volume. Marketers easily interpret results, a strong link between login frequency and retention guides campaign priorities. They suit mid-sized operations where consistency matters more than constant adaptation to new trends. Static nature limits flexibility during market shifts.
Machine Learning–Based Churn Prediction Models
Machine learning models uncover complex patterns across many variables, excelling with large datasets. Random forests and gradient boosting (like XGBoost) evaluate feature interactions automatically, learning from past churners to flag future risks. Neural networks capture non-linear relationships, such as high activity paired with low feature use, signaling trouble.
They adapt to changes like seasonality or product updates through continuous retraining, powering precise risk scores for personalization. Retention teams gain automated insights without manual setup, enabling hyper-targeted campaigns. While less interpretable than simpler models, platforms handle deployment complexity.
Businesses often combine ML with other types for layered predictions, maximizing intervention impact across user segments.
You might like to read: AI & Machine Learning for Effective Marketing Automation Explained With Examples
Matching Churn Prediction Models to Your Business
Growth teams choose churn prediction models by aligning capabilities with data reality, team size, and retention priorities. Here’s how to match the right approach:
- Data maturity: Start with rule-based models when historical records are limited. Scale to statistical analysis after 12+ months of signals. Use machine learning only when millions of data points reveal complex patterns.
- Scale and volume: Rules handle under 10K monthly users efficiently. Statistical models suit 10K-100K bases. Machine learning powers enterprise volume while keeping segments granular.
- Speed vs. accuracy: Rules deploy instantly for quick wins. Statistical methods balance reliability and pace. Machine learning delivers maximum precision for high-LTV stakes.
- Operational fit: Rules require zero maintenance. Statistical models need periodic analyst updates. Machine learning runs autonomously once set up.
Test simple rules first, measure recovery lift, then add sophistication, ensuring predictions match proven business impact rather than technical ambition.
Interpreting Churn Prediction Scores
Churn prediction scores represent probabilities of customer attrition, typically ranging from 0 to 100%. A score of 75% indicates a high probability that a customer may churn within the model’s prediction window, such as 30 days. Marketers treat these as risk indicators to prioritize interventions, not definitive verdicts.
Probability Scores vs. Binary Outcomes
Unlike binary flags (“churn” or “stay”), probability scores enable nuanced segmentation. A 90% risk user demands urgent action like win-back offers, while 40% enters nurture tracks. This gradation matches budget to impact, focusing retention dollars where they yield the highest returns.
Risk Bands and Prioritization
Teams divide scores into bands for workflow efficiency: Low Risk (0-30%) for monitoring; Medium Risk (31-70%) for proactive engagement; High Risk (71-100%) for immediate campaigns. High-risk bands often represent just 10-20% of users but drive 80% of preventable losses. Prioritization ensures high-LTV customers receive tailored attention first.
Common Interpretation Mistakes
Overreacting to single scores ignores context, so a temporary dip might not signal true risk. Neglecting model timeframes leads to mistimed interventions. Treating all scores equally wastes resources on low-impact users. So, the best practice is to validate scores against business outcomes and A/B test interventions by risk band.
How to Use Churn Prediction in Retention Strategies
Churn prediction powers retention strategies by converting risk scores into targeted marketing actions that prevent attrition. Growth teams operationalize predictions through segmentation, personalization, and precise timing, turning forecasts into revenue recovery. This approach shifts retention from reactive firefighting to systematic customer lifecycle management.
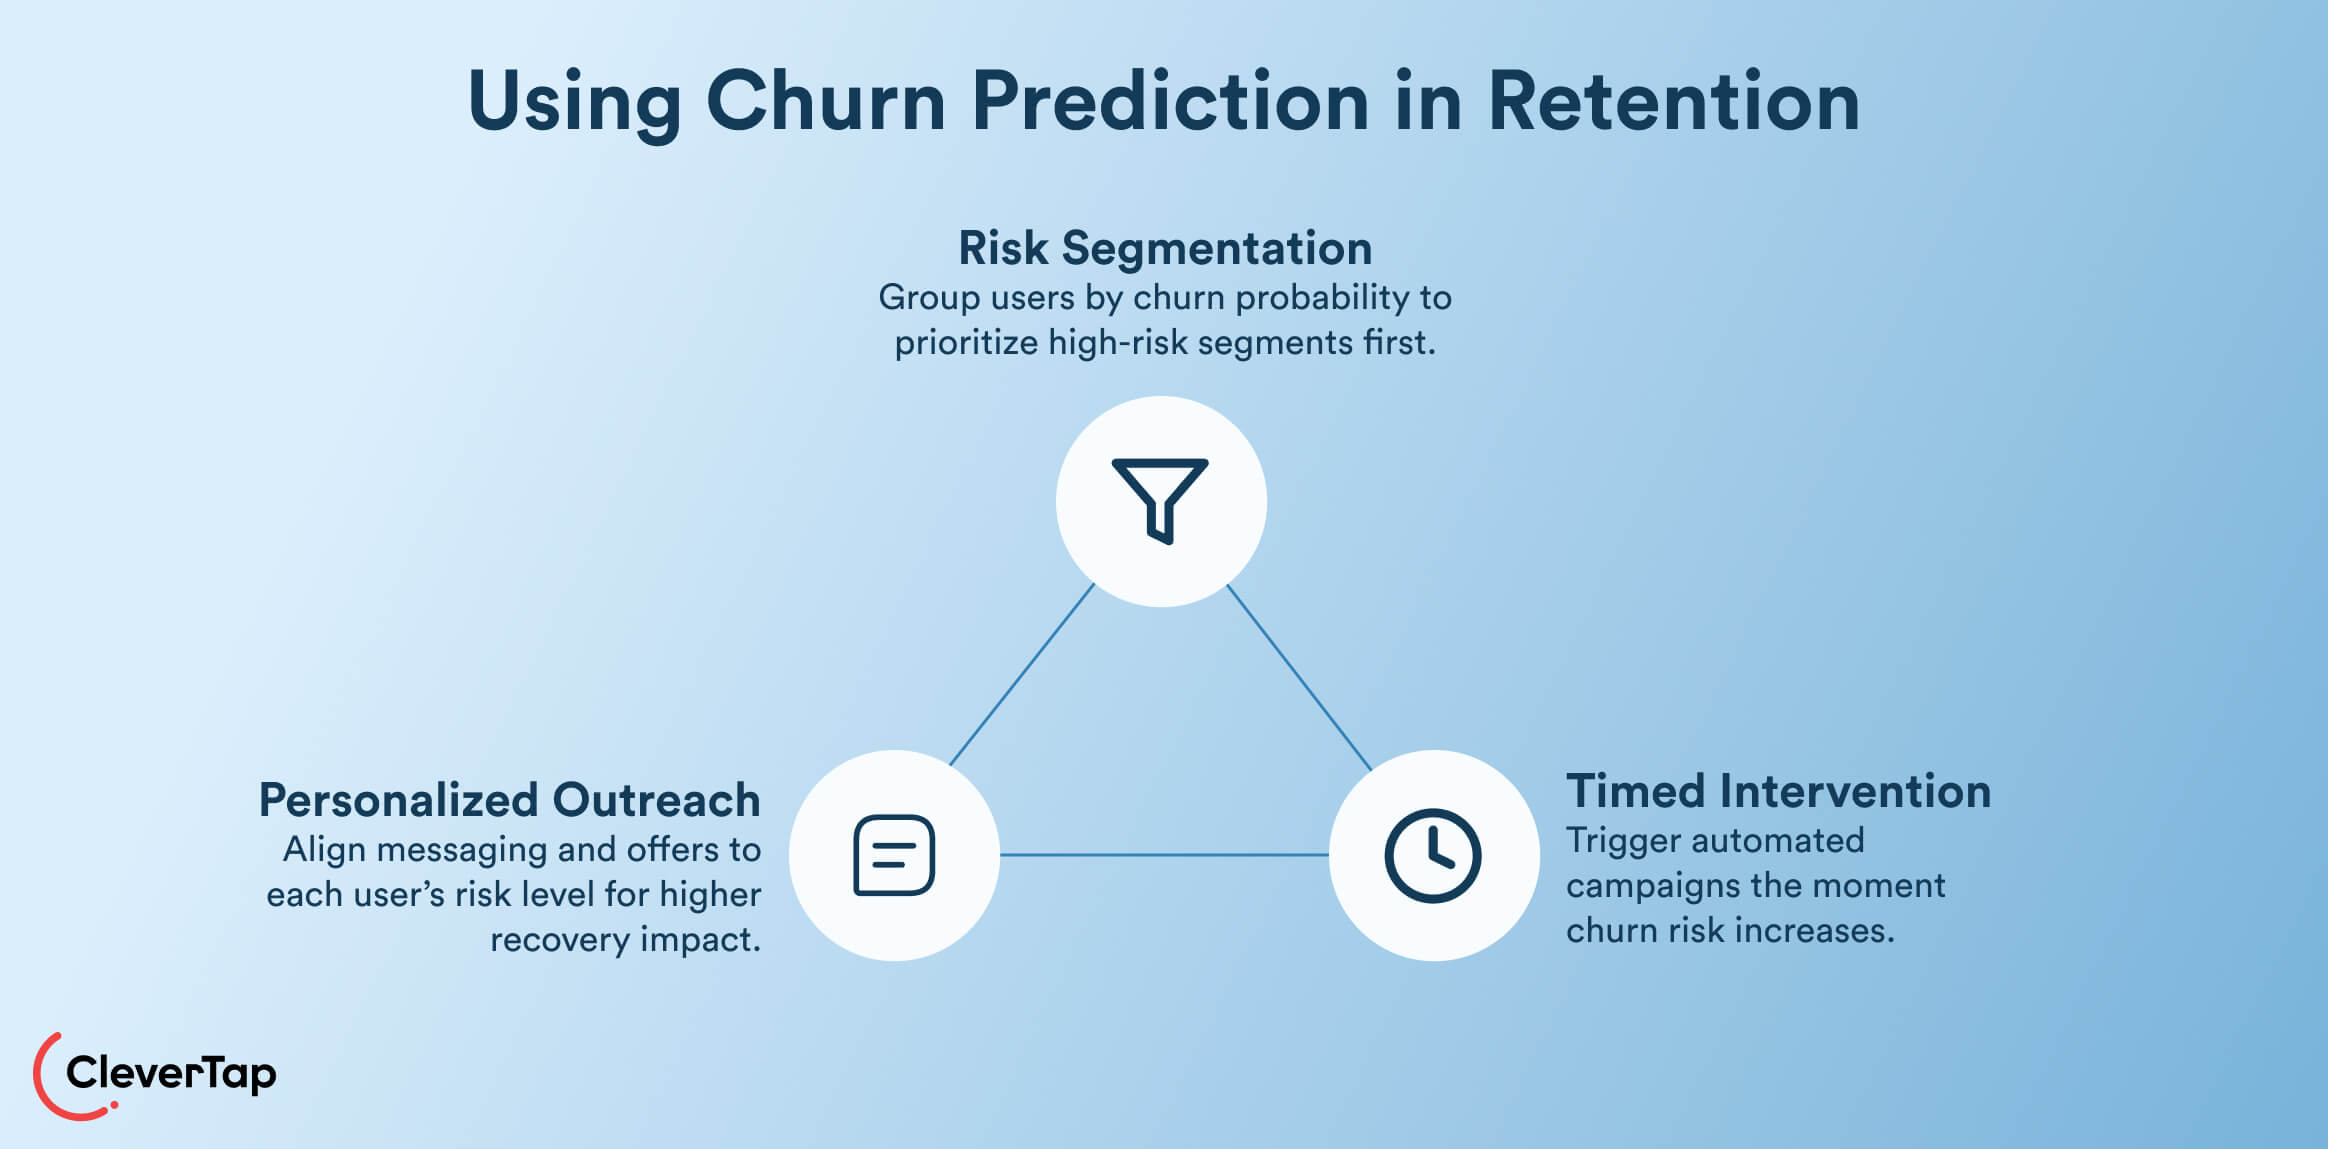
Segmenting Users by Churn Risk
Divide users into risk tiers based on prediction scores to allocate resources efficiently. High-risk segments (top 10-20% of scores) receive priority for win-back campaigns, as they represent most preventable losses. Medium-risk groups enter nurture flows with educational content or feature prompts. Low-risk users stay in standard engagement tracks. This Pareto-focused segmentation ensures high-LTV customers get disproportionate attention, maximizing ROI on retention spend. Regular scoring refreshes keep segments dynamic as behaviors shift.
For example, consider a streaming app where frequent viewers normally watch content several times per week. If one of these users suddenly stops watching for ten days and skips newly released shows, a churn prediction model may assign that user a high churn risk score. The retention team can then place that user into a high-risk segment and trigger a personalized notification highlighting new releases or offering a limited-time subscription incentive to encourage them to return.
Personalizing Engagement Based on Risk Level
Tailor content and offers to match risk profiles for higher conversion. High-risk users receive urgent, value-driven messaging: “Complete your purchase to unlock exclusive benefits” or “Reactivate now for bonus credits.” Medium-risk customers get soft re-engagement, like feature tips or loyalty reminders. Low-risk users see aspirational content reinforcing habits. Personalization leverages behavioral context—a dormant power user gets different treatment than a casual browser. A/B testing creative by risk band reveals optimal messaging combinations.
Timing Interventions Using Churn Signals
Execute campaigns at prediction-driven moments for maximum impact. High-risk scores trigger immediate flows within 24-48 hours, while medium-risk users enter 7-14 day sequences. Signal timing aligns with behavioral decay. Pre-renewal windows focus subscription teams on at-risk renewals 14 days out. Automated workflows ensure interventions scale across thousands of users while machine learning refines timing based on recovery data. Precision timing compounds prediction accuracy into retention results.
Challenges and Limitations of Churn Prediction
Churn prediction delivers powerful retention insights, but businesses must navigate real limitations to avoid overconfidence. Growth teams succeed by understanding these challenges upfront, pairing predictions with human judgment and continuous testing for sustainable results.
Data Quality Challenges
Predictions only prove accurate when fed clean, comprehensive data. Incomplete profiles, missing engagement history or transaction gaps, lead to false positives, wasting campaigns on safe users. Biased datasets from skewed samples (power users dominating records) miss signals from casual segments. Siloed sources create blind spots when app data doesn’t sync with payment systems. Marketers address this by auditing inputs regularly and starting with high-confidence datasets before scaling predictions.
Model Decay Over Time
Models degrade as customer behaviors shift, requiring ongoing maintenance. Seasonal changes like holiday spikes alter baseline patterns, dropping accuracy by 15-20% without retraining. Product updates introduce new features that old models can’t evaluate. Market dynamics shift churn drivers overnight. Retention teams counter decay through monthly validation against actual outcomes and automated retraining schedules.
Over-Reliance on Predictions Without Strategy
Scores alone don’t save customers; it is the execution that determines results. Ignoring business context leads to mistimed interventions, like bombarding new users flagged as “high risk” during normal onboarding. No testing framework wastes budget on unproven campaigns. Automation without oversight scales mistakes across segments. Successful teams treat predictions as inputs to strategy, not replacements, using A/B tests and recovery tracking to build winning playbooks.
How CleverTap Helps Marketers Predict and Prevent Churn
CleverTap is an all-in-one customer engagement and retention platform designed for B2C businesses. It helps marketing teams understand user behavior, predict churn risk, and act on those insights through personalized, omnichannel engagement campaigns.
Instead of requiring teams to build predictive models from scratch, CleverTap brings churn prediction directly into marketing workflows. Its built-in predictive analytics analyze customer behavior continuously, helping marketers identify users who are at risk of disengaging and trigger timely interventions before churn occurs.
At the foundation of this capability is CleverTap’s unified customer data platform, which consolidates behavioral, transactional, and lifecycle signals into a single 360° user profile. By analyzing this comprehensive dataset, the platform can detect patterns that signal potential churn.
These signals include:
- declining app sessions or login frequency
- longer gaps between purchases or transactions
- reduced feature usage or engagement
- incomplete onboarding journeys
- sudden drops in previously consistent activity
Because these signals are analyzed together rather than in isolation, churn predictions are more accurate and actionable.
Turning Churn Predictions Into Marketing Actions
What makes churn prediction valuable is the ability to immediately act on it. CleverTap connects churn risk insights directly to segmentation and campaign execution, allowing marketers to move from insight to action without switching tools.
Marketers can use churn risk scores to build dynamic segments such as:
- high-risk users showing declining engagement
- customers approaching renewal windows with reduced activity
- previously active users who have recently become dormant
- users stuck in onboarding who have not completed key activation steps
These segments update automatically as customer behavior changes, ensuring that retention campaigns always target the right users.
Launching Personalized Retention Campaigns
Once churn risk segments are created, marketers can trigger automated lifecycle campaigns across multiple channels, including push notifications, email, SMS, in-app messaging, and WhatsApp messaging.
For example:
- High-risk users can enter a win-back journey with personalized push notifications or limited-time incentives.
- Medium-risk users may receive feature education messages designed to increase product adoption.
- Low-risk users can continue receiving regular engagement campaigns that reinforce product value.
Because CleverTap combines segmentation, messaging, and experimentation in one platform, teams can continuously test and optimize their retention strategies. Marketers can run A/B tests on messaging, incentives, and timing across churn risk segments to identify which interventions most effectively reduce churn.
Supporting Retention Across the Entire Customer Lifecycle
Beyond individual campaigns, churn prediction insights help marketers strengthen their overall lifecycle strategy. Teams can proactively address churn risks at different stages of the customer journey, such as:
- onboarding drop-offs when new users fail to activate
- engagement declines among previously active customers
- subscription renewal risks before expiration dates
- dormant users who have gradually stopped interacting with the product
By identifying these risks early, marketers can shift from reactive retention efforts to proactive lifecycle management.
Instead of treating churn analysis as a retrospective reporting exercise, CleverTap enables teams to operationalize churn prevention within their everyday marketing workflows.
Start predicting churn before customers disappear. See how CleverTap helps marketing teams identify at-risk users & launch retention campaigns that bring them back.
Getting Started With Churn Prediction
Growth teams begin churn prediction by assessing current capabilities rather than building complex systems from scratch. This practical roadmap ensures quick wins while scaling toward sophistication.
- Start with a readiness audit: Map existing data sources like activity logs, purchase history, and support tickets. Confirm at least 6-12 months of historical records across 10K+ users for reliable baselines. Identify one high-impact segment as your pilot focus.
- Starting simple before scaling: Launch with rule-based thresholds, such as “no activity in 30 days,” to test intervention impact. Measure recovery lift from basic campaigns before investing in statistical or machine learning models. Success here builds internal buy-in and refines data pipelines.
- Aligning data, teams, and goals: Sync marketing, product, and analytics groups around shared KPIs like reduced churn rate or recovered revenue. Assign clear roles—marketers own campaigns, and analysts validate scores.
Pilot results in 4-6 weeks validate the approach, paving the way for enterprise-wide adoption. Retention becomes measurable from the first prediction cycle.
Conclusion
Churn prediction helps B2C marketers move from reacting to customer loss to preventing it before it happens. By analyzing behavioral signals and identifying at-risk users early, businesses can intervene at the right moment with targeted engagement, personalized offers, and lifecycle campaigns that keep customers active.
As this guide showed, successful churn prediction is not just about building models. It requires turning risk scores into actionable marketing strategies, from segmenting users by churn risk to launching timely re-engagement campaigns that restore engagement before customers leave.
Platforms like CleverTap make this process significantly easier by combining customer data, predictive analytics, segmentation, and omnichannel engagement into one system. Instead of treating churn analysis as a retrospective reporting exercise, marketing teams can continuously identify at-risk users and trigger retention campaigns that keep customers engaged throughout the lifecycle.
When churn prediction becomes part of everyday marketing workflows, retention stops being reactive and becomes a predictable growth lever.
Start predicting churn before customers disappear. Schedule a demo to see how CleverTap helps you identify at-risk users and launch smarter retention campaigns.
Subharun Mukherjee 
Heads Cross-Functional Marketing.Expert in SaaS Product Marketing, CX & GTM strategies.
Free Customer Engagement Guides
Join our newsletter for actionable tips and proven strategies to grow your business and engage your customers.
